HIGH NEGATIVE INTERFERENCE OVER SHORT SEGMENTS OF THE GENETIC STRUCTURE OF BACTERIOPHAGE T4
22
0
0
Full text
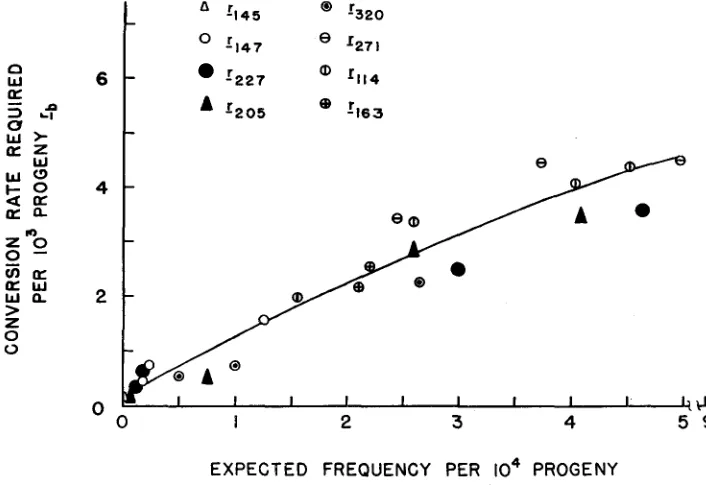
Figure

+7
Related documents