ABSTRACT
GIPSON, RACHEL SIMONE. Sensory Characterization of Specific Wood Smoke Aromas and their Contributions to Smoked Cheddar Cheese Flavor and Consumer Perceptions of Smoked Cheddar Cheese. (Under the direction of Dr. MaryAnne Drake).
Smoked cheeses are created by the addition of smoke flavoring to cheese milk or by natural cold smoking of curds or cheese using a variety of woods. Consumer interest in smoked cheese is growing, however, there is a need to understand the aromatics that smoke contributes and how the aromatics influence the flavor of smoked cheese. Furthermore, an understanding of the sensory properties and consumer perceptions of smoked cheese will help guide product development and meet consumer expectations.
high overall smoke and campfire/marshmallow flavors, and cedar smoked cheese was characterized by resinous flavors. Determination of the sensory properties of different wood smokes provides insight into the differences in smoke flavor contributions to smoked cheese.
In the second study, consumer perceptions of smoked cheese were evaluated through focus groups, surveys, and consumer acceptance testing. Three focus groups (n=29) were conducted with smoked cheese consumers. Following this, two online surveys were conducted. The first survey (n=1195) objective was to understand smoked food consumption habits and to identify if consumers consider smoked cheese to have more product attributes other than just ‘smoked’. Then, an Adaptive Choice-Based Conjoint (ACBC) (n=367) was conducted to evaluate ideal smoked cheese product builds and trade-offs for smoked cheese consumers. This survey also included Maximum Difference scaling and familiarity questions. Consumer
Sensory Characterization of Specific Wood Smoke Aromas and their Contributions to Smoked Cheddar Cheese Flavor and Consumer Perceptions of Smoked Cheddar Cheese
by
Rachel Simone Gipson
A thesis submitted to Graduate Faculty of North Carolina State University
in partial fulfillment of the requirements for the degree of
Master of Science
Food Science
Raleigh, North Carolina 2019
APPROVED BY:
_______________________________ _______________________________ Dr. MaryAnne Drake Dr. Dana Hanson
Chair of Advisory Committee
ii
BIOGRAPHY
Rachel Simone Del Toro-Gipson was born on November 29th, 1993 in Gilroy, California. Following high school, Rachel attended Gavilan Community College, where she graduated in 2014 with an Associate’s degree in Health Science. Rachel transferred to California Polytechnic University, San Luis Obispo, and graduated in 2017 with a Bachelor’s degree in Nutrition and a minor in Food Science. During her time as an undergraduate, she worked as a server at a local brewery, was a member of Alpha Omicron Pi sorority, ran a cooking blog, and participated in nutrition and food science research. Rachel’s academic goals took her to Raleigh in August 2017, where she pursued her Master’s degree in Food Science under the direction of Dr. MaryAnne Drake. Rachel worked in the lab for just under 2 years while completing her degree, and
iii
ACKNOWLEDGEMENTS
To my mom, thank you for supporting me even though my endeavors took me far away from you. Your strength and resilience have helped me learn the value of my own strength, and your encouragement has helped me persevere through this chapter. To my brother, thank you for making me feel ‘cool’ for wanting to be a scientist and for patiently answering all of my novice questions about computer programming. To Liz and Gianna, thank you for visiting me and for the constant friendship that has never wavered and only grew stronger during my time away. To Lee, thank you for making sure I ate dinner on long workdays and for just being you. To my friends who became my family when I could not fly home to see my own, thank you for teaching me that home is not merely a place, but a feeling.
iv
TABLE OF CONTENTS
LIST OF TABLES ... vi
LIST OF FIGURES ... vii
CHAPTER 1: LITERATURE REVIEW. EVALUATION METHODS FOR SMOKING CHEESE AND SENSORY METHODOLOGY USED TO EVALUATE AROMAS AND CONSUMER PERCEPTIONS OF SMOKED CHEESE...1
Introduction ...2
Different Wood Sources and Their Effect on Generated Wood Smoke ...2
Smoked Foods ...4
Smoked Foods ...5
Smoked Cheese ...8
Process of Smoking Cheese ...10
Liquid Smoke and Smoke Flavoring ...10
Cold Smoking ...13
Objective Sensory Analysis Methods ...15
Descriptive Analysis ...15
Projective Mapping ...17
Methods to Measure Consumer Acceptance...19
Conjoint Analysis...19
Maximum Differential Scaling ...22
Consumer Acceptance Testing ...24
Objectives ...25
References ...26
CHAPTER 2: SENSORY CHARACTERIZATION OF SPECIFIC WOOD SMOKE AROMAS AND THEIR CONTRIBUTIONS TO SMOKED CHEDDAR CHEESE FLAVOR ...35
Abstract ...37
Introduction ...38
Materials and Methods ...40
Experimental Overview ...40
Projective Mapping ...40
Smoked Cheese ...42
Descriptive Sensory Analysis ...42
Statistical Analysis ...43
Results ...44
Projective Mapping ...44
Descriptive Sensory Analysis ...45
Discussion ...46
Conclusion ...48
Acknowledgments...49
References ...50
v
Abstract ...60
Interpretive Summary ...61
Introduction ...61
Materials and Methods ...64
Focus Groups ...64
General Survey...64
Smoked Cheese Survey...65
Descriptive Analysis ...66
Central Location Testing...67
Statistical Analysis ...69
Results ...71
Focus Groups ...71
General Survey...72
Conjoint Analysis...72
MaxDiff...74
Descriptive Analysis of Smoked Cheese ...75
Central Location Testing of Smoked Cheese...75
Discussion ...78
Focus Groups ...78
Surveys ...79
Descriptive Analysis and Consumer Acceptance Testing ...80
Conclusion ...83
Acknowledgements ...83
References ...84
APPENDICES ...109
APPENDIX A: Factor loadings for descriptor tags for smoke aroma projective mapping...110
APPENDIX B: Selection frequency of product and smoke combination selection (Survey 1) ...111
APPENDIX C: Demographic information for ACBC consumer clusters (Survey 2) ...114
vi
LIST OF TABLES
Table 1.1 Aroma active constituents of smokes ...34
Table 2.1 Orthonasal aroma attributes for projective mapping and descriptive analysis of wood smokes ...52
Table 2.2 Proximate analysis means for duplicate 10 kg blocks of Cheddar cheese ...53
Table 2.3 Frequency of selection of attributes for projective mapping of smokes by trained panelists ...56
Table 2.4 Mean sensory attributes of smoked Cheddar cheeses ...57
Table 3.1 Product options in the general survey (Survey 1) ...87
Table 3.2 Attributes and levels used in the ACBC conjoint survey (Survey 2) ...90
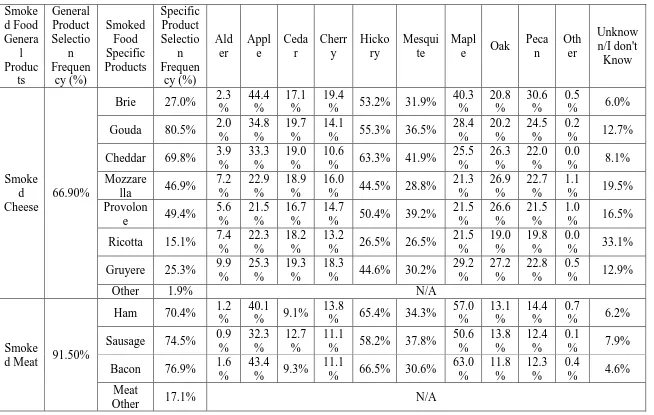
Table 3.3 Smoked foods general and specific product and specific-wood smoke selection frequency (n=1195 consumers) (Survey 1) ...91
Table 3.4 Attribute importance scores for consumer clusters (Survey 2) ...95
Table 3.5 Scaled importance scores for smoked cheese attributes (n=367), (Survey 2) ...97
Table 3.6 Maximum Difference (MaxDiff) scaling of smoked cheese attributes by cluster (n=367), (Survey 2) ...98
Table 3.7 Trained panel mean sensory attributes of smoked Cheddar cheeses and unsmoked control Cheddar cheeses ...99
Table 3.8 Consumer acceptance scores for smoked cheese (n=135) ...101
vii
LIST OF FIGURES
Figure 1.1 Flowchart of method of producing a block of smoked cheese ...33
Figure 2.1a Projective map of wood smoke aromas (Dimensions 1 and 2) ...54
Figure 2.1b Projective map of supplemental variables used to describe smoke aromas
(Dimensions 1 and 2) ...54 Figure 2.2a Projective map of wood smoke aromas (Dimensions 1 and 3) ...55
Figure 2.2b Projective map of supplemental variables used to describe smoke aromas
(Dimensions 1 and 3) ...55 Figure 3.1 Moderator guide for smoked cheese focus groups ...88
Figure 3.2 Overall mean utility scores for attribute levels for the total
population (n=367) from the smoked cheese conjoint survey ...93 Figure 3.3 Attribute importance scores from smoked cheese conjoint survey
for segmented consumer clusters. (Survey 2) ...94 Figure 3.4 Mean utility scores from smoked cheese conjoint survey for
segmented consumer clusters. (Survey 2) ...96 Figure 3.5 Principal component biplot of smoked Cheddar cheeses ...100
1
CHAPTER 1:
LITERATURE REVIEW. EVALUATION METHODS FOR SMOKING CHEESE AND SENSORY METHODOLOGY USED TO EVALUATE AROMAS AND CONSUMER
2
INTRODUCTION
Smoked cheese is a growing specialty category of flavored cheese. Smoked cheeses are created by the addition of smoke flavoring to cheese milk or by natural cold smoking of curds or cheese, using a variety of woods. With increased consumer interest and category growth, there is a need to understand the specific flavors imparted by different wood smokes. The determination of sensory properties of different wood smokes can give insight into the characterization of differences in smoke flavorings. Furthermore, the determination of the sensory properties specific to smoked cheese will provide cheese manufacturers with an understanding of the consumer perceptions of their products. This literature review will explain how a variety of sensory methodologies can be used to characterize the aromatic properties of different wood smokes and smoked cheeses, as well as how the raw materials and processing involved in the smoking process contribute to the final smoked cheese product.
DIFFERENT WOOD SOURCES AND THEIR EFFECT ON GENERATED WOOD
SMOKE
3
degradation, and partial oxidation of the wooden material, as well as dispersed soot and compounds present in fluid or particle form (Sikorski and Kołakowski, 2010).
Sources of wood can be classified into two main groups, hardwood and softwood. These type of woods differ in their composition. Softwoods have more lignin and more resin
extractives and are comprised of woods such as cedar and pine. Hardwoods are higher in syringol derivatives and softwood has more guaiacol derivatives, which causes them to produce distinct smokes that vary in amount of phenolics. Hardwoods are comprised of woods such as oak and cherry (Pallu, 1971; Maga, 1988; Maga, 1992). The three major components of woods include hemicellulose, cellulose, and lignin. Hemicellulose is usually composed of a combination of five-carbon sugars including glucose, mannose, and galactose. Cellulose is a long chain
4
homologs, water, furans and phenolic compounds. Thermal degradation of hemicellulose produces furans and carboxylic acid. The products of decomposition of cellulose and hemicellulose occur as a result of caramelization from Maillard reactions, and it has been hypothesized that this process produces fruity and floral scents due to combustion at lower temperatures, however, this has not been confirmed through sensory analysis (Sikorski and Kołakowski, 2010). Pyrolysis of lignin generates phenolic compounds and ethers, in addition to carbonyl, acidic and alcoholic compounds (Sainclivier, 1985; Miler and Sikorski, 1990).
Smoke can be generated at a relatively low temperature, representing primarily
hemicellulose degradation. Under these conditions, lignin might not be completely degraded and the resulting smoke would have a different composition than if a higher temperature were
utilized (Maga, 1992). Wood smoke is comprised of air, water vapor, carbon dioxide, carbon monoxide, and several hundred organic compounds in different concentrations; many of the compounds have been identified through chromatographic and spectral analytical methods. Despite being able to know the factors that affect the generation of compounds in wood smoke, there has not yet been an advance made in predicting the exact content of various compounds in the smoke (Sikorski and Kołakowski, 2010).
SMOKED FOODS
5
(Chambers et al., 1998). Smoking food is a popular artisan technique that adds flavor and depth to food products.
Smoked Foods
The aromatic character of smoke is influenced by the following factors: type of wood, method of smoke generation, method of smoke collection, and the process and conditions of combustion (Fujimaki et al., 1974). Early studies speculated about potential origins of smoke flavor in order to characterize the types of aromas produced. These studies hypothesized that characteristic smoky flavor did not appear to be limited to one class of compounds, but instead was a blend of compounds belonging to many different classes (Fiddler et al., 1970).
Initial attempts to characterize smoke began with identification of phenols. A study done by Fujimaki et al. (1974) reported that the quantity and composition of flavor components in the carbonyl, non-carbonyl, neutral/basic, acidic and phenolic fractions of smoke contributed to differences in aroma; the phenolic fraction being the most important. Smoke was collected from 6 different types of wood and was distilled to create smoke condensate. Flavor constituents were then extracted from the condensate and separated by gas chromatography. Sensory evaluation of the distilled smoke condensate, along with gas chromatography-mass spectrometry (GC-MS), indicated that differences in aroma were due to differences in relative amounts of carbonyl, non-carbonyl, neutral, basic, acidic, and phenolic compounds, rather than the presence of distinctly different compounds (Fujimaki et al., 1974). Other studies have confirmed that phenolic compounds play an important role in smoke flavor (Maga, 1992).
6
(Wittkowski et al., 1992). Lignin is an amorphous, polyphenolic material that is formed through enzymatic dehydrogenative polymerization of three phenylpropanoid monomers, coniferyl alcohol, sinapyl alcohol, and p-coumaryl alcohol. Lignin is a main component of vascular plants, and as such, it contributes 24-33% to normal softwoods and 19-28% of temperate-zone
hardwoods. Lignified wood cells contain lignin; in most wood cells, lignin binds and stiffens wood fibers through its distribution within the cell walls. Within wood, lignin is essential to the internal transport of water, nutrients, and metabolites. Lignin is responsible for the rigidity within cell walls and binds wood cells to make them resistant to compression, impact, bending and biological degradation (Gargulak et al., 2002). In the context of smoke production, lignin must go through lignin pyrolysis, a decomposition step, in order to produce flavor compounds such as phenols, which are associated with smoke aroma.
In lignin pyrolysis, the guiacol derivatives that are produced at 250-300 °C form pyrocatechols. Subsequently, methylated products are developed and methyl radicals are generated with the alkyl cleavage of the methoxy group occurs, creating alkyl and
dialkylphenols. Phenols are strongly concentrated when condensing smoke in an aqueous solution (Wittkowski et al., 1992). However, several studies have also established the
contributions of other compounds to smoke aromas (Porter et al., 1965; Fidler et al., 1970; Kim et al., 1974; Hruza et al., 1974). Maga and Fapojuwo (1986) reported that the carbonyl fraction of smoke was the primary contributor to flavor for most woods. The carbonyl fraction of wood smoke originates through thermal decomposition and rearrangement of cellulose and
7
the phenolic fraction in many smoke sources. The sawdust of eight wood types was used to generate smoke, which was condensed and fractionated into a total ether extract, and then into carbonyl, neutral, basic, and phenolic fractions. The intensities of each fraction were evaluated by sensory analysis and recorded for each respective wood source. This study indicated that classes of compounds other than phenolics contributed significantly to smoke aroma. For most wood smokes (excluding mesquite), the phenolic fraction contributed to smoke intensity but statistically was not the major contributor to smoke intensity (Maga and Fapojuwo, 1986).
Further studies were able to identify over 400 volatile compounds in wood smoke; most of which were carbonyls and phenols (Maga, 1992). Additionally, Cadwallader (1996) compared aroma extracts prepared from hickory and mesquite liquid smokes by gas chromatography-olfactometry (GCO) and aroma extraction dilution analysis (AEDA). Results indicated that while phenolic compounds were key components of smoke flavor, other constituents such as carbonyls and acids were important contributors to smoke aroma (Cadwallader, 1996). Additionally, a simpler explanation for the varying components within wood smoke was presented by Sikorski and Kołakowski (2010) related to the composition of wood smoke generated from a smokehouse. They suggested that due to the action of the gravitation and centrifugal forces within a
smokehouse and the temperature gradient, some components are deposited on smoked goods, while others are deposited in smoke ducts and on the walls of the smokehouse, causing a change in the concentration of the smoke (Sikorski and Kołakowski, 2010).
8
focused on smoke condensate fractions, which provided information about how each fraction contributed to the overall smoke intensity of each smoke. Another study by Mcilveen and Vallely (1996) involved a mixture of discrimination and descriptive tests where panelists
evaluated smoked processed cheese products using scaling techniques. The objective of the study was to generate an ideal recipe for processed smoked cheese. Consumers of processed, smoked cheese (n=50) participated in an acceptance test in which they tasted a processed cheese that had been cold smoked for five hours, and a cheese that had added 4% (w/w) smoke flavoring. The cheese with smoke flavoring was preferred. Researchers concluded that by smoking food, value can be added to an otherwise bland product and a selling point created. However, the use of added flavorings and the image often attached to processed cheese may need further
consideration (Mcilveen and Vallely, 1996).
Smoked Cheese
The smoky flavor of smoked cheese occurs when the compounds within the smoke particulates are deposited on the product surface. Mcilveen and Vallely (1996) found that the higher the intensity of smoke, the greater its absorption into the food. It was hypothesized that smoke particle condensation on food surfaces was reduced as temperature decreased. However, if relative humidity is high, steam will condense on the surface of the product and increase the absorption of the water-soluble parts of the smoke (Mcilveen and Vallely, 1996). The
compounds that contributed to the formation of the smoky flavor through smoke production were mainly the following phenolic compounds; syringol, 4-methylsyringol, 4-allylsyringol, guaiacol, 4-methylguaiacol, and trans-isoeugenol. Carbonyl compounds, furans, and other smoke
9
components as they contributed to flavor have not been disclosed (Sikorski and Sinkiewicz, 2014).
10
PROCESS OF SMOKING CHEESE
The process of smoking cheese occurs commercially through two main methods, the addition of liquid smoke to cheese milk or cold smoking of cheese blocks or fresh cheese curds. Liquid smoke is a condensed smoke flavoring that is produced by condensing and purifying the smoke emitted from burning wood (Mcilveen and Vallely, 1996). When wood is burned, the thermal decomposition of the wood followed by oxidation generates many solid, liquid, and gaseous compounds. The compounds differ in boiling point, solubility, chemical properties, and their involvement in food smoking (Sikorski and Sinkiewicz, 2014). In contrast, the process of cold smoking involves applying smoke to a food product at room temperature for a designated amount of time. Smoking methods are normally characterized by the temperature used. Cold smoking is characterized by the range of 12-25 °C, warm smoking occurs at 23-45 °C, and hot smoking occurs in a range of 50-90 °C to accommodate for thermal denaturation of meat
proteins (Sikorski and Kołakowski, 2010). The cold smoking method is most commonly utilized with cheese in order to prevent the product from melting so that it can maintain a more stable structure (Mcilveen and Vallely, 1996).
Liquid Smoke and Smoke Flavoring
11
and phenols. These components vary and the chemical composition of liquid smoke depends primarily on the wood type and moisture content of the wood. The moisture content has a significant influence on the pyrolysis temperature and the duration of the smoke generation (Guillen and Ibargoitia, 1999; Cadwallader, 2007).
Prior to a study by Fiddler et al. (1970), it was hypothesized that the characteristic smoke aroma did not originate from just one compound, but from multiple compounds. The study involved fractionation of an ether extract concentrate of a commercial liquid smoke solution through gas-liquid chromatography. A sensory test (n=30) was conducted in which panelists were asked to select the smokier sample of the two samples of frankfurters treated with different fractions of smoke. The frankfurters were dipped into solutions of the various fractions for approximately 15 seconds and then were cooked in a commercial smokehouse. Panelists were asked to score the intensity of the sample they perceived to be smokier for degree of smokiness on a 7-point scale where 0=not smokier and 5-6=considerably more smoky than the other member of the pair. After analyzing gas-liquid chromatography results and conducting the sensory evaluation, it was determined that the characteristic smoky flavor of the liquid smoke concentrates contained primarily phenols and carbonyls (Fiddler et al., 1970). Further
12
and color of smoked food through protein interactions and Maillard reaction products (Varlet et al., 2007).
There is some debate over the consumer acceptability of liquid smoke, because of its seemingly ‘unnatural’ method as a source of smoke. Liquid smokes are either full-strength or refined to have better control over polycyclic aromatic hydrocarbon (PAH) content, a wider diversity of applications to food systems, superior product homogeneity, ease of storage, and less environmental pollution (Montazeri et al., 2013). PAHs are compounds containing two or more condensed aromatic rings, and comprise the largest class of carcinogenic compounds
(Cadwallader, 2007). Several determinants of PAH in smoked foods include temperature during smoking, as well as wood composition and more specifically lignin content. Products that experience direct smoke exposure tend to have higher PAH concentration than products with liquid smoke flavorings, which can have complete elimination of PAH through condensation and processing (Cadwallader, 2007). Due to differences in various smoked foods regarding
mutagenic and carcinogenic activities of PAH, it is difficult to predict the degree of health hazard caused by these compounds in smoked foods and can potentially be seen as a deterrent to
13 Cold Smoking
Smoking methods are normally characterized by the temperature used. Smoking methods include cold smoking, where the temperature does not exceed 30°C, warm smoking at around 40°C, and hot smoking, a combination of intense heat (80°C) and smoke (Mcilveen and Vallely, 1996). Cold smoking is used during smoked cheese production because it prevents the product from melting and allows it to maintain its structure (Mcilveen and Vallely, 1996). During cold smoking, the product must be arranged in the smoking unit to allow for uniform smoke
absorption, temperature exposure, and drying (“Summary of Cold Smoking Process”, 2001). Further considerations in contemporary industrial smoking include: the temperature of smoke generation, proper circulation of the smoke, and drying air in order to reach the required degree of uniformity of smoke deposition, water evaporation, and heating, as well as to control all process parameters affecting the quality of the products (Sikorski and Kołakowski, 2010).
14
smoke affects the sensory properties of the final smoked product and controls the rate of the process (Sikorski and Kołakowski, 2010). In recent years, there have been several developments to traditional smoking methods. Sikorski and Kołakowski (2010) noted that these developments included control of composition of smoke by use of established procedures of smoke generation, use of engineering principles regarding heat and mass transfer to optimize the processing,
modernization of smokehouses to improve the smoke generation and the process, as well as treatment of spent smoke to decrease pollution effects. Specifically for smoking methods related to cheese products, McLeod (2017) submitted a patent for natural wood smoking of cheese curds. Using this method, a smoked block of cheese is prepared by exposing the cheese curds, rather than the pressed block of cheese, to natural wood smoke. By this process, the block of cheese is evenly smoked in a short period of time. This process is a stark contrast to the traditional method of cold smoking cheese, which is a batch process (rather than a continuous process) and requires several days in a smokehouse for even smoking. Naturally smoked
cheeses by the traditional cold smoking method typically have a gradation of smoked flavor from the exterior to the interior. The newer process of adding liquid smoke to cheese milk produces a cheese with an even intensity of smoke flavor but the product is ‘smoke-flavored’ and not
15
development of dark color because it increases the concentration of the components of the dispersing phase of smoke. Higher temperatures also increase the rate of the carbonyl-amino reactions and polymerization of various components (Sikorski and Kołakowski, 2010). Studies have also found that a significant contribution of the color of smoked food products comes from the reaction of the carbonyl compounds: glycoaldehyde and methylglyoxal mainly found in the vapor phase of smoke, with the amino groups of proteins and nonprotein nitrogen compounds. The smoke phenols react with proteins at weak alkaline conditions and form colors as a result of the reaction (Ziemba, 1969; Ruiter, 1979).
OBJECTIVE SENSORY ANALYSIS METHODS
Objective sensory analysis methods are used to generate data that is analytical in nature using trained panelists. Some examples of objective sensory methods include difference tests, threshold tests, and descriptive analysis. The goal of an objective sensory analysis method is for the panel to act as an instrument and produce data that is analogous to instrumental data (Lawless and Heymann, 2010).
Descriptive Analysis
Descriptive analysis is a widely used sensory technique in which a trained panel generates a complete product profile (Lawless and Heymann, 2010). The qualitative attributes that are analyzed in descriptive analysis include aroma, appearance, flavor, texture, aftertaste and sound properties of a product. A major strength of descriptive analysis is its ability to allow relationships between descriptive sensory and instrumental or consumer preference
16
Texture Profile Method, Quantitative Descriptive Analysis™, Spectrum Method™, Quantitative Flavor Profiling, Free-choice Profiling, and generic descriptive analysis. Despite different methodologies, several elements of a descriptive analysis panel are essential to all processes. Descriptive analysis methods require panelists with some degree of training in evaluating the product. Following the formation of a panel, there is a need to develop a common language to describe product attributes. Then, the panel is trained to use a common frame of reference to define attributes of a product and their intensities on a scale, relative to reference points. Procedures during descriptive analysis training are related to the method chosen, as well as the time requirement for training and the products available (Murray et al., 2001).
Following data collection from descriptive analysis, there are several statistical
procedures used in data analysis. Data analysis within descriptive analysis aims to understand how samples differ in their sensory aspects, which differences can be reported as repeatable as opposed to chance variation, and how are panelists performing as a whole, as well as individuals. In order to determine differences between samples, the samples are initially compared based on mean scores to understand variation. The analysis used for this task is an analysis of variance, also called an ANOVA. The purpose of an ANOVA is to determine if variation in sample means is greater than that expected from panel variation alone. Once there are confirmed variations among samples, a principal component analysis (PCA) can be conducted, provided there are a sufficient number of samples to conduct a PCA. This multivariate technique gives a low dimensional representation of sample differences in a multidimensional sensory space, by
17
centroid of attribute means, and determine the multivariate sample space that explains sample variation (Kemp et al., 2018).
Projective Mapping
Projective mapping is a multidimensional data collection method in which panelists place products directly into a two-dimensional space based on their perceived similarity (Nestrud and Lawless, 2010). Early foundations of projective mapping were sorting techniques. Sorting is a form of nominal measurement; pairs of products are placed either in the same category or not for each subject. Nestrud and Lawless (2010) conducted a study comparing sorting and projective mapping by employing both methodologies to generate product maps and cluster analyses separately for cheese and apples. The binary nature of sorting may have limitations based on the dimensions related to certain areas of the plot, while projective mapping allowed less strongly related dimensions to emerge. Several studies have also investigated the ability of projective maps to clearly represent a product space (Giménez et al., 2014; Vidal et al., 2016). Other studies have found that comparison of descriptive analysis data and projective mapping data shows distinct relationships between data (Nestrud and Lawless, 2008; Kennedy and Heymann, 2009; Albert et al., 2011) and another study suggested that projective mapping is a potential alternative to descriptive analysis if descriptive analysis is not available (Bárcenas et al., 2005).
18
mapping data include Generalized Procrustes Analysis (GPA), Principal Component Analysis (PCA) and Multiple Factor Analysis (MFA). Generalized Procrustes Analysis (GPA) involves product coordinates grouped within assessors (King et al., 1998; Nestrud and Lawless, 2008; Risvik et al., 1994). Principal Component Analysis (PCA) involves product coordinates as separate attributes for which the assessors significantly differentiate the products (Pagès and Husson 2001; Nestrud and Lawless, 2008; Risvik et al., 1997). Multiple Factor Analysis (MFA) is a newer method which involves a scaled PCA analysis that provides information about the perceptual differences between subjects (Pagès and Husson, 2001; Pagès, 2004).
These three methodologies have been compared and the results showed that they generated similar profiles for samples based on RV coefficients, which is a type of multivariate correlation coefficient (Nestrud and Lawless, 2008). A study conducted by Perrin et al. (2009) found that projective mapping and descriptive analysis separately gave similar product
19
METHODS TO MEASURE CONSUMER ACCEPTANCE
Conjoint Analysis
Conjoint analysis is a technique that measures consumer trade-offs through survey responses to preferences and intentions to buy (Green, 2004a). Within a conjoint analysis, there are profiles and choice sets. A product may have three attributes, A, B, and C, and within each attribute there are four levels: a1, a2, a3, a4, b1, b2, b3, b4, c1, c2, c3, and c4. A product profile could consist of a1, b3 and c2, while a choice set could consist of {(a1, b2, c3); (a2, b1, c4); (a4, b3, c2); (No Choice)}. When preferences are made for a product profile, the resulting data is a rating or a rank. Preferences about choices by consumers are made amongst items in a choice set (Rao, 2010).
Early development of conjoint analysis was conducted by Green and Rao (1971). Green and Rao suggested that conjoint analysis would be useful for finding component utilities for different factors of a product when they are jointly considered, such as how the varying levels of 3 specific attributes influence consumer perceived purchase intent for a product. Another
20
The types of conjoint analysis that are commonly used today are traditional full-profile conjoint analysis, adaptive conjoint analysis, choice-based conjoint, and adaptive choice-based conjoint. Traditional full-profile conjoint analysis was the original conjoint method. This method is limited by the amount of attributes and levels that can be shown to respondents, as it is
fatiguing. Adaptive conjoint analysis (ACA) was developed to handle large numbers of
attributes. ACA incorporates the presentation of pairs of partial profiles, generally consisting of levels of two or three attributes from a full set of attributes (Green, 2001). ACA requires
respondents to rank or rate attribute levels and to then assign importance values to each attribute. Choice based conjoint (CBC) analysis uses stated choices. This method measures consumer responses to questions that reflect consumer decision-making and measures interactions between attributes to determine if they have an effect on a choice or if two attributes are correlated. Adaptive choice-based conjoint (ACBC) analysis employs an adaptive experience that generates an individually designed survey based on respondent previous responses. ACBC begins with a consider-then-choose model where respondents are presented with a variety of product concepts, and then they choose products based on the responses they gave. Finally, respondents participate in a section where they choose products from a series of product concepts (Jervis et al., 2012).
A conjoint methodology is based on a decompositional approach in which respondents react to a set of ‘total’ profile descriptions, and then part-worths of importance are consistent with the respondents preferences (Green and Srinivasan, 1978). A conjoint analysis first begins with selecting a model of preference, such as a mixed model. Options for preference models include the vector model which is linear, the ideal point model which is linear and quadratic, a part-worth function model which is piecewise linear, and a mixed model in which some
21
models (Green and Srinivasan, 1990). Following this, data collection is needed. Data collection may entail questioning consumers about the attributes that matter most to them, or the attributes that are most relevant (Braun and Srinivasan, 1975). Then, the stimulus profiles are constructed for the full-profile method. This involves investigating how many stimuli are needed, the range of attribute variation and inter-attribute correlation in constructing the stimuli, and how stimuli themselves should be constructed. Following this, a decision must be made about how the stimulus should be presented. Several approaches used include verbal descriptions, paragraph descriptions, and pictorial representations. The dependent variable in the experiment must also have a defined measurement scale to measure the calculate response, such as preference or likelihood to purchase the product. The final step is to generate an estimation method. These range from methods that assume the dependent variable is ordinally scaled, intervally scaled, or methods that relate paired comparison data to a choice probability model (Green and Srinivasan, 1978).
22
specifics within the study. As a result, the importance scores can only be compared within a study but not across studies with different attributes (Orme, 2010).
Conjoint analysis is a useful tool in sensory analysis as it allows consumers to evaluate product and concept builds. A study conducted by Jervis et al. (2012) compared ACBC and CBC to determine key choice attributes of sour cream with a limited sample size. The study found that both methods provided similar outcomes for consumer preferences for different sour cream products. Additionally, with ACBC conjoint, the researchers were able to estimate perception of brand as well as work with smaller sample sizes and still generate actionable data (Jervis et al., 2012). Other studies have successfully characterized experiences with products by using conjoint analysis as a way to guide product development (Mahanna et al., 2009; Lawless et al., 2013) , or as a way to understand packaging (Gadioli et al., 2013; Mesías et al., 2013).
Maximum Differential Scaling
23
of belonging, excitement, warm relationships with others, self-fulfillment, being well respected, fun and enjoyment of life, security, self-respect, and a sense of accomplishment (Kahle et al., 1988). The scale is derived from Rokeach’s values, and has 9 items that can be measured easily and is well suited to group comparisons (Lee et al., 2007). An understanding of the values that drive the individual allows for a complete understanding of the motivations and behaviors that influence consumer purchases and liking.
A sensory-driven theory behind best-worst scaling is that it is an extension of a paired comparison test (David, 1988; Thurstone, 1927; Buck et al., 2001; Duineveld et al., 2000; Léon et al., 1999; Liem et al., 2004). Instead of choices amongst pairs, the choices are made amongst larger sets of items and best worst scaling identifies the best and worst items. When participants have to select a best and worst or most and least liked item out of a large set, best worst scaling gives more information than a paired comparison, with less input overall. There is also evidence to the theory that best worst scaling allows for increased discrimination of items in a set, because there is a lack of discrimination when items are rated with a monadic rating, as is done in
preference and importance scores (Jaeger et al., 2008).
24
exercise. Conclusions from the MaxDiff survey were generally in agreement with attribute ratings from the ACBC and CS exercises, and additionally the MaxDiff provided further insight as to the relative importance of specific protein attribute levels for consumers.
Consumer Acceptance Testing
25
OBJECTIVES
The objectives of this thesis are to characterize the sensory properties of smoke from different woods alone, and then continue the application to Cheddar cheese. Following these objectives, sensory methods will be used to evaluate consumer perception of smoked cheese. The determination of sensory properties of different wood smokes will give insight into the
26
REFERENCES
(2001), Summary of Cold‐Smoking Process. Journal of Food Science, 66: S1118-S1120. doi:10.1111/j.1365-2621.2001.tb15533.x
Albert, A., Varela, P., Salvador, A., Hough, G., and Fiszman, S. (2011). Overcoming the issues in the sensory description of hot served food with a complex texture. Application of QDA®, flash profiling and projective mapping using panels with different degrees of training. Food Quality and Preference,22(5), 463-473. doi:10.1016/j.foodqual.2011.02.010
Baltes, W., Wittkowski, R., Söchtig, I., Block, H., & Tóth, L. (1981). Ingredients of Smoke And Smoke Flavor Preparations. The Quality of Foods and Beverages, 1-19. doi:10.1016/b978-0-12-169102-8.50007-6
Barcenas, P., Elortondo, F.P., & Albisu, M. (2005). Sensory Comparison Of Several Cheese Varieties Manufactured From Different Milk Sources. Journal of Sensory Studies,20(1), 62-74. doi:10.1111/j.1745-459x.2005.00004.x
Beall, F.C. and Eickner, H.W. 1970. Thermal degradation of wood components. U.S.D.A. Forest Service Research Paper FPL 130:1-26
Braun, Michael A., and Srinivasan, V. (1975). "Amount of Information as a Determinant of Consumer Behavior Towards New Products". 1975 Combined Proceedings, Chicago: American Marketing Association, 373-8.
Buck, D., Wakeling, I., Greenhoff, K., & Hasted, A. (2001). Predicting paired preferences from sensory data. Food Quality and Preference,12(5-7), 481-487.
doi:10.1016/s0950-3293(01)00041-6
Cadwallader, K.R. (2007). Wood Smoke Flavor. Handbook of Meat, Poultry and Seafood Quality,201-210. doi:10.1002/9780470277829.ch15
Cadwallader, K.R. (1996). Potent odorants in hickory and mesquite smokes and liquid smoke extracts. Annual Meeting of the Institute of Food Technologies, New Orleans, LA. 34-6. Chambers, D., Chambers, E., Seitz, L., Sauer, D., Robinson, K., & Allison, A. (1998). Sensory
characteristics of chemical compounds potentially associated with smoky aroma in foods. Developments in Food Science Food Flavors: Formation, Analysis and Packaging Influences, Proceedings of the 9th International Flavor Conference The George
Charalambous Memorial Symposium, 187-194. doi:10.1016/s0167-4501(98)80045-9 Chrysochou, P. (2014). Drink to get drunk or stay healthy? Exploring consumers’ perceptions,
motives and preferences for light beer. Food Quality and Preference,31, 156-163. doi:10.1016/j.foodqual.2013.08.006
Clifford, M.N., Tang, S. L., & Eyo, A. A. (1980). Smoking of foods. Process Biochemistry, 15 8, 10–11, 17, 26.
27
Dekhili, S., Sirieix, L., & Cohen, E. (2011). How consumers choose olive oil: The importance of origin cues. Food Quality and Preference,22(8), 757-762.
doi:10.1016/j.foodqual.2011.06.005
Drake, M. (2007). Invited Review: Sensory Analysis of Dairy Foods. Journal of Dairy Science, 90(11), 4925-4937. doi:10.3168/jds.2007-0332
Duineveld, C., Arents, P., & King, B. M. (2000). Log-linear modelling of paired comparison data from consumer tests. Food Quality and Preference,11(1-2), 63-70. doi:10.1016/s0950-3293(99)00040-3
Fiddler, W., Wasserman, A. E., & Doerr, R. C. (1970). A "Smoke" flavor fraction of a liquid smoke solution. Journal of Agricultural and Food Chemistry,18(5), 934-936.
doi:10.1021/jf60171a045
Fujimaki, M., Kim, K., & Kurata, T. (1974). Analysis and Comparison of Flavor Constituents in Aqueous Smoke Condensates from Various Woods. Agricultural and Biological
Chemistry,38(1), 45-52. doi:10.1080/00021369.1974.10861116
Gadioli, I. L., Lívia De Lacerda De Oliveira Pineli, Rodrigues, J. D., Campos, A. B., Gerolim, I. Q., & Chiarello, M. D. (2013). Evaluation of Packing Attributes of Orange Juice on
Consumers Intention to Purchase by Conjoint Analysis and Consumer Attitudes Expectation. Journal of Sensory Studies,28(1), 57-65. doi:10.1111/joss.12023
Lebo, S. E., Gargulak, J. D., & Mcnally, T. J. (2002). Lignin. Encyclopedia of Polymer Science and Technology. doi:10.1002/0471440264.pst179
Vidal, L., Cadena, R. S., Correa, S., Ábalos, R. A., Gómez, B., Giménez, A., Varela, P., Ares, G. (2014). Assessment of Global and Individual Reproducibility of Projective Mapping with Consumers. Journal of Sensory Studies, 29(1), 74-87. doi:10.1111/joss.12083
Green, P. E., Krieger, A. M., & Wind, Y. (2004a). Thirty Years of Conjoint Analysis: Reflections and Prospects. International Series in Quantitative Marketing Marketing Research and Modeling: Progress and Prospects, 117-139. doi:10.1007/978-0-387-28692-1_6
Green, P. E., & Rao, V. R. (1971). Conjoint Measurement for Quantifying Judgmental Data. Journal of Marketing Research,8(3), 355. doi:10.2307/3149575
Green, P. E., & Srinivasan, V. (1978). Conjoint Analysis in Consumer Research: Issues and Outlook. Journal of Consumer Research,5(2), 103. doi:10.1086/208721
Green, P. E., & Srinivasan, V. (1990). Conjoint Analysis in Marketing: New Developments with Implications for Research and Practice. Journal of Marketing,54(4), 3.
doi:10.2307/1251756
28
Guillén, M. D., & Ibargoitia, M. L. (1999). Influence of the Moisture Content on the
Composition of the Liquid Smoke Produced in the Pyrolysis Process of Fagus sylvatica L. Wood. Journal of Agricultural and Food Chemistry,47(10), 4126-4136.
doi:10.1021/jf990122e
Hough, G., Wakeling, I., Mucci, A., Chambers, E., Gallardo, I. M., & Alves, L. R. (2006). Number of consumers necessary for sensory acceptability tests. Food Quality and Preference,17(6), 522-526. doi:10.1016/j.foodqual.2005.07.002
Hruza, D. E., Praag, M. V., & Heinsohn, H. (1974). Isolation and identification of the components of the tar of hickory wood smoke. Journal of Agricultural and Food Chemistry,22(1), 123-126. doi:10.1021/jf60191a010
Jaeger, S. R., Jørgensen, A. S., Aaslyng, M. D., & Bredie, W. L. (2008). Best–worst scaling: An introduction and initial comparison with monadic rating for preference elicitation with food products. Food Quality and Preference,19(6), 579-588.
doi:10.1016/j.foodqual.2008.03.002
Jaffe, T. R., Wang, H., & Chambers, E. (2017). Determination of a lexicon for the sensory flavor attributes of smoked food products. Journal of Sensory Studies,32(3).
doi:10.1111/joss.12262
Jervis, S., Ennis, J., & Drake, M. (2012). A Comparison of Adaptive Choice-Based Conjoint and Choice-Based Conjoint to Determine Key Choice Attributes of Sour Cream with Limited Sample Size. Journal of Sensory Studies,27(6), 451-462. doi:10.1111/joss.12009
Kahle, L. R., & Kennedy, P. (1988). Using The List Of Values (Lov) To Understand Consumers. Journal of Services Marketing,2(4), 49-56. doi:10.1108/eb024742
Kahle, L. R. (1983). Social Values and Social Change: Adaptation to Life in America. New York, NY: Praeger.
Kemp, S. E., Hort, J., & Hollowood, T. (2018). Descriptive Analysis in Sensory Evaluation. Hoboken, NJ: Wiley Blackwell.
Kennedy, J., & Heymann, H. (2009). Projective Mapping And Descriptive Analysis Of Milk And Dark Chocolates. Journal of Sensory Studies,24(2), 220-233. doi:10.1111/j.1745-459x.2008.00204.x
Kim, K., Kurata, T., & Fujimaki, M. (1974). Identification of Flavor Constituents in Carbonyl, Non-Carbonyl Neutral and Basic Fractions of Aqueous Smoke Condensates. Agricultural and Biological Chemistry,38(1), 53-63. doi:10.1080/00021369.1974.10861117
King, M. C., Cliff, M. A., & Hall, J. W. (1998). Comparison of Projective Mapping And Sorting Data Collection And Multivariate Methodologies For Identification Of Similarity-Of-Use Of Snack Bars. Journal of Sensory Studies,13(3), 347-358.
doi:10.1111/j.1745-459x.1998.tb00094.x
29
Lawless, L. J., Threlfall, R. T., & Meullenet, J. (2013). Using a Choice Design to Screen Nutraceutical-Rich Juices. Journal of Sensory Studies,28(2), 113-124.
doi:10.1111/joss.12027
Lee, J. A., Soutar, G. N., & Louviere, J. (2007). Measuring values using best-worst scaling: The LOV example. Psychology and Marketing,24(12), 1043-1058. doi:10.1002/mar.20197 Léon, F., Couronne, T., Marcuz, M., & Köster, E. (1999). Measuring food liking in children: A
comparison of non verbal methods. Food Quality and Preference,10(2), 93-100. doi:10.1016/s0950-3293(98)00046-9
LeVan S. (1989) Thermal Degradation. Madison, WI.
Liem, D. G., Mars, M., & Graaf, C. D. (2004). Consistency of sensory testing with 4- and 5-year-old children. Food Quality and Preference,15(6), 541-548.
doi:10.1016/j.foodqual.2003.11.006
Lusk, J. L., & Parker, N. (2009). Consumer Preferences for Amount and Type of Fat in Ground Beef. Journal of Agricultural and Applied Economics,41(01), 75-90.
doi:10.1017/s107407080000256x
Maga, J. A. (1987). The flavor chemistry of wood smoke. Food Reviews International,3(1-2), 139-183. doi:10.1080/87559128709540810
Maga, J. A. (1992). Contribution of Phenolic Compounds to Smoke Flavor. ACS Symposium Series Phenolic Compounds in Food and Their Effects on Health I, 170-179.
doi:10.1021/bk-1992-0506.ch013
Maga, J. A., & Fapojuwo, O. O. (1986). Aroma Intensities Of Various Wood Smoke
Fractions. Journal of Sensory Studies,1(1), 9-13. doi:10.1111/j.1745-459x.1986.tb00155.x Maga, J. A. (1988). Smoke in Food Processing. Boca Raton, FL: CRC Pr.
Mahanna, K., Moskowitz, H., & Lee, S. (2009). Assessing Consumer Expectations For Food Bars By Conjoint Analysis. Journal of Sensory Studies,24(6), 851-870. doi:10.1111/j.1745-459x.2009.00241.x
Mcilveen, H., & Vallely, C. (1996). The development and acceptability of a smoked processed cheese. British Food Journal,98(8), 17-23. doi:10.1108/00070709610150897
Mclean, K. G., Hanson, D. J., Jervis, S. M., & Drake, M. A. (2017). Consumer Perception of Retail Pork Bacon Attributes Using Adaptive Choice-based Conjoint Analysis and Maximum Differential Scaling. Journal of Food Science,82(11), 2659-2668. doi:10.1111/1750-3841.13934
McLeod, J. (2017). U.S. Patent No. 0290352. Washington, DC: U.S. Patent and Trademark Office.
30
Mesías, F. J., Pulido, F., Escribano, M., Gaspar, P., Pulido, Á F., Escribano, A., & Rodríguez-Ledesma, A. (2013). Evaluation of New Packaging Formats for Dry-Cured Meat Products Using Conjoint Analysis: An Application to Dry-Cured Iberian Ham. Journal of Sensory Studies,28(3), 238-247. doi:10.1111/joss.12040
Miler, K.B.M, and Sikorski, Z.E 1990. Smoking. In Seafood: Resources, Nutritional
Composition, and Preservation. (Z.E. Sdcorski, ed.) pp. 163- 180, CRC Press, Boca Raton, Florida.
Montazeri, N., Oliveira, A. C., Himelbloom, B. H., Leigh, M. B., & Crapo, C. A. (2012). Chemical characterization of commercial liquid smoke products. Food Science & Nutrition,1(1), 102-115. doi:10.1002/fsn3.9
Murray J., Delahunty C., Baxter I. (2001) Descriptive sensory analysis: past, present and future. Food Res Int 34:461–471. doi: 10.1016/S0963-9969(01)00070-9
Murray, J., Delahunty, C., & Baxter, I. (2001). Descriptive sensory analysis: Past, present and future. Food Research International,34(6), 461-471. doi:10.1016/s0963-9969(01)00070-9 Nestrud, M. A., & Lawless, H. T. (2008). Perceptual mapping of citrus juices using projective
mapping and profiling data from culinary professionals and consumers. Food Quality and Preference,19(4), 431-438. doi:10.1016/j.foodqual.2008.01.001
Nestrud, M. A., & Lawless, H. T. (2010). Perceptual Mapping Of Apples And Cheeses Using Projective Mapping And Sorting. Journal of Sensory Studies,25(3), 390-405.
doi:10.1111/j.1745-459x.2009.00266.x
Orme, B. K. (2010). Getting started with conjoint analysis: Strategies for product design and pricing research. Madison, WI: Research.
Pagès, J., & Husson, F. (2001). Inter-laboratory comparison of sensory profiles. Food Quality and Preference,12(5-7), 297-309. doi:10.1016/s0950-3293(01)00015-5
Pagès, J. (2004). Multiple factor analysis: Main features and application to sensory data. Revista Colombiana de Estadística, 27(1).
Pallu R, Etuvage et fumaison. Action du facteur tempeÂrature sur les viandes et preparations de charcuterie. In Le Charcuterie en France, Ed by Pallu, Paris, pp 107±139 (1971).
Perrin, L., & Pagès, J. (2009). Construction Of A Product Space From The Ultra-Flash Profiling Method: Application To 10 Red Wines From The Loire Valley. Journal of Sensory
Studies,24(3), 372-395. doi:10.1111/j.1745-459x.2009.00216.x
Porter, R. W., Bratzler, L. J., & Pearson, A. M. (1965). Fractionation and Study of Compounds in Wood Smoke. Journal of Food Science,30(4), 615-619.
doi:10.1111/j.1365-2621.1965.tb01812.x
Rao, VR. 2010. Conjoint analysis. Wiley international encyclopedia of marketing.
31
Risvik, E., Mcewan, J. A., Colwill, J. S., Rogers, R., & Lyon, D. H. (1994). Projective mapping: A tool for sensory analysis and consumer research. Food Quality and Preference,5(4), 263-269. doi:10.1016/0950-3293(94)90051-5
Risvik, E., Mcewan, J. A., & Rødbotten, M. (1997). Evaluation of sensory profiling and projective mapping data. Food Quality and Preference,8(1), 63-71. doi:10.1016/s0950-3293(96)00016-x
Ruiter, A. 1979 . Color of smoked fish. Food Technology (5): 54 – 63.
Sainclivier, M. (1985). Les industries alimentaires halieutiques. Bulletin scientifique et technique de l’e´cole nationale supe´rieure agronomique et du centre de recherches de Rennes (Vol. II) [in French].
Schwartz, S. H., & Bardi, A. (2001). Value Hierarchies Across Cultures. Journal of Cross-Cultural Psychology,32(3), 268-290. doi:10.1177/0022022101032003002
Shakeel-Ur-Rehman, Farkye, N., & Drake, M. (2003). The Effect of Application of Cold Natural Smoke on the Ripening of Cheddar Cheese. Journal of Dairy Science,86(6), 1910-1917. doi:10.3168/jds.s0022-0302(03)73777-1
Sikorski, Z. E. and Kołakowski, E. (2010). Smoking. In Handbook of Meat Processing, F. Toldrá (Ed.). doi:10.1002/9780813820897.ch12
Sikorski, Z. E. (1990). Seafood: Resources, nutritional composition and preservation. Boca Raton, FL: CRC Press.
Sikorski, Z. E., & Sinkiewicz, I. (2014). Principles of Smoking. Handbook of Fermented Meat and Poultry, 39-45. doi:10.1002/9781118522653.ch6
Summary of Cold-Smoking Process. (2001). Journal of Food Science,66. doi:10.1111/j.1365-2621.2001.tb15533.x
Thomson, D. M., Crocker, C., & Marketo, C. G. (2010). Linking sensory characteristics to emotions: An example using dark chocolate. Food Quality and Preference,21(8), 1117-1125. doi:10.1016/j.foodqual.2010.04.011
Thurstone, L. L. (1927). A law of comparative judgment. Psychological Review,34(4), 273-286. doi:10.1037/h0070288
Varlet, V., Prost, C., & Serot, T. (2007). Volatile aldehydes in smoked fish: Analysis methods, occurence and mechanisms of formation. Food Chemistry,105(4), 1536-1556.
doi:10.1016/j.foodchem.2007.03.041
Vidal, L., Jaeger, S. R., Antúnez, L., Giménez, A., & Ares, G. (2016). Product spaces derived from projective mapping and CATA questions: Influence of replicated assessments and increased number of study participants. Journal of Sensory Studies,31(5), 373-381. doi:10.1111/joss.12220
32
Wittkowski, R., Ruther, J., Drinda, H., & Rafiei-Taghanaki, F. (1992). Formation of Smoke Flavor Compounds by Thermal Lignin Degradation. ACS Symposium Series Flavor Precursors, 232-243. doi:10.1021/bk-1992-0490.ch018
33
FIGURES
34
TABLES
Table 1: Aroma active constituents of smokes (Terms were adapted from Cadwallader, 1996; taken from Cadwallader, 2007)
Smoke Type Compound Aroma Description
Liquid Smoke 2,3-Butanedione (diacetyl) Buttery Liquid Smoke l-Penten-3-0ne Plastic Liquid Smoke 2,3-Pentanedione Buttery Liquid Smoke 3- (Methy1thio)propanal Potato Liquid Smoke Butanoic acid Spoiled milk Liquid Smoke 3-Methylbutanoic acid Dried fruit Liquid Smoke 2-Methoxyphenol (guaiacol) Smoky
Liquid Smoke 4-Methylguaiacol Smoky, vanilla Liquid Smoke 2-Methylphenol (0-cresol) Ink, phenol Liquid Smoke 4-Ethylguaiacol Cloves, smoky Liquid Smoke 4-Methylphenol (p-cresol) Stable, fecal
Liquid Smoke Eugenol Cloves, smoky
Liquid Smoke 4-Propylguaiacol Cloves, smoky Liquid Smoke 4-Vinylguaiacol Cloves, spicy Liquid Smoke 2,6-Dimethoxyphenol (syringol) Smoky
35
CHAPTER 2:
36
Sensory Characterization of Specific Wood Smoke Aromas and their Contributions to Smoked Cheddar Cheese Flavor
R. S. Del Toro-Gipson, P. V. Rizzo, D. J. Hanson, M. A. Drake*
Dept. Food, Bioprocessing and Nutrition Sciences, Southeast Dairy Foods Research Center, North Carolina State University, Raleigh, NC 27695
*Corresponding author:
MaryAnne Drake
Box 7624, Department of Food Science North Carolina State University
Raleigh, NC 27695-7624 Phone: 9191-513-4598 Fax: 919-513-0014
37
ABSTRACT
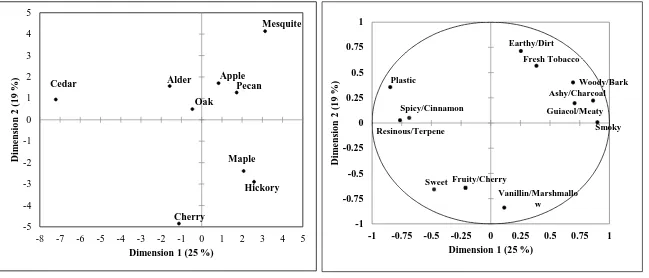
The objective of this study was to characterize the sensory properties of different wood smokes and then their application to smoked Cheddar cheese. Sniff jars of wood smokes were created by exposing filter paper to 23° C smoke (cold smoke). The nine wood smokes evaluated included: apple, alder, cedar, cherry, hickory, maple, mesquite, oak and pecan. Sensory attributes for nine wood smokes were generated by a trained panel followed by projective mapping of the different wood smoke aromas. Four distinct wood smokes (mesquite, cherry, hickory, and cedar) were selected for cold smoking of 30 d Cheddar cheeses. Cheeses were cold smoked at 23° C followed by descriptive analysis of flavor attributes using the trained panel. Nonparametric and parametric statistical analyses were applied to the collected data. Twenty-five attributes were generated to describe wood smoke aromas. The sensory descriptors for the cold smokes cited most often included: sweet aromatic, charcoal/charred, guaiacol, meaty, vanillin, and fresh tobacco. Mesquite, cherry, hickory and cedar smokes were the most distinct smokes by
projective mapping, and these smokes also imparted distinct flavors to smoked Cheddar cheeses. The mesquite smoked cheese was characterized by high smoke aroma, the cherry smoked cheese was distinguished by a campfire/marshmallow flavors, the hickory smoked cheese had high overall smoke and campfire/marshmallow flavors, and the cedar smoked cheese was strong in resinous flavors. The determination of sensory properties of different wood smokes provides insight into the differences in smoke flavor contributions to cheese. Furthermore, the
determination of the sensory properties of specific to smoked cheese will provide a platform to understand consumer perception of smoked cheeses.
38
INTRODUCTION
Smoked cheese is a growing specialty category of flavored cheese (Market Research Future®, 2019). Smoked cheeses are created by the addition of smoke flavorings to cheese milk or by natural cold smoking of curds or cheese, using a variety of woods. Food was originally smoked as a method of preservation. However, with the advent of more convenient preservation methods like refrigeration, smoked products are now desirable for their unique and characteristic smoky flavor (Chambers et al., 1998). With the increase in popularity of smoked cheese
products, there is a need to understand the aromatics associated with the origins of smoke sources, and how they affect the sensory properties of the final smoked cheese product.
There are several aspects of the smoking process that contribute smoke aromas to smoked cheese. The degradation of the components of wood compounds through smoking creates different sensory properties of smokes. The three main components of wood are
cellulose, hemicellulose, and lignin. Cellulose is a long chain glucose polymer. Hemicellulose is generally composed of a combination of five-carbon sugars including glucose, mannose, and galactose. Lignin is a phenolic based compound with many combinations of hydroxyl- and methoxy-substituted phenylpropane units (Maga, 1992). The thermal degradation of wood and wood components through combustion determine the composition of the wood smoke. The composition of wood smoke includes air, water vapor, carbon dioxide, carbon monoxide, and several hundred organic compounds in different concentrations; this is also a factor in
determining the aromatic properties of wood smokes (Sikorski and Ko, 2010).
39
intensities of varying fractions of Cherry, Chestnut, Hard Maple, White Oak, Red Oak, Apple, Hickory, and Mesquite wood smoke, and were able to conclude that fractions other than phenols also contributed to the aromatic intensity of smoke. Rehman et al. (2003) characterized the effects of the application of natural Hickory wood smoke on ripening of Cheddar cheese to determine the effects of smoking before or after ripening on cheese sensory properties. Two attributes specific to cold smoking, smoky and sulfur/skunky, were documented by the trained panel in addition to flavor attributes specific to Cheddar cheese. A study was recently conducted by Swaney-Stueve (2019) in which pulled pork was prepared with two different types of smokers and four different types of woods; the woods included were hickory, apple, oak, and mesquite. Pulled pork with hickory wood had the highest overall liking and appearance characteristics (Swaney-Stueve et al., 2019). Jaffe et al. (2017) identified a descriptive language for smoked foods and reported smoky (overall), ashy, woody, musty/dusty, musty/earthy, burnt, acrid, pungent, petroleum-like, creosote/tar, cedar, bitter, metallic, and sour as attributes applicable to smoked foods. However, the study made no mention of smoked cheese nor specific sensory properties attributed to smoked cheese products. Furthermore, there have not been any studies that have characterized the sensory properties of different wood smokes.
40
mapping has been widely applied to determine similarities and differences of food products, both with trained and untrained panelists (Neustrud and Lawless, 2008; Torri et al.,2013). Projective mapping was chosen as a method for differentiating smokes because smoke can only be
perceived orthonasally.
MATERIALS AND METHODS
Experimental Overview
Attributes for nine different wood smokes were generated using a trained panel. Following attribute generation, projective mapping was utilized to characterize differences and similarities among nine wood smokes. Subsequently, Cheddar cheeses smoked with four representative wood smokes were evaluated by a trained sensory panel. Sensory testing was conducted in compliance with the North Carolina State University (NCSU) Institutional Review Board for Human Subjects Approval.
Projective Mapping
41
USA) to 23 °C smoke for one min. The tubing attached to the handheld food smoker was inserted into the jar containing filter paper, and the lid was held slightly open so that the tubing could be inside and that smoke could clear out of the jar following exposure to filter paper. Preliminary experiments were done to determine the smoking time needed for the highest intensity of aroma. Smoking for 1 min generated the strongest smoke aroma intensity. Smoking equipment was cleaned after each usage. Following sniff jar generation, the jars were stored at room temperature for 1 h prior to sensory analysis. Jars were only used for one panel and new jars were generated for each panel session.
A trained descriptive sensory panel (n=9, 6 females, 3 males, ages 23 to 47 y) evaluated the orthonasal aroma attributes of sniff jars with each wood smoke to generate smoke aroma attributes and to conduct the projective mapping. Each panelist had more than 300 h of previous experience with descriptive analysis of foods using the Spectrum™ method (Meilgard et al., 2007). Supplementary training (approximately fifty 30 min sessions) was devoted to smoke aroma and identification of smoke aroma attributes. The smoke aroma lexicon generated by Jaffe et al. (2017) were used as a starting point, and additional attributes were added (Table 1). During the development and refinement of terms, panelists identified definitions and references for attributes. Twelve attributes were selected to characterize wood smoke aroma: ashy/charcoal, guaiacol/meaty, vanillin/marshmallow, sweet aromatic, smoky, plastic, woody/bark, fresh tobacco, resinous/terpene, fruity/cherry, spicy/cinnamon, and earthy/dirt.
42
use the identified 12 attributes to describe each wood smoke. The projective mapping exercise was replicated by each panelist in quadruplicate in separate sessions. An iPad interface was used and data was collected with a projective mapping application in Compusense Cloud (Guelph, Canada).
Smoked Cheese
Smokes for Cheddar cheese smoking were selected based on differences determined by projective mapping. These smokes included mesquite, cherry, hickory, and cedar. Cheddar cheese (ca 30 days old) was obtained from a commercial supplier (Hilmar Cheese, Hilmar CA) in duplicate 10 kg blocks from two different lots. These blocks were similar (p>0.05) in
moisture, fat, salt content and pH (Table 2). The cheese was cut into 2 cm3 cubes for smoking. The handheld food smoker (Breville) described previously was applied to cheese in a cocktail smoking box (Fortessa Tableware Solutions, LLC., Virginia, USA) to cold smoke the cheese. Preliminary experiments were conducted to determine the smoking time needed for the highest intensity of smoke aroma and flavor. Smoking cubes for 5 min generated the strongest smoke aroma and flavor intensity. Cheese cubes were placed equidistantly in the smoker box and were smoked for five min at 23°C. All cheeses were smoked in duplicate on the same day they were to be evaluated by sensory analysis. Following smoking, cheeses were placed into lidded cups 2 h prior to sensory analysis.
Descriptive Sensory Analysis
43
of Cheddar cheese flavor. Supplementary training (approximately four 30 min sessions) was devoted to smoked Cheddar cheese flavor attributes.
The Cheddar cheeses were placed into lidded 60 mL soufflé cups with random 3-digit codes. Sample preparation was conducted with overhead lights off to avoid any light oxidation of the samples. The cheeses were served at this temperature with room temperature deionized water and unsalted crackers for palate cleansing. At the beginning of each session, panelists were given a warm up sample of unsmoked Cheddar cheese. Panelists expectorated samples, and between samples, panelists rinsed with water and unsalted crackers. A 2 min rest was enforced between samples. Sample presentation was randomized to account for presentation and carryover effects. Descriptive analysis was conducted using a 0- to 15-point universal intensity scale consistent with the Spectrum™ method (Meilgaard et al., 1999; Drake and Civille, 2003) and an established cheese flavor sensory language (Drake et al. 2001, 2005) with the added smoke lexicon terms. Panelists evaluated the four cheeses in duplicate. Data was collected on paper ballots.
Statistical Analysis
44
RESULTS
Projective Mapping
Multiple Factor Analysis (MFA) explained 59% of the variability amongst the wood smokes on 3 Dimensions (Figure 1a). Dimensions 1 and 2 are displayed in Figure 1a which represented 25 and 19% of the total variance, respectively (44% total). Dimensions 1 and 3 (15% variability) are displayed in figure 2a. The supplementary variables (variables not used to
calculate the coordinates of active variables, but used for interpreting results) are used as overlay for the MFA data and can be found in Figures 1b and 2b. Dimension 1 (25%) differentiated among smokes described by the terms smoky, ashy/charcoal, guaiacol/meaty, woody/bark, spicy/cinnamon, resinous/terpene, and plastic (Figure 1a and 1b). Dimension 2 (19%) differentiated among smokes described by the terms earthy/dirt, fruity/cherry, sweet, vanillin/marshmallow. Dimension 3 (15%) was comprised of fresh tobacco aroma.
The projective map of Dimensions 1 and 2 demonstrated four groupings that described the majority of similarities and differences among the wood smoke aromas. Table 3 shows the frequency of selection of attributes for projective mapping of smokes by panelists. The attributes selected were supplementary variables that were used to characterize the similarities and
differences observed in the wood smokes. All smokes were frequently described to have
45
Apple, pecan and mesquite smokes were characterized by earthy/dirt, fresh tobacco, woody/bark, and guaiacol/meaty aromas. Maple and hickory smokes were perceived to be similar, and cherry smoke was juxtaposed near these smokes as well. The attributes used to describe these smokes included sweet, fruity/cherry, and vanillin/marshmallow. Dimension 3 was used to strengthen the interpretation of the wood smoke aromas, specifically between mesquite and maple smokes. Fresh tobacco aroma further differentiated mesquite smoke from apple and pecan, and maple smoke was further differentiated from hickory smoke by woody/bark and ashy/charcoal aromas. Descriptive Sensory Analysis