ABSTRACT
OLTMAN, AMY. Qualitative and Quantitative Research Methods to Measure Consumer Valuation and Consumer Acceptability. (Under the direction of Dr. MaryAnne Drake).
Sensory analysis is a field that aims to discover which parameters of products drive consumer liking and ultimately purchase. To investigate what consumers are willing to buy, quantitative and qualitative methods are used. The objective of this thesis was to apply quantitative and qualitative research techniques to identify key consumer attributes for tomatoes and protein beverages. Three different studies were conducted. The first study used an adaptive choice based conjoint with Kano analysis (n=1037) and focus groups (n=28) to understand consumer preferences for fresh tomatoes. Results were analyzed by multivariate analyses. The study revealed that external attributes were the main drivers of liking for fresh tomatoes and segmented groups of consumers were differentiated by preference for color, firmness, flavor and health benefits. The second study conducted descriptive analysis on 7 tomato cultivars and a consumer test (n=177) with the same cultivars. Overall liking was evaluated across three stages: appearance, slicing and consumption of tomatoes. Preference mapping was applied to descriptive analysis and consumer liking scores, and clusters were characterized based on liking during the 3 stages of consumption. Clusters were
differentiated by preference for color, flavor, ripeness and firmness. Drivers of liking during appearance evaluation were color related, drivers of liking during slicing were
juiciness/wetness and aroma and drivers of liking during consumption were
(n=432) was conducted and analyzed using multivariate analyses. The most important protein beverage attributes were protein amount, protein type, great flavor and satiety. A consumer test (n=151) was consequently conducted, investigating the effect of priming great taste or amount of protein on consumer liking of protein beverages. Two pairs of clear acidic whey protein beverages were manufactured that differed by age of protein (prime = great flavor) and amount of whey protein per serving (prime = 20 g protein per serving). Consumers tasted beverages either primed or unprimed on two separate occasions. A 2-way analysis of
Qualitative and Quantitative Research Methods to Measure Consumer Valuation and Consumer Acceptability
by
Amy Elizabeth Oltman
A thesis submitted to the Graduate Faculty of North Carolina State University
in partial fulfillment of the requirements for the degree of
Master of Science
Food Science
Raleigh, North Carolina 2015
APPROVED BY:
_______________________________ ______________________________ Dr. MaryAnne Drake Dr. E. Allen Foegeding
BIOGRAPHY
ACKNOWLEDGMENTS
The author would like to thank her loving parents, Jack and Sue Oltman for their undying support, guidance and happiness and love given throughout her life. Thank you to my sister, Kristi for all the laughter and love. Thank you to Jonathan for being there for me through it all, for loving me and supporting me. Thank you to TAGDOM.
The author also wishes to thank Dr. Robert Shewfelt for his excitement that drove her to pursue a career in food, Dr. MaryAnne Drake for providing an environment to learn and a nest to flap in, and committee members Dr. Foegeding and Dr. Sanders for giving advice and helping her grow as a scientist.
TABLE OF CONTENTS
LIST OF TABLES . . . vii
LIST OF FIGURES . . . viii
CHAPTER 1. Literature Review . . . 1
1.1 Qualitative and Quantitative Research Methods . . . 2
1.2 Stated Preferences . . . 3
1.3 Auctions . . . 5
1.4 Conjoint Analysis . . . 9
1.5 Multi Attribute Attitude Model . . . 12
1.6 Focus Groups . . . 13
1.7 Means End Chain and Laddering . . . 16
1.8 Ethnography . . . 17
1.9 Protein Beverages . . . 19
References . . . 24
CHAPTER 2. Consumer Attitudes and Preferences for Fresh Market Tomato Attributes . . . 37
Abstract . . . 38
Introduction . . . 39
Materials and Methods . . . 41
Results . . . 44
Discussion . . . 49
Acknowledgements . . . 54
References . . . 55
CHAPTER 3. Preference Mapping of Fresh Tomatoes Across Three Stages of Consumption . . . 65
Abstract . . . 66
Introduction . . . 67
Materials and Methods . . . 69
Results . . . 72
Discussion . . . 75
Conclusion . . . 78
Acknowledgements . . . 79
References . . . 80
CHAPTER 4. Identifying Key Consumer Attributes for Protein Beverages . . 101
Abstract . . . 102
Introduction . . . 103
Materials and Methods . . . 105
Results . . . 112
Discussion . . . 114
Conclusion . . . 119
Acknowledgements . . . 120
LIST OF TABLES
CHAPTER 1. Literature Review. . . 1 CHAPTER 2. Consumer Attitudes and Preferences for Fresh Market Tomato
Attributes . . . 37
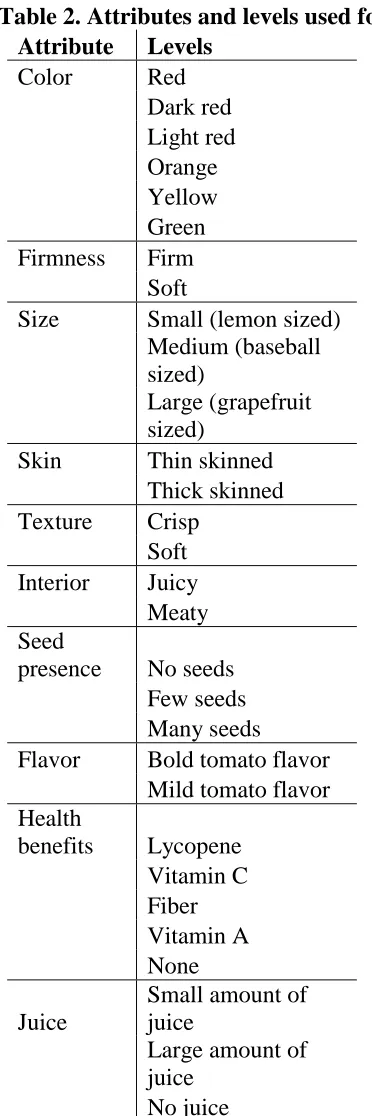
Table 1: Moderator’s guide for fresh tomatoes . . . 59 Table 2: Attributes and levels used for conjoint analysis . . . . 60 Table 3: Importance scores for attributes evaluated in conjoint survey (n=1037) . 61 Table 4: Average utility scores for attributes evaluated in the conjoint survey (n=1037)62 Table 5: Total population and clustered Kano results . . . . 64 CHAPTER 3. Preference Mapping of Fresh Tomatoes Across Three Stages of
Consumption . . . 65
LIST OF FIGURES
CHAPTER 1. Literature Review. . . 1 CHAPTER 2. Consumer Attitudes and Preferences for Fresh Market Tomato
Attributes . . . 37
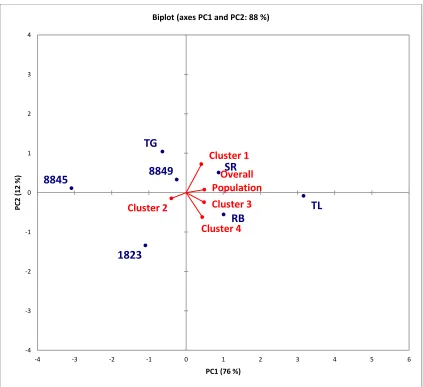
Figure1: Principal component biplot of consumer clusters with respect to utility scores 63 CHAPTER 3. Preference Mapping of Fresh Tomatoes Across Three Stages of
Consumption . . . 65
CHAPTER 1
Literature Review
A.E. Oltman
Quantitative and Qualitative Research Methods
When a new product is introduced to the market, millions of dollars and the time and efforts of many are at stake. To ensure new products have the best chance of becoming profitable in an often times saturated market, research techniques involving consumers are implemented to gauge consumer valuation and willingness to pay for these goods. Such techniques allow us to determine how much to charge for a good, the part-worth of attributes that make up the good and how consumers value different goods (with varying attributes) against each other. These research techniques can be conducted with actual prototypes or product concepts.
To characterize consumer willingness to pay (WTP) for an item, methods that are widely recognized include stated preferences, consisting of contingent valuation and choice experiments, and auctions (Tempesta and Vecchiato, 2012). Observing what an individual has purchased in the past does not reveal how much more they would have been willing to pay- it only establishes that the consumer’s price limit is equal to or greater than the market price (Noussair et al., 2004a). In addition to characterizing willingness to pay, other methods such as conjoint analysis and the multi attribute attitude model (MAAM) allow the researcher to break down a product to see how consumers value or like individual attributes that make up a whole product.
because it investigates how valuation can be predicted in a larger market. Focus groups, means end chains, laddering and ethnography are all common qualitative research techniques that may be used to gain understanding of consumer valuation. This review will examine quantitative and qualitative research methods and how they may be used to understand how consumers make decisions.
Stated Preferences
decomposed attributes of a good (Tempesta and Vecchiato, 2012). This allows the researcher to vary which attributes are present, making a choice set of comparable goods. Value can then be assigned to attributes to see which ones affect overall liking or purchase intent of the whole good the most (Adamowicz et al., 1998). For example, in a study that gauged
willingness to pay for local milk, the choice experiment contained the attributes price, production area, product origin and type of rearing to differentiate the milks (Tempesta and Vecchiato, 2012). Choice evaluation has also been used with caribou management
(Adamowicz et al., 1998), health care evaluation (Norman et al., 2013), women’s preferences for miscarriage management (Petrou and McIntosh, 2009) and livestock purchase (Vestal et al., 2013).
A popular experimental practice within stated preference methods to elicit WTP is to have subjects or bidders evaluate a product and record their WTP for that product; THEN have them state WTP for the same product after having been given information about the product. This has been conducted with fiber content in french bread (Ginon et al., 2009), grass fed versus conventional beef (Xue et al., 2010) and a nutraceutical rich juice (Lawless et al., 2012). Providing additional information to consumers impacts their WTP (Saulais and Ruffieux, 2012). In a study on WTP of organic versus conventional beef, providing
auctions were more relevant to obtain valid information on value of the product (or brand) when external information was presented.
Auctions
Unlike stated preferences, the use of experimental auctions has been used extensively to determine willingness to pay for food products (Lusk and Shogren, 2007). Often, the process is used to value a certain attribute of a product such as pesticide treatment of apples (Roosen et al., 1998), sensory attributes of tangerines (Bi et al., 2011) and modified kiwi fruits (Jaeger and Harker, 2005). The goal of an auction is to provide a situation that is as close to a real market setting as possible. In a hypothetical situation, the participant will not experience an adverse effect when they state their willingness to pay- in an auction, they will.
choosing them against others (Combris et al. 2009). By holding participants accountable for their actions (using real money), it creates higher reliability and validity of stated WTP data (Jaeger et al., 2004).
Auctions reveal an individual’s price limit directly. Noussair et al. (2004b) characterized demand revealing mechanisms as follows: “Economists usually advocate auctions that are demand revealing, that is, where the particular rules in effect imply that the individual bidders maximize expected payoffs in the auction setting if they accurately reveal preferences.” Three auction demand revealing mechanisms are the Vickrey auction (Vickrey, 1961), random nth price auction (Shogren et al., 2001) and the Becker-DeGroot-Marschak (BDM) mechanism (Becker et al., 1964).
In a Becker-DeGroot-Marschak (BDM) auction, subjects submit sealed bids for an item. After bids are submitted, a sale price is randomly drawn from a distribution of prices ranging from zero to a price greater than the expected maximum bid. Any subject who bids higher than the randomly drawn sale price receives the item and pays the sale price, not their actual bid. In this case as well, off margin (low) bidders stay involved because the sale price is randomly drawn. The BDM auction is unique in that it is the only mechanism that does not require a group of participants- individuals can be recruited and submit their own bids
(Jaeger et al., 2004). Lusk et al. (2001) reported this fact makes the BDM mechanism applicable for eliciting values in field settings. Because a group present is not required, a BDM auction can have a greater number of participants than the Vickrey or nth price auction (Shogren et al., 2001).
In the Vickrey, nth price and BDM auctions, strategic bidding is eliminated because subjects do not pay their submitted bid (Coursey et al., 1987). Whether their price is low or high, all bidders are given the same incentive and comparison between bidders is avoided. Bid strategy is independent of other bidders. Bidding less than one’s true value reduces the opportunity to win the auction. Bidding more than one’s true value leads to winning, but at a price that is higher than one’s true value (Shogren et al., 1994). Literature is inconclusive as to which auction is more accurate. Rozan et al. (2004) reported that the BDM method can lead to significantly higher bids than the Vickrey auction; Noussair et al. (2004a) and
In the case of a series of auctions, both Vickrey and BDM models have an initial bias to underbid in order to test the market (Noussair et al., 2004a). However, as subsequent auctions are run, the “wealth effect” is seen too- the tendency of buyers to place lower bids on the next good being sold because they have become satiated. Previous auction studies show that market price lowers with each successive auction (Umberger and Feuz, 2004). However, it was noted by Knez et al. (1985) that “Most (but not all) experimental markets show some learning effects over time with equilibrium behavior quite different from startup behavior.” Other studies have agreed that multiple trials are better to allow a participant’s true value to be revealed (Coppinger et al.,1980; Cox et al.,1982). In some auction series, such as Lawless et al. (2012), only one is binding. This technique could help to ensure that satiation does not occur and that participants do not become concerned about rationing their money and thus changing bidding behavior throughout the series of auctions. It has been proposed by Roosen et al. (1998) that participants psychologically treat each auction in a series as binding even though they are aware that one is binding. This theory supports the validity of WTP values in each trial; not just the one with real monetary involvement. It has also been reported that WTP estimated in auctions for new goods can be higher than what consumers would be willing to pay realistically (Shogren et al., 2000). Furthermore, consumers are more concerned about the price of a new product as compared to what is currently available than they are with the value of the new product itself (Umberger and Feuz, 2004).
choose a preferred good. Although the market setting could never be experimentally
recreated, the auction mechanism’s goal is to be as close to a real market setting as possible while manipulating what consumers (bidders) are presented with. Alfnes and Rickertsen (2003) argued that bidding on all alternatives simultaneously was efficient in determining WTP differences- simultaneous multiple good presentation was the most realistic reflection of a market setting. Zero bidding is another bias exhibited in auction settings where
participants bid low or zero to items being sold or where they see that they have a low probability of winning. Three theories for zero bidding are as follows: the product was of no value to the bidder; the bidder has already purchased their preferred product and subsequent purchases were of no value and the bidder concentrated their bid on the item worth most to them at the expense of other items (Noussair et al., 2004b).
Auctions have been used in food research for willingness to pay for brand name candy bars, irradiated pork (Shogren et al., 2000), country of origin labelling (Chern et al., 2013; Dickinson and Baily 2005), food safety claims (Hayes et al., 1995), bread with a functional ingredient (Hellyer et al., 2012), fish from sustainable fisheries (Uchida et al., 2014), U.S. beef (Alfnes and Rickertsen, 2003) and improved animal welfare products (Heid and Hamm, 2013; Napolitano et al., 2008).
Conjoint analysis
combinations of levels of attributes (Green and Srinivasan, 1978). There are four main conjoint types: full profile conjoint analysis, adaptive conjoint analysis (ACA), choice based conjoint (CBC) and compositional method, which is also referred to as adaptive choice based conjoint (ACBC) (Rao 2010). Conjoint analyses require a large number of respondents- n>500 (Orme 2010). In a full profile analysis, all possible combinations of attributes are presented, which carries the disadvantage of taking longer to complete than other methods. In a study that used full profile analysis to evaluate consumer response for healthy soup, there were 36 attributes that consumers were presented with 2-4 at a time; evaluating a total of 60 combinations (Krieger et al., 2003). ACA was developed to more time effectively handle a large number of attributes by having the respondent rank levels within each attribute based on preference and then give an importance value to each attribute (Orme 2010; Rao 2010). In an adaptive choice survey soliciting patients’ preference for vaccination options, the format was used to gather 4-step price information once participants indicated an original selection (Norman et al., 2014). ACA cannot measure attribute interactions (Orme, 2010). Unlike ACA, CBC can measure interactions between attributes (Orme, 2010).CBC analysis is more representative of a real market situation by presenting respondents with questions that reflect how they would make a choice in a real setting (Orme, 2010; Rao, 2010). It has been
randomly generated levels within attributes (Jervis et al., 2012b). In another CBC study estimating consumer perception of irradiated fruit, consumers evaluated random product generation of 3 attributes with 2 levels each (Deliza et al., 2010). CBC is the most popular conjoint method used today (Jervis et al., 2012a). Other CBC studies involving sensory analysis include consumer evaluation sour cream (Jervis et al., 2012a), chocolate milk (Melo et al., 2010) and wine quality (Tempesta et al., 2010).
In addition to these three conjoint methods, a new hybrid of CBC and ACA takes the best aspects of each and combines them to produce the adaptive choice based conjoint (ACBC). Given the format of this approach, respondents are more engaged and may give responses closer to actual market-setting behavior (Jervis et al., 2012). In an ACBC survey, respondents first consider different product concepts and then choose products based on their responses of the first section. Each respondent’s survey is tailored to the preferences they indicated in their responses. In a third part of the survey that more closely resembles CBC, respondents choose a preferred product in a series of product concepts (Jervis et al., 2012). The advantages of using an ACBC survey are that the individual level responses are more accurate than CBC (Toubia et al., 2004; Houser et al., 2009; Yu et al.; 2011), provide better estimates of real market setting decisions (Cunningham et al., 2010) and are more accurate than CBC at measuring consumer responses when price is an attribute (Chapman et al., 2009; Gensler et al., 2012). Additionally, ACBC may require fewer responses than CBC to obtain similar results (Orme, 2010; Jervis et al., 2012).
irradiated fruit (Deliza et al., 2010), tomatoes (Oltman et al., 2014), asparagus (Behe, 2006) and vegetable products (MacKenzie and Spiller, 1996); wine (Gil and Sánchez 1997) and beer (Cerjak et al., 2010).
Multi Attribute Attitude Model
Focus groups
A focus group is defined by Morgan (1998) as a research technique that collects data through group interaction. The purpose of a focus group is to provide qualitative information about a preconceived topic and to gain insight into consumer behavior regarding that topic (Bellenger et al., 1979). Focus groups are distinguished from other group interactions because the group moderator directs discussion. To analyze, focus groups are usually recorded, transcribed and content is evaluated (Gross et al., 2014; Hendricks et al., 2009; Pope et al., 2000). A focus group is often used when developing new products; specifically, to gauge consumers’ reaction and acceptance of new product concepts, new advertising messages and packaging (David, 2007). Using the focus group technique allows the product to be positioned and marketed in a way that is attractive to the target audience. A focus group can also be used to learn about consumer habits, expectations and product usage (David 2007). According to Morgan (1998), focus groups have three strengths: (i) exploration and discovery- to find out as much as possible about people, groups or a specific topic, (ii) context and depth- the process through which thoughts and experiences are brought to consciousness and (iii) interpretation- offering an explanation for as to why current
Morgan (1998) also describes four major areas where focus groups are best suited for: academic research, product marketing, evaluation research and quality improvement. In conjunction with the four stages of unfolding a focus group (problem identification, planning, implementation and assessment), product marketing may be sequentially presented as such: generation of a new product idea, developing the new product, monitoring customer response and refining the product or marketing stance. For quality improvement, the four stages would follow: identifying opportunity for change, planning intervention, implementing intervention and assessment redesign (Morgan 1998). In conjunction, these two paths provide a “map” to creating a new product or undiscovered niche within the market.
The number of focus groups to be held on the given topic is variable. By using multiple groups, different discussions may take place and different attitudes may be
generated. However, when data generated becomes redundant, a condition of qualitative data gathering is reached, termed ‘saturation’. When this happens, additional focus groups are unnecessary (Morrison et al., 2011). For qualitative data collection, 2-4 focus groups are utilized most of the time and 2 groups are recommended. The number of participants in a focus group varies among researchers, between 8-10 individuals (David, 2007), 3-8
individuals (Stewart et al., 1994), 8-12 (Chalofsky 1999) and 6-8 (Casey and Krueger, 2000). Krueger and Casey (2009) have reported that smaller focus groups (3-6 participants) are gaining popularity because participants may feel more comfortable sharing views in a smaller group.
consumption of protein-rich foods in older adults (Best et al., 2013), consumer awareness of organic foods (Zepeda et al., 2006) and in conjunction with conjoint analysis to explore consumer attitudes of ginseng food products (Chung et al., 2011). By using focus groups to first explore consumer views on a product, meaningful conjoint attributes and levels can be generated based on the findings of focus groups.
Means end chain and Laddering
Means-end chain (MEC) method is another qualitative research technique meant to uncover consumer emotions and values that drive choice. Three concepts define MEC: product attributes (A), consequences (C) and value (V) (Lin, 2011). The hypothesis of the MEC is that product attributes are means for consumers to obtain their desired values through the consequences that those attributes bring (Gutman, 1982). Laddering is an in-depth one-on-one interview used to understand how consumers translate product attributes into meaningful values, following the MEC concepts A, C and V. The laddering interview
The HVM is favored from other methods because it represents linkages across levels of abstraction (Lin, 2011). Linkages between elements on the HVM provide understanding of the drivers of product choice and help marketers determine how to promote the product (Audenaert and Steenkamp, 1997). A cutoff level must be predetermined in order to separate important data from non-important on the HVM. This level is defined as the threshold
number of times a link (attributes, consequences and values) is present before it can be included as a connection on the HVM (Leppard et al., 2004). If the frequency of A-C-V linkages is greater than the cutoff level, the linkage will be considered important enough to include on the HVM. The frequency at which a connection is termed “important” is of high importance to generating the HVM (Lin, 2011). Previous research has proposed multiple ways for determining the cutoff value (Pieters et al., 1995) which may depend on sample size and the depth of the ladder linkages (Leppard et al., 2004). A cutoff value too high will show few linkages to interpret but if the cutoff is too low, the map will become complicated and confusing, making linkages difficult to elucidate (Leppard et al., 2004). Means end chain analysis and laddering has been used extensively regarding the food industry with studies including fish consumption (Valette-Florence et al., 2000), meal choice (Costa et al., 2007), steak preference (Grunert, 1997) and yogurt (Boecker et al., 2008).
Ethnography
anthropology and sociology, and studies small groups or individuals in their own cultural environment, where the researcher becomes immersed in the subject’s surroundings (Singer, 2009). By studying individuals carefully instead of trying to gain information from a much larger group, ethnography allows the researcher to probe each person’s behavior to
Protein Beverages
Research techniques involving consumers, as previously described, are helpful to understand how and why consumers make purchase decisions. In many methods, the product is broken down into attributes, allowing the researcher to determine the importance of
individual features. However, when consumers are faced with a new product, or one that cannot be evaluated before purchase, they must use extrinsic cues to infer quality (Speed, 1998). Protein beverages are one such product. Taste is an important factor that is not readily determined at the time of purchase. In functional beverages (protein beverages), consumers will not like even a highly functional beverage if it does not deliver great flavor (Gruenwald and Paquin, 2009). The beverage industry is heavily influenced by both marketing and taste (Fuhrman, 2011). Since consumers cannot directly evaluate “great taste” intrinsically in a market setting, they must rely on extrinsic cues (ex. marketing claim) to determine whether the claim of great taste will cause them to purchase the product.
Previous research has aimed to discern the value of extrinsic product characteristics such as the presence of GMOs (Lusk and Rozan, 2005), organic production (Napolitano et al., 2010) and food safety processes such as irradiation (Fox et al., 2002). Lusk and Rozan (2005) showed that American consumers were willing to pay more for a genetically
more when given information about how irradiation would make a safer sandwich (Fox et al., 2002).
Providing information about a protein beverage having great flavor or a desired amount of protein may indicate a tradeoff to some consumers. For example, altering the nutritional quality of a food product may imply for some consumers that the processing mode has changed. If these qualities are conflicting to the consumer, they will be forced to make a tradeoff between processing and nutrition (Saulais and Ruffieux, 2012). In the case of protein beverages, functional ingredients often have a negative effect on flavor. Off flavors are associated with protein beverages (Childs et al., 2007; Wright et al., 2009; Evans et al., 2010). Indicating to consumers that a protein beverage tastes great or has a high amount of protein might spur some consumers to decide whether they would like a high protein beverage or one that tastes better with less protein if they believe the two characteristics cannot co-exist in their preferred drink.
The amount of protein required to be considered a protein beverage has not been defined and there is a wide range of protein amounts. Commercial protein beverages contain 5-40 g protein per serving. Functional foods have been loosely defined as providing
Although desired characteristics of protein beverages are scantly reported in literature, high protein foods are growing in popularity (Gerdes 2012). Current and past research has focused on protein sources, flavors, properties of ingredients and processing. Whey proteins have widespread use in protein beverages because of high-quality, readily available proteins and solubility over a wide range of pH (Pelegrine and Gasparetto 2005, Fachin and Viotto, 2005). The two most common forms of whey protein as a functional ingredient are whey protein concentrate and whey protein isolate, which contain 34-80% and 85-90% protein respectively (Smithers 2008). Solubility of whey protein increases as pH decreases (Pelegrine and Gasparetto 2005). Whey proteins are soluble over a wide pH range but they have improved clarity and heat stability at low pH because their isoelectric point is at pH 4.5 (Pelegrine and Gasparetto 2005). For beverages that are clear and low pH, fruit flavors can be used (Beecher et al., 2008). Whey proteins are typically spray dried to
concentrate protein and extend shelf life. However, whey source, processing and addition of instantizing agents affect solubility and sensory characteristics (Wright et al., 2009).
Although milk and soy proteins can be used in mid to higher pH beverages, only whey proteins can be used in protein beverage formulations at low pH (Childs and Drake, 2010).
processing (Fox et al., 2013; Kang et al., 2012; Campbell et al., 2012; Croissant et al., 2009; Park et al., 2014; Whitson et al., 2011).
REFERENCES
Adamowicz W, Boxall P, Williams M. and Louviere J. 1998. Stated preference approaches for measuring passive use values: choice experiments and contingent valuation. Am J Ag Econ 80: 64-75.
Alfnes F, and Rickertsen K. 2003. European consumers' willingness to pay for US beef in experimental auction markets. Am J Ag Econ: 85: 396-405.
Arnould EJ, and Wallendorf M. 1994. Market-oriented ethnography: interpretation building and marketing strategy formulation. J Marketing Research 31: 484-504.
Audenaert A, and Steenkamp JBE. 1997. Means-End Chain Theory and Laddering in Agricultural Marketing Research. In Agricultural marketing and consumer behavior in a changing world. Springer US. 217-230.
Bass FM, and Talarzyk WW. 1972. An attitude model for the study of brand preference. J Marketing Research 9: 93-96.
Bateman IJ. 1996. Household willingness to pay and farmers' willingness to accept compensation for establishing a recreational woodland. J Environmental Planning and Management 39: 21-44.
Beecher JW, Drake MA, Luck PJ, and Foegeding EA. 2008. Factors regulating astringency of whey protein beverages. J Dairy Sci 91: 2553-2560.
Behe BK. 2006. Conjoint analysis reveals consumers prefer long, thin asparagus spears. HortScience 41: 1259-1262.
Bellenger DN, Bernhardt KL and Godstucker JL. 1979. Qualitative research techniques: Focus group interviews. In Focus Group Interviews: A Reader (J.B. Higginbotham and K.K. Cox, eds.) American Marketing Association, Chicago, IL.
Berkwits M, and Inui TS. 1998. Making use of qualitative research techniques. J General Internal Medicine 13: 195-199.
Best RL, and Appleton KM. 2013. The Consumption of Protein-Rich Foods in Older Adults: An Exploratory Focus Group Study. J Nutrition Education and Behavior 45: 751-755.
Bi X, House L, Gao Z, and Gmitter F. 2011. Sensory Evaluation and Experimental Auctions: Measuring Willingness to Pay for Specific Sensory Attributes. Am J Ag Econ
Blumenschein K, Johannesson M, Blomquist GC, Liljas B, and O'Conor RM. 1998. Experimental results on expressed certainty and hypothetical bias in contingent valuation. Southern Economic Journal 65: 169-177.
Boecker A, Hartl J, and Nocella G. 2008. How different are GM food accepters and rejecters really? A means-end chains application to yogurt in Germany. Food Qual and Pref 19: 383-394.
Boje DM, and Murnighan JK. 1982. Group confidence pressures in iterative decisions. Management Science 28: 1187-1196.
Campbell RE, Miracle RE, Gerard PD, and Drake MA. 2011a. Effects of starter culture and storage on the flavor of liquid whey. J Food Sci 76: 354-361.
Campbell RE, Miracle RE, and Drake MA. 2011b. The effect of starter culture and annatto on the flavor and functionality of whey protein concentrate. J Dairy Sci 94: 1185-1193. Campbell RE, Kang EJ, Bastian E, and Drake MA. 2012. The use of lactoperoxidase for the bleaching of fluid whey. J Dairy Sci 95: 2882-2890.
Carson RT, Flores NE, and Meade NF. 2001. Contingent valuation: controversies and evidence. Environmental and Resource Economics 19: 173-210.
Carson RT, Louviere JJ. 2011. A common nomenclature for stated preference elicitation approaches. Environmental and Resource Economics 49: 539-559.
Carunchia ME, Croissant AE, and Drake MA. 2005. Characterization of dried whey protein concentrate and isolate flavor. J Dairy Sci 88: 3826-3839.
Cerjak M, Haas R, and Kovacic D. 2010. Brand familiarity and tasting in conjoint analysis: An experimental study with Croatian beer consumers. British Food J 112: 561-579.
Chalofsky N. 1999. How to Conduct Focus Groups: Business Skills. American Society for Training and Development, Alexandria, VA.
Chang JB, Lusk JL, and Norwood FB. 2009. How closely do hypothetical surveys and laboratory experiments predict field behavior? Am J Ag Econ 91: 518-534.
Cheng HW, Clarke AD, and Heymann H. 1990. Influence of selected marketing factors on consumer response to restructured beef steaks: a conjoint analysis. J Sensory Studies 4: 165-178.
Chern WS, Hong JP, and Liu K. E. 2013. Comparison of the Vickrey Second-Price and Random nth-Price Auctions for Analyzing Country of Origin Labeling in Taiwan. Academia Econ Papers 41: 215-254.
Cherry E, Ellis C, and DeSoucey M. 2010. Food for Thought, Thought for Food: Consumption, Identity, and Ethnography. Journal of Contemporary Ethnography.
http://jce.sagepub.com/content/early/2010/08/23/0891241610379122 (accessed March 27 2013)
Childs J, Yates MD, and Drake MA. 2007. Sensory properties of meal replacement bars and beverages made from whey and soy proteins. J food sci. 72: 425-S434.
Childs JL, Thompson JL, Lillard JS, Berry TK, and Drake M. 2008. Consumer perception of whey and soy protein in meal replacement products. J Sensory Studies 23: 320-339.
Childs JL, and Drake M. 2010. Consumer perception of astringency in clear acidic whey protein beverages. J food sci. 75: 513-S521.
Chung HS, Hong H, Kim K, Cho CW, Moskowitz HR, and LEE SY. 2011. Consumer attitudes and expectations of ginseng food products assessed by focus groups and conjoint analysis. J Sensory Studies 26: 346-357.
Combris P, Bazoche P, Giraud-Héraud E, and Issanchou S. 2009. Food choices: What do we learn from combining sensory and economic experiments? Food Quality and Pref 20: 550-557.
Coppinger VM, Smith VL, and Titus JA. 1980. Incentives and behavior in English, Dutch and sealed‐bid auctions. Economic Inquiry 18: 1-22.
Costa AIDA, Schoolmeester D, Dekker M, and Jongen WM. 2007. To cook or not to cook: a means-end study of motives for choice of meal solutions. Food Qual and Pref 18: 77-88.
Cox JC, Roberson B, and Smith VL. 1982. Theory and behavior of single object auctions. Research in Experimental Econ 2: 1-43.
Cummings RG, Harrison GW, and Rutström EE. 1995. Homegrown values and hypothetical surveys: Is the dichotomous choice approach incentive-compatible? The American Economic Review 85: 260-266.
Cunningham CE, Deal K. and Chen Y. 2010. Adaptive choice-based conjoint analysis: A new patient-centered approach to the assessment of health service preferences. Patient 3: 257–273.
David I. 2007. Using focus group method in consumer behavior research. Cognitie, Creier, Comportament/Cognition, Brain, Behavior 11: 461-474.
Deliza R, Rosenthal A, Hedderley D, and Jaeger SR. 2010. Consumer perception of
irradiated fruit: a case study using choice‐based conjoint analysis. J Sensory Studies 25: 184-200.
Deslandes SF, Mendes CHF, Pires TDO, and Campos DDS. 2010. Use of the Nominal Group Technique and the Delphi Method to draw up evaluation indicators for strategies to deal with violence against children and adolescents in Brazil. Revista Brasileira de Saúde Materno Infantil 10: 29-37.
Dickinson DL, and Bailey D. 2005. Experimental Evidence on Willingness to Pay for Red Meat Traceability. Journal of Agricultural and Applied Economics 37: 537-548.
Drake MA, Karagul‐Yuceer Y, Cadwallader KR, Civille GV, and Tong PS. 2003. Determination of the sensory attributes of dried milk powders and dairy ingredients. J Sensory Studies 18: 199-216.
Ekionea JPB, and Fillion G. 2011. Knowledge management capabilities consensus: evidence from a delphi study. Academy of Information & Management Sciences J 14: 25-51.
Elliott R, and Jankel-Elliott N. 2003. Using ethnography in strategic consumer research. Qualitative Market Research 6: 215-223.
Evans J, Zulewska J, Newbold M, Drake MA, and Barbano DM. 2010. Comparison of composition and sensory properties of 80% whey protein and milk serum protein concentrates. J Dairy Sci 93: 1824-1843.
Fachin L, and Viotto WH. 2005. Effect of pH and heat treatment of cheese whey on
Fischer GW. 1981. When oracles fail—A comparison of four procedures for aggregating subjective probability forecasts. Organizational Behavior and Human Performance 28: 96-110.
Fishbein M. 1963. An investigation of the relationship between beliefs about an object and the attitude toward that object. Human relations 16:233.
Fishbein M. 1976. A behavior theory approach to the relations between beliefs about an object and the attitude toward the object. In Mathematical Models in Marketing p. 87-88. Springer Berlin Heidelberg.
Fox JA, Hayes DJ, and Shogren JF. 2002. Consumer preferences for food irradiation: How favorable and unfavorable descriptions affect preferences for irradiated pork in experimental auctions. Journal of Risk and Uncertaintyn24: 75-95.
Fox AJ, Smith TJ, Gerard PD, and Drake MA. 2013. The Influence of Bleaching Agent and Temperature on Bleaching Efficacy and Volatile Components of Fluid Whey and Whey Retentate. J Food Sci 78: 1535-1542.
Fuhrman E. 2011. Whey protein builds on success. Beverage Industry 102: 62.
Garrod GD. 1996. Estimating the Benefits of Environmental Enhancement: A case study of the River Darent. J Environmental Planning and Management 39: 189-204.
Gensler S, Hinzo O, Skiera B, and Theysohn S. 2012. Willingness-to-pay estimation with choice-based conjoint analysis: Addressing extreme response behavior with individually adapted designs. Eur. J. Oper. Res. 219: 368–378
Gerdes S. 2012. Consumers have a thirst for protein beverages. Dairy Foods 113: 22.
Gil JM, and Sánchez M. 1997. Consumer preferences for wine attributes: a conjoint approach. British Food J 99: 3-11.
Ginon E, Lohéac Y, Martin C, Combris P, and Issanchou S. 2009. Effect of fibre information on consumer willingness to pay for French baguettes. Food Qual and Pref 20: 343-352.
Graefe A, and Armstrong JS. 2011. Comparing face-to-face meetings, nominal groups, Delphi and prediction markets on an estimation task. International J of Forecasting 27: 183-195.
Gross C, Hubbling A, Reilly-Spong M, and Kreitzer MJ. 2014. Mindfulness Training for People with Chronic Insomnia: Focus Group Results. J Alternative and Complementary Medicine 20: 56-57.
Gruenwald J, and Paquin P. 2009. Fortification of beverages with products other than vitamins and minerals. Functional and speciality beverage technology 92-106. Elsevier. Grunert KG. 1997. What's in a steak? A cross-cultural study on the quality perception of beef. Food Qual and Pref 8: 157-174.
Gutman J. 1982. A means-end chain model based on consumer categorization processes. J Marketing 46: 60-72.
Hanley N, MacMillan D, Wright RE, Bullock C, Simpson I, Parsisson D, and Crabtree B. 1998. Contingent valuation versus choice experiments: estimating the benefits of
environmentally sensitive areas in Scotland. J Ag Econ 49: 1-15.
Hayes DJ, Shogren JF, Shin SY, and Kliebenstein JB. 1995. Valuing food safety in experimental auction markets. American Journal of Agricultural Economics 77: 40-53. Heid A, and Hamm U. 2013. Animal welfare versus food quality: Factors influencing organic consumers' preferences for alternatives to piglet castration without anesthesia. Meat science 95: 203-211.
Hellyer NE, Fraser I, and Haddock-Fraser J. 2012. Food choice, health information and functional ingredients: An experimental auction employing bread. Food Policy 37: 232-245. Hendricks PS, Wood SB, and Hall SM. 2009. Smokers’ expectancies for abstinence:
Preliminary results from focus groups. Psychology of Addictive Behaviors, 23: 380. Henry CJ. 2010. Functional Foods. Euro J Clinical Nutrition. 64: 657-659.
Ishak S, Zainun SI, Shohaimi S, and Kandiah M. 2013. Assessing the children's views on foods and consumption of selected food groups: outcome from focus group approach. Nutrition research and practice 7: 132-138.
Jaeger SR, and Harker FR. 2005. Consumer evaluation of novel kiwifruit: willingness‐to‐ pay. J Sci Food and Ag 85: 2519-2526.
Jaeger SR, Lusk JL, House LO, Valli C, Moore M, Morrow B, and Traill WB. 2004. The use of non-hypothetical experimental markets for measuring the acceptance of genetically
James DL, Durand RM, and Dreves RA. 1976. Use of a multi-attribute attitude model in a store image study. J of Retailing 52: 23-32.
Jervis SM, Ennis JM, and Drake MA. 2012a. A Comparison of Adaptive Choice‐Based Conjoint and Choice‐Based Conjoint to Determine Key Choice Attributes of Sour Cream with Limited Sample Size. J Sensory Studies 27: 451-462.
Jervis SM, Lopetcharat K, and Drake MA. 2012b. Application of ethnography and conjoint analysis to determine key consumer attributes for latte‐style coffee beverages. J Sensory Studies 27: 48-58.
Kang EJ, Smith TJ, and Drake MA. 2012. Alternative bleaching methods for Cheddar cheese whey. J Food Sci 77: 818-823.
Kleine RE, Kleine SS, and Brunswick GJ. 2009. Transformational consumption choices: building an understanding by integrating social identity and multi‐attribute attitude theories. J Consumer Behaviour: 8: 54-70.
Knez P, Smith VL, and Williams AW. 1985. Individual rationality, market rationality, and value estimation. Am Economic Review 75: 397-402.
Krabbe PF. 2013. A Generalized Measurement Model to Quantify Health: The Multi-Attribute Preference Response Model. PloS one 2013.
http://www.plosone.org/article/info%3Adoi%2F10.1371%2Fjournal.pone.0079494#pone-0079494-g004 (accessed August 7 2014).
Krieger B, Cappuccio R, Katz R, and Moskowitz H. 2003. Next generation healthy soup: an exploration using conjoint analysis. J Sensory Studies 18: 249-268.
Krueger RA and Casey MA. 2009. Focus groups: a practical guide for applied research. Sage Publications Inc, Thousand Oaks, CA.
Lange C, Rousseau F, and Issanchou S, 1999. Expectation, liking and purchase behavior under economical constraint. Food Qual and Pref 10: 31-39.
Lange C, Martin C, Chabanet C, Combris P, and Issanchou S. 2002. Impact of the
information provided to consumers on their willingness to pay for Champagne: comparison with hedonic scores. Food Qual and Pref 13: 597-608.
Leppard P, Russell CG, and Cox DN. 2004. Improving means-end-chain studies by using a ranking method to construct hierarchical value maps. Food Qual and Pref 15: 489-497.
Liaw IW, Eshpari H, Tong PS, and Drake MA. 2010. The impact of antioxidant addition on flavor of Cheddar and Mozzarella whey and Cheddar whey protein concentrate. J Food Sci 75: 559-569.
Liaw IW, Miracle RE, Jervis SM, Listiyani MAD, and Drake MA. 2011. Comparison of the flavor chemistry and flavor stability of Mozzarella and Cheddar wheys. J Food Sci 76: 1188-1194.
Lin CF. 2011. Use of dynamic programming to improve the detection of means-end chains from laddering data. Quality and Quantity 45: 1385-1396.
List JA, and Gallet CA. 2001. What experimental protocol influence disparities between actual and hypothetical stated values? Environmental and Resource Economics 20: 241-254.
Loomis J, Brown T, Lucero B, and Peterson G. 1997. Evaluating the validity of the
dichotomous choice question format in contingent valuation. Environmental and Resource Economics: 10: 109-123.
Lusk JL. 2003. Effects of cheap talk on consumer willingness-to-pay for golden rice. Am J Ag Econ 85: 840-856.
Lusk JL, Jaeger SR, and MacFie H. 2010. Experimental auction markets for studying consumer preferences. Consumer-Driven Innovation in Food and Personal Care Products 195: 332-357.
Lusk JL, Fox JA, Schroeder TC, Mintert J, and Koohmaraie M. 2001. In-store valuation of steak tenderness. Am J Ag Econ 83: 539-550.
Lusk JL, and Rozan A. 2005. Consumer acceptance of biotechnology and the role of second generation technologies in the USA and Europe. Trends in Biotechnology 23: 386-387.
Lusk JL, and Shogren JF. 2007. Experimental auctions: Methods and applications in economic and marketing research. Cambridge University Press.
MacKenzie JEA, Spiller HB. 1996. A conjoint analysis of consumer preferences for vegetable products. Am J Ag Econ 78: 1395.
Mennecke BE, Townsend AM, Hayes DJ, and Lonergan SM. 2007. A study of the factors that influence consumer attitudes toward beef products using the conjoint market analysis tool. J Animal Sci 85: 2639-2659.
Menrad K. 2003. Market and marketing of functional food in Europe. J Food Engineering 56: 181-188.
Mesías FJ, Escribano M, De Ledesma AR, and Pulido F. 2005. Consumers' preferences for beef in the Spanish region of Extremadura: a study using conjoint analysis. J Sci Food and Ag 85: 2487-2494.
Morgan DL. 1998. The focus group guidebook. Sage Publications Inc, Thousand Oaks, CA.
Morrison MA, Haley E, Sheehan KB, and Taylor RE. 2011. Using qualitative research in advertising: strategies, techniques, and applications. Sage Publications Inc, Thousand Oaks, CA.
Murphy JJ, Allen PG, Stevens TH, and Weatherhead D. 2005. A meta-analysis of
hypothetical bias in stated preference valuation. Environmental and Resource Economics 30: 313-325.
Napolitano F, Pacelli C, Girolami A, and Braghieri A. 2008. Effect of information about animal welfare on consumer willingness to pay for yogurt. J Dairy Sci 91: 910-917.
Napolitano F, Braghieri A, Piasentier E, Favotto S, Naspetti S, and Zanoli R. 2010. Effect of information about organic production on beef liking and consumer willingness to pay. Food Qual and Pref 21: 207-212.
Neill HR, Cummings RG, Ganderton PT, Harrison GW, and McGuckin T. 1994. Hypothetical surveys and real economic commitments. Land Economics 70: 145-154.
Norman R, Hall J, Street D, and Viney R. 2013. Efficiency and equity: a stated preference approach. Health economics 22: 568-581.
Norman JJ, Arya JM, McClain MA, Frew PM, Meltzer MI, and Prausnitz MR. 2014. Microneedle patches: usability and acceptability for self-vaccination against influenza. Vaccine 32: 1856-1862.
Noussair C, Robin S, and Ruffieux B. 2004a. Revealing consumers' willingness-to-pay: A comparison of the BDM mechanism and the Vickrey auction. J Econ Psych 25: 725-741.
Oltman AE, Jervis SM, and Drake MA. 2014. Consumer Attitudes and Preferences for Fresh Market Tomatoes. J Food Sci.
Orme BK. 2010.Getting Started with Conjoint Analysis: Strategies for Product Design and Pricing Research Chapter 5: 39–50, 78–81, Research Publishers, Madison,WI.
Park CW, Bastian E, Farkas B, and Drake M. 2014. The effect of acidification of liquid whey protein concentrate on the flavor of spray-dried powder. J Dairy Sci 97: 4043-4051.
Pelegrine DHG, Gasparetto CA. 2005. Whey proteins solubility as a function of temperature and pH. Lebensm Wiss Technol 38:77-80.
Petrou S, and McIntosh E. 2009. Women's Preferences for Attributes of First‐Trimester Miscarriage Management: A Stated Preference Discrete‐Choice Experiment. Value in Health, 12: 551-559.
Pieters R, Baumgartner H, and Allen D. 1995. A means-end chain approach to consumer goal structures. International J Research in Marketing 12: 227-244.
Pole C. 2007. Researching Children and Fashion An embodied ethnography. Childhood 14: 67-84.
Pope C, Ziebland S, and Mays N. 2000. Qualitative Research in Healthcare: Analysing qualitative data. British Medical Journal 320: 114-116.
Rao VR. 2010. Conjoint analysis. Wiley International Encyclopedia of Marketing.
Reynolds TJ, and Gutman J. 1988. Laddering theory, method, analysis, and interpretation. J Advertising Research 28: 11-31.
Roosen J, Fox JA, Hennessy DA, and Schreiber A. 1998. Consumers' valuation of insecticide use restrictions: an application to apples. J Ag and Resource Economics 23: 367-384.
Rozan A, Stenger A, and Willinger M. 2004. Willingness-to-pay for food safety: An experimental investigation of quality certification on bidding behaviour. Euro Review Ag Econ 31: 409-425.
Russell TA, Drake MA, and Gerard PD. 2006. Sensory properties of whey and soy proteins. J Food Sci 71: 447-455.
Saulais L, and Ruffieux B. 2012. A field experiment to design healthier foods: consumer valuation of butter production processes. Food Qual and Pref 26: 178-187.
Shogren JF, Hayes DJ, Kliebenstein JB, and Fox JA. 1994. Bid sensitivity and the structure of the Vickrey auction. Am J Ag Econ 76: 1089-1095.
Shogren JF, List JA, and Hayes DJ. 2000. Preference learning in consecutive experimental auctions. Am J Ag Econ 82: 1016-1021.
Shogren JF, Margolis M, Koo C, and List JA. 2001. A random nth-price auction. Journal of economic behavior and organization 46: 409-421.
Silva A, Nayga Jr RM, Campbell BL, and Park J. 2007. On the use of valuation mechanisms to measure consumers’ willingness to pay for novel products: A comparison of hypothetical and non-hypothetical Values. International Food and Agribusiness Management Review 10: 165-80.
Sirkeci I, and Magnúsdóttir LB. 2011. Understanding illegal music downloading in the UK: a multi-attribute model. J Research in Interactive Marketing 5: 90-110.
Smithers GW. 2008. Whey and whey proteins—from ‘gutter-to-gold’. Int Dairy J 18: 695-704.
Sørensen A. 2003. Backpacker ethnography. Annals of Tourism Research 30: 847-867. Speed R. 1998. Choosing between line extensions and second brands: The case of the Australian and New Zealand wine industries. J Product and Brand Management 7: 519-536.
Stewart B, Olson D, Goody C, Tinsley A, Amos R, Betts N, and Voichick J. 1994. Converting focus group data on food choices into a quantitative instrument. J Nutrition Education 26: 34-36.
Tempesta T, Giancristofaro RA, Corain L, Salmaso L, Tomasi D, and Boatto V. 2010. The importance of landscape in wine quality perception: An integrated approach using choice-based conjoint analysis and combination-choice-based permutation tests. Food Qual and Pref 21: 827-836.
Tempesta T, and Vecchiato D. 2012. An analysis of the territorial factors affecting milk purchase in Italy. Food Quality and Preference 27: 35-43.
Tsuji T. 2012. Ethnography. In Field Informatics 55-72. Springer Berlin Heidelberg. Uchida H, Roheim CA, Wakamatsu H, and Anderson CM. 2014. Do Japanese consumers care about sustainable fisheries? Evidence from an auction of ecolabelled seafood. Australian J Agricultural and Resource Economics 58: 263-280.
Ulvila KM, Paloviita A, and Puupponen A. 2009. Consumers' perceptions of sustainably produced food: a focus group study. Progress in Industrial Ecology, an International Journal, 6: 355-370.
Umberger WJ, and Feuz DM. 2004. The usefulness of experimental auctions in determining consumers' willingness-to-pay for quality-differentiated products. Applied Economic
Perspectives and Policy 26: 170-185.
Van de Ven AH, and Delbecq AL. 1974. The effectiveness of nominal, Delphi, and interacting group decision making processes. Academy of Management J 17: 605-621.
Van Loo EJ, Caputo V, Nayga RM, Meullenet JF, and Ricke SC. 2011. Consumers’
willingness to pay for organic chicken breast: Evidence from choice experiment. Food Qual and Pref 22: 603-613.
Vestal MK, Lusk JL, DeVuyst EA, and Kropp, J. R. 2013. The value of genetic information to livestock buyers: a combined revealed, stated preference approach. Ag Econ 44: 337-347.
Völckner F. 2006. An empirical comparison of methods for measuring consumers’ willingness to pay. Marketing Letters 17: 137-149.
von Bergner NM, and Lohmann M. 2014. Future Challenges for Global Tourism A Delphi Survey. J Travel Research 53: 420-432.
Wright BJ, Zevchak SE, Wright JM, and Drake MA. 2009. The impact of agglomeration and storage on flavor and flavor stability of whey protein concentrate 80% and whey protein isolate. J food sci 74:17-S29.
Xue H, Mainville D, You W, and Nayga RM. 2010. Consumer preferences and willingness to pay for grass-fed beef: Empirical evidence from in-store experiments. Food Qual and Pref 21: 857-866.
Yu J, Goos P, and Vanderbroeck M. 2011. Individually adapted sequential Bayesian
conjoint-choice designs in the presence of consumer heterogeneity. International J Research Marketing 28: 378–388.
CHAPTER 2
Consumer Attitudes and Preferences for Fresh Market Tomato Attributes
A.E. Oltman, S.M. Jervis and M.A. Drake
ABSTRACT
This study established attractive attributes and consumer desires for fresh tomatoes. Three focus groups (n=28 participants) were conducted to explore how consumers perceived tomatoes, including how they purchased and consumed them. Subsequently, an Adaptive Choice Based Conjoint (ACBC) survey was conducted to understand consumer preferences towards traditional tomatoes. The ACBC survey with Kano questions (n=1037 consumers) explored the importance of color, firmness, size, skin, texture, interior, seed presence, flavor and health benefits. The most important tomato attribute was color, then juice when sliced, followed by size, followed by seed presence, which was at parity with firmness. An attractive tomato was red, firm, medium/small sized, crisp, meaty, juicy, flavorful and with few seeds. Deviations from these features resulted in a tomato that was rejected by consumers.
INTRODUCTION
In 2011, tomatoes grown in the US had a gross production value of 11.74 billion USD (FAOSTAT 2011). As a widely produced and consumed crop, sensory attributes of fresh tomatoes are important and lack of characteristic taste and flavor is a frequent complaint of fresh tomato consumers (Bruhn and others 1991). Tomatoes (Solanum lycoperiscum) have been characterized as having a sweet-sour taste with a complex mix of aromatics such as fruity/floral and green notes (Baldwin and others 2008). Hongsoonern and Chambers (2008) identified a descriptive language for fresh tomatoes and reported fruity, ripeness, sweetness, sourness and bitterness as well as green/viney, musty/earthy and fermented as attributes applicable to fresh tomatoes. In another study with trained panelists, sweet taste and fruity flavor of tomatoes were correlated (Baldwin and others 2008). Additionally, a tomato perceived as having good overall flavor was rated high in sweet taste, “tomato-like flavor” and fruity flavor with low intensities of sourness, bite and “green tomato flavor” by a trained panel (Tandon 2006). Sweet taste was correlated with overall tomato flavor liking (Malundo and others 1995; Baldwin and others 1998). Room ripened tomatoes had lower flavor quality than vine ripened tomatoes (Bisogni and others 1976; Stevens and others 1977), which could be due to the lower sugar content (Davies 1966; Kader and others 1977; Jones and Scott 1983). In a previous consumer study with cherry tomatoes, internal preference mapping revealed two consumer clusters: one that preferred red color and sweet taste and one that preferred acidity and firm texture (Pagliarini and others 2001).
established include flesh firmness, mealiness, meltiness, crispness and juiciness (Harker and others 1997; Redgwell and Fischer 2002; Szczesniak 2002). Previous research has focused on creating tomatoes with greater firmness in order to have greater disease resistance and longer shelf life (Hongsoongnern and Chambers 2008). The amount of gel and seeds within locules are unique aspects of tomato perceptions (Chaïb and others 2007). Finally, visual appearance of tomatoes is of utmost importance to consumer purchase decision, as other factors such as flavor and texture are not evident during purchase. Wolters and Gemert (1990) indicated that color and size were the most important visual attributes of tomatoes. Other extrinsic attributes such as health/nutrition and growing conditions may also influence consumer purchase.
evaluating all possible combinations of pre-selected, evaluated product attributes (van Kleef and others 2005). Conjoint analysis has also been widely applied to determine consumer preferences for extrinsic and intrinsic product attributes (Jervis and others 2012; Kim and others 2013; Childs and others 2009; Chung and others 2011). To our knowledge, studies have not addressed the role that both extrinsic and intrinsic properties contribute to consumer perception of tomatoes. The objective of this study was to determine the attributes of fresh market tomatoes that influence consumer purchase decisions. Focus groups and a conjoint analysis survey were utilized.
MATERIALS AND METHODS Focus Groups
Three focus groups were conducted to determine how consumers used tomatoes and to identify attractive tomato qualities. Panelists (n=28) (females, 19–45 y) that consumed tomatoes at least once a week and were the primary shoppers of the household participated. All subjects were recruited through email listservs to an online database of more than 5,000 consumers in the Raleigh/Durham, NC area maintained by the Sensory Service Center at North Carolina State University. A moderator facilitated the discussion using a planned discussion guide (Table 1). Each focus group was approximately 1.5 h and panelists were compensated for their participation with $40 gift cards.
groups were videotaped and tape-recorded for subsequent reference, and two observers took notes of key points mentioned by participants. Key points (those issues mentioned by two-thirds or more of the participants) from focus groups were recorded.
Conjoint Survey and Kano Questions
represented in all 10 choice tasks. Five unacceptable questions and four must-have questions were built in through the survey. The screening task was followed by a 10-question choice task tournament section. A maximum of 20 product concepts were brought into the tournament section, with three concepts per choice task.
Kano questions were subsequently asked regarding the same attributes evaluated in the ACBC survey with the addition of places where tomatoes were purchased (ex. Farmers’ market). Kano analysis is a technique where attributes are classified into quality based categories (Kano and others 1984; Erto and others 2011; Kim and others 2013). These categories include: Attractive- unexpected by the consumer; consumers are satisfied if this attribute is present. Indifferent- attributes that the consumer does not care about. Must have- expected by the consumer; if unavailable, consumers are dissatisfied. One dimensional- as the attribute increases, so does consumer liking. Reverse- leads to dissatisfaction. Attributes were presented to participants in the form of a paired question. Each question was posed to the consumer as the attribute (functional) and not fulfilled (dysfunctional). For example: tomatoes that are RED in color and tomatoes that are NOT RED in color. The response options for each question included ‘I will like it’, ‘I must have it’, I do not care’, ‘I can live with it’ and ‘I will dislike it’.
Statistical Analysis
Individual utility scores were extracted by hierarchical Bayesian (HB) estimation and rescaled using a centered difference method (Childs and Drake 2009). The zero-centered difference method was used to standardize utility scores for easy interpretation. A one-way analysis of variance with Fisher’s least significant difference was applied to utility scores. Cluster analysis of utility scores was performed with XLSTAT version 2012.6.06 (Addinsoft, Paris, France) using Euclidean distances and Wards linkage to categorize similar respondents into groups, and chi-square analysis was applied to determine any demographic differences among clusters. Principal component analysis (PCA) (XLSTAT) was also conducted to see how attributes and clusters were characterized. Kano questions were evaluated according to the model proposed by Kano and others (1984).
RESULTS Focus groups
freshness and flavor of the produce would not be easily detected in the dish were the most frequent responses. In all groups, at least one participant stated that they did not like tomatoes that were pre-packaged on foam trays- it was important that they were able to handle the tomato and evaluate it for themselves before purchasing. After this point was brought up, most participants (>80%) agreed that they preferred to touch the tomato before purchasing. Tomatoes on the vine were an indicator of freshness to some (30%) consumers. Many participants (>50%) were generally not willing to pay more for organic tomatoes. When asked why, some participants said that the organic tomato selection was not more visually appealing than conventional tomatoes.
varieties. In the grocery store, the majority of participants (>80%) expected to buy traditional types of tomatoes, such as round and roma types. Buying tomatoes of local origin was an attractive feature to the majority of participants (>80%). When asked why, people agreed that it made them feel good to support the local economy by purchasing locally grown tomatoes.
Firmness to touch was considered an important attribute by the majority of participants (>80%). Most participants (70%) would only buy tomatoes that were firm, though some said it would also depend on how soon they plan to use the tomato. Another highly cited attribute that determined tomato purchase was color. Most people (80%) liked dark-red colored tomatoes, with only a few people (<20%) mentioning they would not mind a lighter red, or yellow, or orange color.
Other attributes of interests, such as flavor, shape, size, juiciness, crispness, and skin types were mentioned by a small number of participants (25%). Some participants (20%) commented that flavorless tomatoes were unacceptable; some participants (30%) described a good tomato flavor as “fresh.” However, for many consumers (50%), good tomato flavor was not considered a key attribute for purchase decision, especially when tasting a tomato was impossible in the grocery store. The majority of participants (>50%) generally preferred perfectly round shaped tomatoes, but when compared with other factors such as firmness, color and price, shape was not as important.
(75%) indicated they would not use those parts, and considered them an unfavorable attribute.
Conjoint analysis
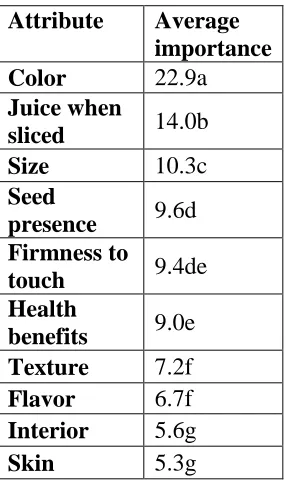
Seventy seven percent of those surveyed were female and 23% were male. Participants were mostly Caucasian (70%) followed by African American (15%). Most consumers had at least some college education (>95%). There was an even spread of age (18-65) and income (<$20,000 to over $95,000 per year). Sixty five percent of participants consumed tomatoes weekly and 28% consumed tomatoes at least 2-3 times a month. Nearly half of participants (48%) purchased tomatoes at least once a week. Most of those surveyed (93%) purchased tomatoes at a local grocery store and 48% purchased tomatoes at a local farmer’s market. Color was most important (p<0.05), followed by juice when sliced (p<0.05), followed by size (Table 3). Skin thickness and interior (juicy versus meaty) were the least important attributes. The importance of color was consistent with an internal
preference mapping study with cherry tomatoes by Pagliarini and others (2001). Wolters and Gemert (1990) also cited color as an important tomato attribute as well as size. Color was also an important attribute cited in the focus groups in the current study.
were preferred over thick skinned (p<0.05) and medium size was preferred over small and large (p<0.05). For interior attributes, crisp texture was preferred over soft (p<0.05), a juicy interior was preferred over meaty (p<0.05), few seeds were preferred to many or none (p<0.05), bold flavor was preferred over mild (p<0.05) and a small amount of juice was preferred over a large amount or none (p<0.05).
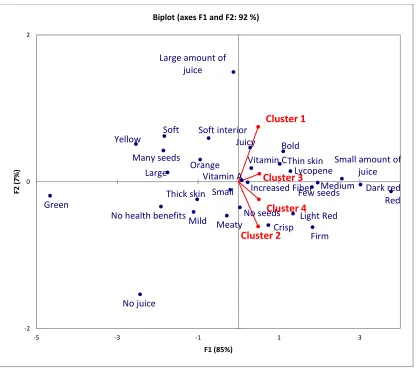
Four consumer clusters were identified from utility scores (Figure 1). Cluster 1 (n=223) was characterized by consumers who liked tomatoes that were juicy, red, soft, had bold flavor and a large amount of juice. Cluster 2 (n=279) contained consumers who
preferred firm, crisp tomatoes with no seeds. Cluster 3 consumers (n=219) were attracted to color, health benefits, bold flavor and a small amount of juice and few seeds. Cluster 4 consumers (n=316) had the highest importance score for color and preferred tomatoes red in color, also rejecting soft tomatoes.
Kano questions
All attributes were labelled ‘attractive’ except for the colors yellow, orange, light red and green, areas of different color, soft (exterior and texture), large size, thick skin, organic and the presence of many seeds. Though attributes were classified as either “attractive” or “reverse”, across all consumers, clusters were distinct (Table 5). Green color across the general survey population was a negative attribute but for two clusters, green color had no effect. Cluster 1 (n=223) was the only cluster to assign juicy interior as a one dimensional performer, meaning the juicier the interior, the higher consumer satisfaction would be. This result is consistent with utility scores for juiciness (Figure 1). This cluster assigned
cluster was most dissatisfied with no juice, no seeds and thick skin. This cluster was also most accepting of ‘non-red’ color.
Cluster 2 (n=279) was the only cluster to classify firm tomatoes as attractive, this attribute was indifferent to other consumers. Soft interior texture and softness of the whole tomato were dissatisfying attributes to these consumers. High satisfaction scores within cluster 3 (n=219) were assigned to dark red and juicy. Cluster 4 (n=316) was the only cluster to assign ‘one dimensional’ to red, and ‘reverse’ to yellow, orange and multiple areas of a different color. This cluster was also the only one to assign ‘indifferent’ to antioxidants, vitamins A, C and D and bold flavor. This cluster had the highest number of indifferent attributes (n=31) as well as the lowest number of attractive attributes (n=3, dark red color, flavor, health benefits), suggesting that cluster 4 consumers are less likely to purchase fresh tomatoes for specific tomato attributes but perhaps purchase them solely as condiments (eg on a sandwich) or for color in an application (salad), or have been disappointed with previous purchases and have key expectations for color, flavor and health benefits.
DISCUSSION
would be willing to try “unconventional appearing” tomatoes, some consumer clusters in the survey (clusters 1, 2 and 3) were indifferent to “deviant” tomato colors and conjoint and Kano questions allowed greater clarification of these attributes compared to focus groups alone. According to the focus groups, traditional red color was desired because of familiarity and consumers do not want to “risk” buying an unconventional tomato.
Juice when sliced received the second highest (p<0.05) importance score by conjoint analysis. Firmness, which relates to the juice content, was important to focus group
participants as well as to some in the conjoint survey- firmness was classified as an attractive attribute in Kano analysis for the total population as well as by cluster 2. Degree of firmness may also indicate the presence of gel and being soft and mealy; soft was undesirable in Kano questions to all clusters. Tomatoes that are not firm are susceptible to chilling injury
(Jackman and others 1990). Chilling injury (physical damage that occurs in plants because of exposure to low but not freezing, temperature) can be characterized by non-uniform color, uneven surfaces and patches of green and yellow (Jackman and others 1990). These terms Jackman and others (1990) used to describe the tomato skin are similar to attributes used in this survey: yellow, green, small area of a different color and multiple areas of a different color. All of these attributes were reverse in Kano analysis meaning they were undesirable to consumers. Firmness may be used to evaluate a tomato for the extent of its chilling injury, which consumers may able to visualize.