ISSN: 2319-8753
I
nternational
J
ournal of
I
nnovative
R
esearch in
S
cience,
E
ngineering and
T
echnology
(An ISO 3297: 2007 Certified Organization)
Vol. 3, Issue 6, June 2014
Measurement of Complex Permittivity of
Dielectrics and Its Applications
Pravin K. Bhadane#1, Sheetal V. Bambal #2
#1,2
Department of Electronics, Nowrosjee Wadia College Pune-411 001, India
ABSTRACT: Measurement of dielectric properties provide valuable information about the physical parameters of agricultural & food products. Precise measurement of complex permittivity (CP) gives details of moisture content in products. In the present work we have used simple electronic method for the measurement of CP. We have used microcontroller for measurement & calibration of CP. The electronic circuit is designed with the help of low cost locally available components. The software program is developed in C language in Keil environment. The results obtained for CP are accurate and can be used for the estimation of moisture content. The electronic circuit can be used for the measurement of other dielectric properties such as dielectric strength & loss. The combine effect of all the dielectric properties can be easily implemented in the software.
KEYWORDS: permittivity, microcontroller, dielectric.
I.INTRODUCTION
Permittivity is the property of a dielectric material and depends on its molecular structure. The permittivity also depends on environment related parameters such as temperature and moisture content [1]. The food and agricultural products can conduct electric current to some degree, but they also show dielectric properties [2]. For the dielectric properties the main parameter is the complex permittivity which describes the material behaviour when it is subjected to an electric field.
The dielectric measuring techniques can be divided into two main categories namely, resonant and non-resonant, the resonant methods can characterize the material at single frequency. In this method a dielectric material used as a resonant element. A non-resonant method can measure over the broad range of frequencies. It can categorize the material by determining the reflection and transmission coefficients that causes changes in characteristics impedance and wave velocity [3].
Interest in electric properties of agricultural materials has increased as the agricultural technology has become more sophisticated, as new devices for characterization are being developed. Electric properties of agricultural products have been of interest for many years. One of the earliest applications of such electrical properties was the study of dc electrical resistance of grain for rapidly determination of its moisture content. Waterer found a logarithmic increase in electrical resistance as the moisture content of grain decreased [4]. He had used direct current conductivity method for measuring the moisture content of grains. Since bulk grain is a mixture of grain particles and air, measurement of the dielectric properties is more difficult than if it were a homogeneous substance consisting of grains only [5]. There is a need of better automated measurement technique for the measurement of permittivity. The objective of this work was to investigate simple automatic device for measurement of permittivity of agricultural material.
II.EXPERIMENTALWORK
The dielectric properties, or permittivity, of a material determine the interaction of that material with electric field. For practical use, the dielectric properties of usual interest are the dielectric constant and the dielectric loss factor, the real and imaginary parts, respectively, of the relative complex permittivity,
ε = ε' – jε'' = |ε|e–jδ
ISSN: 2319-8753
I
nternational
J
ournal of
I
nnovative
R
esearch in
S
cience,
E
ngineering and
T
echnology
(An ISO 3297: 2007 Certified Organization)
Vol. 3, Issue 6, June 2014
the measurement of the permittivity. The parallel plate capacitor method involves sandwiching of a dielectric material (agricultural sample) between two plates to form a capacitor. In the present work, a parallel plate capacitor (cell) with plate area 100 X 10-4 m2 and separation distance 10-2 m has been constructed for the measurement of permittivity. Since capacitor is a physical device, it has constant plate surface area (A) and distance between the plates (d). Changes in its capacitance are then dependent only on dielectric properties of the material placed between the plates. Converting a capacitor into a permittivity sensor is practically quite simple, the material to be tested is placed between the capacitor plates as the dielectric, as shown in Figure 1.
III.RESULTS AND DISCUSSION
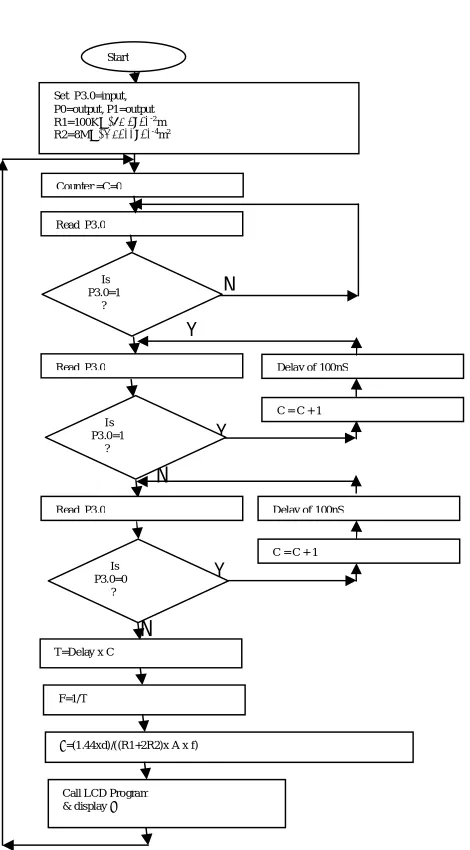
The oscillator circuit uses the permittivity cell as a timing capacitor. It generates square wave oscillations of frequency 8 MHz for the empty cell. When the cell is filled with agricultural sample then increase in the frequency observed. The square wave signal is converted into differentiated signal i.e. spikes. Diode is used as clipper for negative spikes. Time period between two positive spikes and the corresponding frequency has been measured by microcontroller program. The program also calculates the permittivity by following formula.
E = (1.44 x d ) / (R1 + 2 x R2 ) x A x f
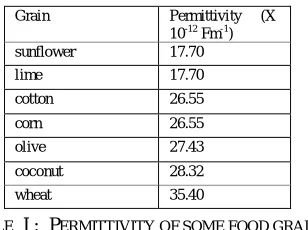
Figure 2 shows the flowchart of the permittivity computation program. The steps involved in the measurement of frequency and its conversion into permittivity are shown in the flowchart. The device has been used to measure the permittivity of some food grains. The measured permittivities are depicted the Table I.
TABLE I : PERMITTIVITY OF SOME FOOD GRAINS.
The software program has been developed in the C language and listed at the end of the article. The source code is compiled in Keil IDE and programmed into microcontroller ATMEL 89C51 with the help of µC-flash programmer. Soft copy of source code can be obtained freely from the authors.
Grain Permittivity (X
10-12 Fm-1)
sunflower 17.70
lime 17.70
cotton 26.55
corn 26.55
olive 27.43
coconut 28.32
wheat 35.40
Figure 1 : Circuit diagram for the measurement ofpermittivity. 89
C5 P
P1.1
R3=100
Ω
C2=
1nF
Rs Rw En D0-D7
LCD
P1.0
P1.2
P2
89C51 P3.0
7 4 8
6
2 3
5 1 +5V
R1=
10K
R2=
1MΩ
IC555
Permittivity
cell
IC741
ISSN: 2319-8753
I
nternational
J
ournal of
I
nnovative
R
esearch in
S
cience,
E
ngineering and
T
echnology
(An ISO 3297: 2007 Certified Organization)
Vol. 3, Issue 6, June 2014
IV.CONCLUSIONS
The device for the measurement of permittivity has been developed. It includes construction of electronic circuit and the software program. The required electronic components are low cost and locally available. The device has been successfully tested for some agricultural samples. The program has been tested for some fruits and the obtained results are dependable. The charging – discharging cycle of capacitor minimizes the dielectric loss and polarization effect. The moisture content is proportional to the permittivity of sample and the relationship between them can be established from the observations. Our future plan is to interface circuit with Computer for the continuous measurement of permittivity and its graphical analysis.
Y N
Y
N
Ɛ=(1.44xd)/((R1+2R2)x A x f) Counter =C=0
Read P3.0
Is P3.0=1 ?
Read P3.0
Is P3.0=1 ?
Read P3.0
Is P3.0=0 ?
T=Delay x C
F=1/T
Call LCD Program & display Ɛ
Delay of 100nS
C = C + 1
Delay of 100nS
C = C + 1 Start
Set P3.0=input, P0=output, P1=output R1=100KΩ, d= 1x10⁻²
m R2=8MΩ, A=100x10-4m2
Figure 2 : Flowchart for the permittivity measurement. N
ISSN: 2319-8753
I
nternational
J
ournal of
I
nnovative
R
esearch in
S
cience,
E
ngineering and
T
echnology
(An ISO 3297: 2007 Certified Organization)
Vol. 3, Issue 6, June 2014
ACKNOWLEDGEMENT
The authors are sincerely thankful to the Principal, N. Wadia College, Pune for his kind support.
REFERENCES
[1] S.O. Nelson, L.H. Soderholm, and F.D. Yung, “Determining the dielectric properties of grain,” Agricultural Engineering , vol.34(9), pp.608-610, 1953.
[2] C. Gabriel, S, Gabriel, and E. Corthout, "The Dielectric Properties of Biological Tissues : I. Literature survey, " Physics in Medicine and Biology, vol. 41, pp. 2231-2249, 1996.
[3] M.S. Venkatesh and G.S. V. Raghavan "An Overview of Dielectric Properties Measuring Techniques," Canadian biosystems engineering, vol. 47, pp. 7.15-7.30, 2005.
[4] D. Waterer, W.E. Muir, and R. N. Sinha , “Electrical resistance probe for detecting stored grain deterioration,” Canadian Agricultural Engineering, vol. 27, pp. 73-77, 1985 .
[5] S. O. Nelson, P.G. Bartley, "Measuring Frequency and Temperature Dependent Permittivities of Food Materials," in IEEE transactions on instrumentation and measurement, vol. 51 (4), pp.589-592, 2002.
// program to calculate the permittivity and display it on // the LCD
/******** Header Files Declaration ***************/ #include<reg51.h>
#include<stdio.h>
/******** LCD control signals declaration ********/ sbit rs = P1^0; // Register Select line
sbit rw = P1^1; // Read/write line sbit en = P1^2; // Enable line sbit sq = P3^0;
#define lcdport P2 // LCD data lines are connected to P2 /********* LCD function prototypes ***********/ void lcdcmd(unsigned char);
void lcddata(unsigned char); void lcdinit(void);
void delay(unsigned int);
/**** Main Function declaration *********/ void main()
{
char arr1[]="PERMITIVITY"; double e;
int i; int c;
int d=1,a=100,e1; double t,f;
double r1=100000,r2=10000000;
lcdport = 0x00; // Make the port as output port lcdinit(); // LCD initialization
while(1) { c=0;
while(sq==0); while(sq==1) {
ISSN: 2319-8753
I
nternational
J
ournal of
I
nnovative
R
esearch in
S
cience,
E
ngineering and
T
echnology
(An ISO 3297: 2007 Certified Organization)
Vol. 3, Issue 6, June 2014
}
while(sq==0) {
c=c+1;
for(j=0;j<=0;j++); }
t=100*c; f=1000000000/t;
e = ((1.44*d) * 1000000000000)/((r1+2*r2)*a*f ); e1=(int)e;
lcdcmd(0x85); delay(100);
for(i=0;arr1[i]!='\0';i++) {
lcddata(arr1[i]); }
delay(500); // Delay of 0.5sec
lcdcmd(0xC6); // Force cursor to the 2nd line delay(100);
lcddata(char(e1)); delay(500); }
}
/******LCD Initialization Function declaration */ void lcdinit()
{
lcdcmd(0x38); // configuring LCD as 2 line lcdcmd(0x0E); // Display on, Cursor blinking lcdcmd(0x01 // Clear Display Screen }
/* LCD Command Sending Function declaration */ void lcdcmd(unsigned char command)
{
lcdport = command;
rs = 0; // Select Command Register rw = 0; // write operation
en = 1; // High to Low pulse delay(1); // 1 ms delay en = 0;
}
/*** LCD data Sending Function declaration */ void lcddata(unsigned char value)
{
lcdport = value;
rs = 1; // Select Data Register rw = 0; // write operation
en = 1; // High to Low pulse with nearly 1ms delay(1); // 1 millisec delay
en = 0;
delay(100); // 100 millisec delay }
ISSN: 2319-8753
I
nternational
J
ournal of
I
nnovative
R
esearch in
S
cience,
E
ngineering and
T
echnology
(An ISO 3297: 2007 Certified Organization)
Vol. 3, Issue 6, June 2014
void delay(unsigned int val) {
unsigned int i,j; for(i=0;i<=val;i++) {
for(j=0;j<=0;j++); }