Inference From Clines Stabilized by Frequency-Dependent Selection
James Mallet* and Nick Barton?
*Department of Entomology, Mississippi State University, Mississippi State, Mississippi 39762, and ?Galton Laboratory, Department
of Genetics and Biometry, University College, London h W 1 2HE, England Manuscript received November 7, 1988
Accepted for publication April 28, 1989
ABSTRACT
Frequency-dependent selection against rare forms can maintain clines. For weak selection, s, in simple linear models of fre uenc -dependence, single locus clines are stabilized with a maximum slope of between
&/&
u and? /
s/ 12 6, where u is the dispersal distance. These clines are similar to those maintained by heterozygote disadvantage. Using computer simulations, the weak-selection analytical results are extended to higher selection pressures with up to three unlinked genes. Graphs are used to display the effect of selection, migration, dominance, and number of loci on cline widths, speeds of cline movements, two-way gametic correlations (“linkage disequilibria”), and heterozygote deficits. The effects of changing the order of reproduction, migration, and selection, are also briefly explored. Epistasis can also maintain tension zones. We show that epistatic selection is similar in its effects to frequency-dependent selection, except that the disequilibria produced in the zone will be higher for a given level of selection. If selection consists of a mixture of frequency-dependence and epistasis, as is likely in nature, the error made in estimating selection is usually less than twofold. From the graphs, selection and migration can be estimated using knowledge of the dominance and number of genes, of gene frequences and of gametic correlations from a hybrid zone.G
ENE frequency clines can be stabilized by various forms of natural selection. Theoreticians have mainly investigated cases where geographic variation in selection pressures (HALDANE 1948; FISHER 1950; SLATKIN 1973, 1975; MAY, ENDLER and MCMURTRIE1975; ENDLER 1977) or heterozygote disadvantage (BAZYKIN 1969; BARTON 1979) maintain clines. Clines can also be stabilized purely by epistasis (BAZYKIN
1973), and by frequency-dependent selection if the rare form is at a disadvantage (MALLET 1986a). Het- erozygote disadvantage, epistasis, and frequency-de- pendent selection can all maintain “tension zones” (HEWITT 1988). Tension zones differ from ecologi- cally determined clines in that they are not rooted to environmental gradients, but tend to move until trapped by dispersal barriers o r areas of low popula- tion density (BAZYKIN 1969; BARTON 1979).
Tension zones connect groups of populations at different stable genetic equilibria (often adaptive
peaks); thus they form an important component of WRIGHT’S (1932) “shifting balance” model for the evolution of new stable equilibria. Of course, natural tension zones can form by secondary contact between already-diverged populations; but if divergence by the shifting balance does occur in parapatry, a tension zone will be present between the nascent equilibrium and the equilibrium from which it evolved. T h e shift-
of page charges. This article must therefore be hereby marked “aduertisment”
T h e publication costs of this article were partly defrayed by the payment in accordance with 18 U.S.C. $1734 solely to indicate this fact.
Genetics 122: 967-976 (August, 1989)
968 J. Mallet and N. Barton
kind of selection across continuous tension zones, as well as interdemic selection, makes the shifting bal- ance much more likely than is often assumed, in the same way that individual selection allows the spread of rare advantageous mutations within a population (WRIGHT 1980). T h e study of tension zones is there- fore important for understanding genetic divergence,
including chromosomal evolution (BAZYKIN 1959)
and some kinds of speciation (WRIGHT 1982; BARTON
and CHARLESWORTH 1984).
Warning and mimetic colors of insects often differ greatly between regions. Stable clines (tension zones)
in warning pattern can be maintained by density-
dependent predator attacks: when a form is rare, it is selected against because predators do not recognize it
as being unpalatable. This predator behavior gives
rise to frequency-dependent selection which causes
Mullerian mimicry between unpalatable species, as
well as lack of color polymorphism within unpalatable
species (MALLET and SINGER 1987; ENDLER 1988).
There have been no previous theoretical analyses of clines maintained by frequency-dependent selection, although such theory would be useful for analyzing many hybrid zones between mimetic and warningly colored insect taxa: there are thousands of such hybrid zones known in neotropical butterflies alone (e.g.,
BROWN, SHEPPARD and TURNER 1974; BROWN 1979);
similar clines are found in bumblebees (OWEN and
PLOWRICHT 1980; P. H. WILLIAMS personal commu-
nication) and soldier beetles (MCLAIN 1988) among many other insects. Of course, other mechanisms of selection could also be involved: however, the pres-
ence of tight Mullerian mimicry between many of the
species is good evidence that frequency-dependence is operating within these species. Frequency-depend- ent selection is likely to stabilize a variety of other clines: for example fronts between strains of bacteria with and without the ability to produce allelochemicals (LEVIN 1988), and clines between races having assor-
tative mating (MOORE 1979) or sexual selection pro-
vided that the rare form is at a disadvantage (LANDE
1982; MOORE 1987; JOHNSON, MURRAY and CLARKE
1987). There is also a close relationship, demonstrated below, between clines maintained by frequency-de-
pendent selection and those maintained, like many
chromosomal clines, by heterozygous disadvantage. We here analyze tractable cases of clines at one locus with weak frequency-dependent selection, and use computer simulations to investigate more complex cases of strong selection on one, two and three loci. T h e immediate purpose of this work is to provide models for analyzing hybrid zones in Heliconius (Lep- idoptera): these models enable one to infer both selec- tion and gene flow without recourse to field experi-
ments [see BARTON (1982) and SZYMURA and BARTON
(1986) for examples of the method applied to other clines].
CLINES A T A SINGLE LOCUS UNDER WEAK
SELECTION
When selection is weak, gene flow may be approxi- mated by diffusion at a rate u2, so that over a linear dimension x , the gene frequency
p
of a locus A changeswith time t as follows (HALDANE 1948; NAGYLAKI
1975):
where u2 is the variance in parent-offspring distance along some axis, and S
( p )
is the effect of selection. Asimple case of a diploid frequency-dependent S
( p )
has intermediate heterozygote fitness:w,,
= (w,,+
w,n)/2 = 1-
sI
where W is fitness,
f
is the frequency of genotypes, and 0 5 s 5 0.5 is a constant determining the strength of frequency-dependence. T h e selection coefficient of 0 5 2s 5 1 was chosen to make the similarity between frequency-dependent selection and heterozygous dis- advantage self-evident, as explained below. At low selection pressures, mean fitness z 1 and these fit-nesses lead to:
This is identical to S ( p ) for a heterozygous disadvan- tage of s (BAZYKIN 1969). Thus the homozygote fit-
nesses in the frequency-dependent model play little role in the dynamics under the diffusion approxima- tion, which applies when selection is weak. T h e differ- ences between heterozygous disadvantage and fre- quency-dependent selection enter only through the mean fitness, which will be close to 1 for small s.
Equation 1 can then be integrated to give, at equilib- rium:
p z -
1{
+ tanh["
-
20)""1
j
2 2a
where X" is the point at which
p
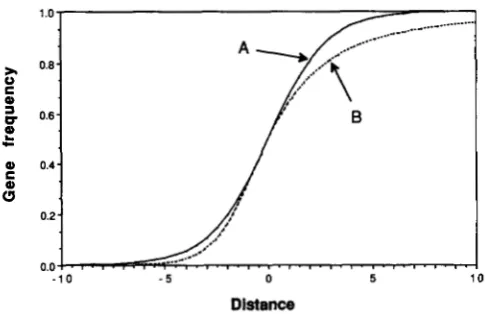
= 0.5 (BAZYKIN 1969; BARTON 1979). Figure 1A shows this integral. T h emaximum gradient for this frequency-dependent
Frequency-Dependent Selection
0.24
/
~ I ' I ' . ~ I ' I . I ~ I . I ' ~ ' ~ ' I '
- 1 0 - 5 0 5 1 0
Distance
FIGURE 1 .--Single locus clines at equilibrium under weak selec-
tion. Curve A , a codominant locus, Equation 3. Equation 6 is similar:
selection is approximately as effective in the center, but only 1/2 as
effective at the edge: the cline will be as steep. Curve B , a
dominant locus, equation (8). Distance is measured in standardized
units of 0/4Js.
quently, and so has a lower average fitness.
T h e model in
(2)
is unrealistic because the fitness of heterozygotes is expected to depend on the fre- quencies of similar and different phenotypes, rather than being a simple average of the homozygote fit-nesses. T h e possibility of dominance also needs to be incorporated. With warning color, heterozygotes can be remembered as a separate phenotype, although "generalization" between heterozygotes and homozy- gotes (the tendency for predators to confuse similar phenotypes) is likely. Predator generalization between all three genotypes may also occur, but will not cause differential selection, and so is ignored. We use a linear frequency-dependent model for three reasons: a linear model can be viewed as a regression through the actual frequency-dependent function; the actual nonlinear selection function is not known; and linear
and nonlinear functions produce similar clines (MAL-
LET 1986a). Selection is assumed not to affect popu-
lation density, so that only genotype frequencies need to be modeled. This is likely for a butterfly with strong density-dependent factors controlling population size in the larval stage, as is apparently true in Heliconius
(GILBERT and SMILEY 1978; MALLET 1984). In the simplest case, selection reduces the frequency of a genotype in proportion to its phenotypic rarity (1
-
j )
, where
f
is the frequency of that genotype and of similar phenotypes. For example, W,.,,4 = 1-
2s[l-
f A A
-
h ~ A Q ] = 1-
2 S E Q + (1-
h)fAQ], where thedominance of A (equivalent to predator generalization
between Aa and AA) is given by 0 5 h 5 1. T h e complete model is then:
where the individual selection coefficients, 2s, in warn- ing color depend on the memorability of that pattern's genotype. T h e three selection coefficients represent the actual reduction in fitness due to rarity for each genotype. If sAa
>
sAA and sAa>
sau, heterozygotes have a disadvantage-this may occur with warning color if the hybrid phenotype is less memorable. In warning color, if sAA<
sa, the A pattern is more memorablethan a, and interdemic selection between two color patterns might be expected to move clines so as to fix
A over the whole range [see BARTON (1 979) for similar movement of clines with heterozygous disadvantage and selection against one homozygote]. The simplest case is to assume that there are no differences in memorability of the phenotypes (sAA = sAa = sa, = s);
then
s(p)
=
2spq[(1-
h)p(2p2-
1) + h q ( i-
2q2)]. ( 5 )If the locus A is codominant, h = 1/2, and
Q)
=
S P d P ' + Q2)@-
9). (6) Again S ( p ) approximates that for heterozygous dis- advantage, differing only by a factor of(p'
+
q2),which always lies between 1 (at the edge of the cline) and 1/2 (in the center). T h e cline shape therefore differs little from that in (3) (Figure lA), except that the maximum gradient obtained by integration ( d p /
dx & / m a ) is
d
m
as great. This is confirmed in the simulations below for low s. In contrast, domi- nance ( h = 1) gives:A cline set up with this selection regime will move
because of the interdemic selective asymmetry due to
dominance (MALLET 1986a). It is hard to find the
shape of a moving cline because the velocity cannot, in general, be found analytically. We can find the approximate cline shape by supposing that there is a selective asymmetry which just suffices to prevent movement. In nature also, movement may often be prevented by a dispersal or selection gradient which will produce similar effects. T h e necessary asymmetry is given by:
S ( p )
=
2spq2 (4/5-
2 ~ ' ) . (8)Setting d p / d t = 0 in (1) gives for this model:
9
x'
-
x'o =d(iqq
j-
4
0.5 d l
-
q ) J [ d 4+
5911where distance is now measured in standardized units of x' = a/2 Js. This can be integrated numerically to give the cline in Figure 1 B. T h e cline is asymmetrical:
on the side where dominants are common, most re-
970 J. Mallet and N. Barton
side of the cline on the other hand, selection weeds out the rare dominant alleles even when in heterozy-
gotes, giving an abrupt tail. HALDANE (1 948) showed
that similar asymmetries are expected with dominance in clines responding to environmental discontinuities.
Because there are only two phenotypes, we might
expect the gradient in the center of the cline to be similar to that of (3): this is confirmed in the simula- tions.
CLINES WITH ARBITRARILY STRONG
SELECTION; 1-3 LOCI
Methods: In the above results S ( p ) was calculated assuming that =: 1, and that genotypic frequencies
are in Hardy-Weinberg equilibrium. Neither holds
under strong selection. Analytic results also become
difficult with more than one locus. We therefore
performed computer simulations of clines on a linear array of demes to investigate how selection affects the
maximum gradient, speed of movement, heterozygote
deficiency within demes (F), and linkage disequilibria
( R = D/J[p~q,p~q~], where D = f A B
-
PAP,
and f A B isthe frequency of AB gametes).
T h e simulations employ the exact linear frequency- dependent selection given by (4), with either complete dominance ( h = 1, also used by MALLET [ 1986a1) or codominance ( h = 112). We modeled a one-dimen- sional cline in a series of demes connected by migra-
tion. In MALLET (1 986a), “stepping-stone” (KIMURA
and WEISS 1964) migration between adjacent demes
was used. However, this causes inaccuracies when s/u
=
1 or greater because the clines become grosslydiscontinuous. Here we use binomial migration, a generalization of the stepping-stone model, with the “number of trials” = 2n demes. T h e proportion arriv- ing in a deme i demes away from the source is:
(‘n)! a ( n - t ) (1
-
( n-
i)! ( n+
i)!For symmetric migration as used here, LY = 1
-
LY =112, and the variance of parent-offspring distances,
u2, in simply n. This migration is approximately Gaus-
sian for large n. Beyond each edge of the deme array
there were assumed to be n imaginary demes with
genotypic frequencies identical to those of the edge
deme. These imaginary demes acted as sources for
the immigrants that arrived within the deme array. We checked for approximate continuity by doubling
n : if the resulting cline widths did not scale linearly
with u, we used a still higher level of migration. Edge effects were eliminated similarly; if the cline shape was affected by changing the total number of demes, the demes were increased until no further effect was noticed.
Strong selection on warning color genes is likely in the field [each gene may consist of many tightly linked
loci: see MALLET (1986a, 1989) and MALLET and
BARTON (1989)l. Therefore we ran simulations with
selection pressures, 2s, of 0.05, 0.1, 0.2, 0.3, 0.5,
0.75, 0.9 and 0.99. Migration levels, u2, used for each selection pressure were 10, 10, 15, 15, 30, 30, 30 and
30, respectively. T h e fitness of a genotype is assumed to be the product of the separate fitnesses at each locus. Such multiplicative fitnesses can be justified if
selection occurs independently on each locus: the
probability of survival is then equal to a product of the separate probabilities of escape due to each locus. Additive fitnesses could have been used, but there is very little difference between these modes with weak selection.
In reality, selection will of course be much more
complex. Consider warning color: a number of param-
eters will characterize phenotypic selection, the fre-
quency-dependence will be nonlinear, and epistasis,
which is modeled below for some special cases, will produce strong interactions between the fitnesses at individual loci (e.g., MALLET 1989). Inference from these simplified models will therefore give an “effec- tive” selection pressure that is dependent on this ideal- ized model situation.
For the most part, we assume that genotypes or
phenotypes have equal frequency-dependence (in
warning color, the phenotypes would then be equally memorable) so that a single per locus selection pres- sure, 2s, characterizes all phenotypes within and be- tween different loci. We repeated the simulations for one-locus clines, and for hybrid zones involving two or three loci, with various combinations of dominance for each locus ( h = 1/2 or 1). T h e loci are assumed to be unlinked throughout. Measurement of
p,
F , R , and third order D [as defined by SLATKIN (1972) andBARTON (1 982)] took place immediately before repro-
duction in each generation. The order of processes was normally assumed to be: reproduction (consisting of mating, offspring production, and growth to adult-
hood)-migration-selection. For Heliconius this seems approximately valid: adults eclose, immediately dis-
perse, and then set up home ranges (MALLET
1986b,c), and many vertebrate species will be similar. With strong selection the order of processes matters [see also MANI (1985)l so we have also investigated
another possibility: reproduction-selection-migra-
tion. For a few special cases we have also demonstrated the effect of removing disequilibria at meiosis, and of combining epistasis with frequency-dependent selec- tion.
Frequency-Dependent Selection 97 1
5
0.3E 0.2
2
0.1 0.00.0
0.5 1.0
1 ’ u
0.5
Oh
1.
0.50.0
0.0 0.5 1.0 0.0 0.5 1 .O
0.0
FIGURE 2.-Maximum slope (standardized by multipl ing by a)
in simulated tension zones plotted against selection,
/-
(2s). (A) 1 locus; (B) 2 loci; (C, D) 3 loci; (A)-(C) all have the standard orderreproduction-migration-selection; (D) has an alternative order of reproduction-selection-migration. The lines represent all domi- nant (open squares), and all codominant (filled squares) clines. In (C) the mean slope (dashed line) of clines in a zone with 1 codomi- nant locus and 2 dominant loci is also plotted. The low s approxi- mations for dominant genes (J[s/S], upper dotted line), and codom- inant genes (J[s/12], lower dotted line) are also shown in each figure.
color patterns are equally fit, but that any hybridiza- tion with the other pattern reduces fitness by an
amount e for each whole phenotypic element changed,
and e/2 for each heterozygous element at codominant loci. Suppose a mixture of one codominant locus, A ,
and t w o completely dominant loci, B and C interact
in a tension zone (as occurs in Heliconius). Then AA
B- C- and aa bb cc are both pure patterns having maximum fitness 1; A A B- cc, AA bb C-, A A bb cc, aa B- C-, aa B- cc and aa bb C- are one step away from pure, with fitness 1
-
e; Aa B- C- and Aa bb cc are half a step away, and have fitness 1-
e/2; Aa B- ccand A A bb C- are 1 % steps away, and have fitness ( 1
-
e)(l
-
e/2). Note that a result of this conceptually simple model of “epistasis” is an automatic heterozy- gote disadvantage of e/2 for codominant loci: their heterozygotes are always deviants from the pure pat- tern. Simulations have been run for a few cases using various mixtures of this epistatic model and the fre- quency-dependent model, with the two types of fit- nesses combined multiplicatively.Cline shape: We have seen that the maximum gra- dient of a single locus cline under weak selection is proportional to d&. When selection is increased, the
diffusion approximation breaks down and the cline
steepens (Figure 2A) because second order terms in s
become important. As expected from the arguments
above, dominance steepens the clines because the
diversity of phenotypes decreases.
An example of a simulated tension zone involving three loci is shown in Figure 3. T h e shape of each cline in a multilocus hybrid zone is also affected by the number of loci involved. As before, the maximum
slope increases linearly with at low selection
pressures (Figure 2, B and C). At high selection pres- sures, the approximation breaks down, and the slope increases even more steeply than for a single locus.
-30 -20 -10 0 10 20 30 0.5
E 1
I
-20 .10 0 10 30
D (ABC)
U
$ -0.01
4.02
-30 -20 -10 0
-
30n
I
Demes
FIGURE 3.-Simulated three-locus tension zone consisting of one
codominant locus ( A ) and two completely dominant loci ( B , C). Such a hybrid zone occurs in Heliconius (MALLET and BARTON
1989). The clines are stabilized by frequency-dependent selection,
2s = 0.5 per locus, and migration, u2 = 15 demes per generation. The figure shows variation along a demic continuum of all the parameters needed to reconstruct the genotypic distributions. Only the central section of the simulation is shown out of a total of 150 demes modeled. T h e simulation has been running for 250 genera- tions since contact between fixed populations, has stabilized in shape and is moving to the left at a constant speed of -0.20 demes (-0.051 dispersal distances, u) per generation. At lower selection pressures such a zone would separate into a stationary A cline and a pair of rapidly moving clines, B and C . Top to bottom: gene frequencies; two-way disequilibria, R,; three-way disequilibrium
DAB(; (defined as in SLATKIN 1972); and heterozygote deficits, F,,,.
This is partly due to second order terms in the mul- tiplicative fitnesses; in addition, gametic correlations (“linkage disequilibria”) are generated both by the selection model, and by migration (see below). These disequilibria tend to steepen the cline still further because selection on one locus will act on associated
loci (SLATKIN 1975; BARTON 1983). This explanation
972 J. Mallet and N . Barton
TABLE 1
Effect of removing disequilibria at meiosis
u X Max. (dpldx) Speedlo Max. R Max. F Min. F
Three loci, normal:
A 0.550 0.053 ABIAC 0.604 A 0.315 A 0.000
B,C 0.597 BC 0.620 B,C 0.394 B,C -0.079
Mean 0.591 Mean 0.609 Mean 0.368
A 0.410 0.059 ABIAC 0.278 A 0.190 A 0.000
B,C 0.488 BC 0.325 B,C 0.345 B,C -0.085
Mean 0.462 Mean 0.293 Mean 0.294
0.260 0.000 0.075 0.000
Three loci, disequilibrium removed:
One locus, codominant:
One locus, dominant:
0.337 0.083 0.283 -0.103
Results of simulations of three- and one-locus tension zones with 2s = 0.75 and u’ = 30, using the standard order of processes:
reproduction-migration-selection. In the three-locus results, A is codominant, B and C are completely dominant, as in Figure 3.
they still remain steeper than in the equivalent single locus clines (Table 1); the remainder of the increase in slope is due to the non-additive epistasis inherent in multiplicative fitnesses and to the disequilibria pro- duced by migration within each generation. In the center of multilocus hybrid zones, disequilibria cause loci to be selected as though they were a linked block, leading to a sharp step in gene frequency; at the edges, each locus is selected on its own, giving long tails of introgression on either side of the central step. This will also be true at low s, provided there are many loci. Here, the effect is only appreciable at high s because the small number of unlinked loci are other- wise “weakly coupled” (see BARTON 1983).
As in Figure 1, dominant clines are asymmetric with long tails of recessive alleles on the side of the cline
where dominants are most common (Figure 3). Due
to disequilibria with dominant loci, codominant clines in mixed tension zones also become slightly asymmet- ric (Figure 3). Alone, they are completely symmetrical (Figure 1).
Cline movement: Clines maintained by heterozy- gous disadvantage tend to move with constant speed
if one homozygote is fitter than another (BAZYKIN
1969; BARTON 1979); this applies also to the similar clines with frequency-dependent selection on codom- inant loci. In contrast, dominant clines move even in the absence of differential selection of phenotypes (Figures 3 and 4), because dominance introduces a
selective asymmetry on the genotypes (MALLET
1986a). This cline movement due to dominance is little affected by the numbers of dominant loci; how- ever, if one of the loci is codominant, the movement is considerably slowed. Clines differing in dominance tend to move apart below some critical s; at higher s, disequilibria and epistasis cause the clines to be at-
tracted together (Figures 3 and 4) (SLATKIN 1975).
For instance, where one codominant and two domi- nant loci interact in a tension zone, the critical 2s is
0.1 5
0.10 ‘0
Q)
0 )
n
0.05
0.00
0.0 0.5 1 .o
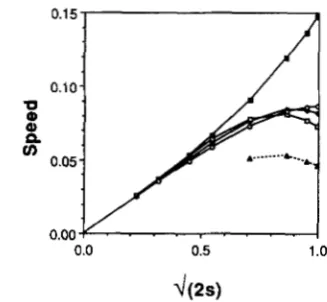
FIGURE 4.-Cline movement due to dominance. Curves show
movement speeds of tension zones (measured in units of dispersal distances, u , per generation) plotted against selection pressure,
m).
Open symbols and solid lines: circles, 1 dominant locus; diamonds, 2 dominant loci; squares, 3 dominant loci; triangles and dashed lines, 1 codominant and 2 dominant loci. All are for the standard order (reproduction-migration-selection) except for the upper curve (filled squares) which is for 3 dominant ge- with the order reproduction-selection-migration. Cline movement due to advantage of one of the homozygotes also shows an approximately linear dependence on o& (BARTON 1979).between 0.4 and 0.5. We do not analyse here cases of a selective difference between homozygotes [for a treatment applicable to codominant frequency-de-
pendence, see BARTON (1979)]; such movement like
that due to dominance, is at a speed approximately proportional to u
&
(Figure 4).Gametic correlations: Gene flow across a set of selected clines will produce correlations both within loci-heterozygote deficiencies, F-and between loci- linkage, or gametic, disequilibria, measured by the
correlation coefficient R (BARTON 1982, 1983; Szy-
Frequency-Dependent Selection
1 .o 1 .o 1 .o
-
5
i;
I 0.5 0.5
a
B
=
0.5U
m
(A
0.0
0.0 0.5 1.0 0.0 0.5 1.0 0.0 0.5 1.0
0.0 0.0
2s
FIGURE 5.-Disequilibria. The maximum gametic correlation R
is plotted against the per locus selection pressure 2s. Lines represent
values from simulations; all loci dominant (open squares), all loci
codominant (closed squares), mean disequilibria when 1 locus is
codominant, and 2 others are completely dominant (dashed lines in
center graph). Dotted lines represent predictions based on Equation
9 and the actual d p / d x produced in the simulations (Figure 2). Left,
2 loci; center, 3 loci, using the standard order (reproduction-
migration-selection); right, 3 loci using the order reproduction-
selection-migration.
Thus the strength of natural selection in a hybrid zone can be measured simply by comparing the disequili- brium in the center of the zone with that produced in models of a particular selective process.
With a number of loci under weak selection and with no epistasis, the disequilibrium produced will be:
(BARTON 1982, 1983) where TAB is the recombination
rate between loci A and B. With low s, the maximum gradient is
-
k
m,
and so disequilibrium should peak in the center of two identical clines, where:Simulations show that disequilibria do peak in the centers of clines (Figure 3), and depend almost linearly on selection pressure (Figure 5). When some loci are codominant and others are completely dominant, the average disequilibria are intermediate between the case where all loci are dominant and the case where all are codominant (Figure 5 ) , as might be expected. T h e frequency-dependent selection used here causes a higher constant of proportionality than expected from Equation 9b ( i e . , RAB/s
>
4 k 2 / r A B ) . This is fortwo reasons. Multiplicative fitnesses generate some nonadditive epistasis, which causes extra disequilibria. Adding more loci then increases the disequilibrium further, because the additional selection imposed by more disequilibria reduces cline widths.
Theory predicts that higher order disequilibria will
also be produced in multilocus clines (BARTON 1983).
For instance, third order disequilibria change from
1
0.5
I
0.0 0.5 1.0 0.0 0.5 1.0 0.0 0.5 1.0
2s
FIGURE 6.-Heterozygote deficit. The maximum heterozygote
deficit F is plotted against 2s. Dominant loci, open symbols; codom-
inant loci, closed symbols. Left, 1 locus; center, 2 loci; right, 3 loci;
dashed line indicates 1 codominant and 2 dominant loci. The
standard order (reproduction-migration-selection) is plotted in square symbols; the order reproduction-selection-migration is plot- ted in circles.
zero to positive values, switch to negative values, and then back to zero as we move across the clines (Figure
3), as expected (BARTON 1982).
Positive correlations between alleles within a locus are also expected because of gene flow. However,
since Hardy-Weinberg equilibrium (Fls = 0) results
after one round of random mating, within-locus cor- relations, F,,,, are not expected to equilibrate at as high a level in the center of a cline as between-locus correlations, R ; simulations confirm this (Figure 6).
Selection itself may cause deviations from Hardy- Weinberg. This is especially true for dominant loci. As we have already seen, a long tail of recessive alleles is produced in the edge of the cline where the reces- sives are rare. Here, recessive homozygotes will be produced from a large reservoir of heterozygotes, but they will be strongly selected against, producing a
negative FlS. By a similar argument, we expect selec-
tion to produce a positive Fly in the other tail, where
dominant phenotypes are rare, adding to that pro-
duced by gene flow. T h e effect of selection on F,,s is thus expected to be much lower on codominant loci than on dominant loci. In the simulations, F,, is about three times as large in dominant clines than it is in
codominant clines (Figure 3 and 6). In comparison,
K
(Figure 5) differs less than twofold between simula- tions with codominant and dominant loci, about as expected on the basis of differences in slope alone (Figure 2).
Epistasis: T h e assumption of multiplicative fit- nesses implies that selection acts independently on each locus. In nature, color patterns under frequency-
dependent selection may often be produced by epi-
statically interacting loci: for example, in Heliconius
warning patterns (SHEPPARD et al. 1985; MALLET
974 J. Mallet and N. Barton
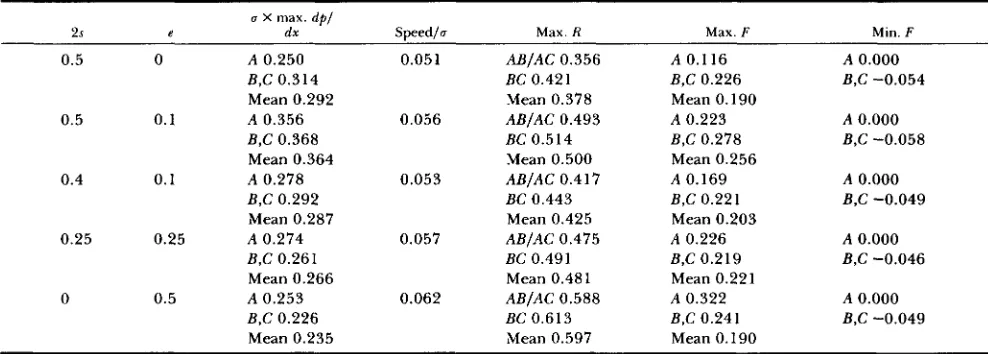
TABLE 2
Effect of varying proportions of epistasis (e) and frequency-depemdence (29)
a X max. d p l
2s e ds Speedlo Max. R Max. F Min. F
0.5 0 A 0.250 0.051 ABIAC 0.356 A 0.116 A 0.000
B,C 0.314 BC 0.42 1 B,C 0.226 B,C -0.054
Mean 0.292 Mean 0.378 Mean 0.190
B,C 0.368 BC 0.514 B,C 0.278 B,C -0.058
Mean 0.364 Mean 0.500 Mean 0.256
0.5 0.1 A 0.356 0.056 ABIAC 0.493 A 0.223 A 0.000
0.4 0.1 A 0.278 0.053 ABIAC 0.417 A 0.169 A 0.000
B,C 0.292 BC 0.443 B,C 0.221 B,C -0.049
Mean 0.287 Mean 0.425 Mean 0.203
0.25 0.25 A 0.274 0.057 ABIAC 0.475 A 0.226 A 0.000
B,C 0.261 BC 0.491 B,C 0.219 B,C -0.046
Mean 0.266 Mean 0.48 1 Mean 0.221
B,C 0.226 BC 0.613 B,C 0.241 B,C -0.049
Mean 0.235 Mean 0.597 Mean 0.190
0 0.5 A 0.253 0.062 ABIAC 0.588 A 0.322 A 0.000
Results of simulations of three-locus tension zones with u2 = 30, using the standard order of processes: reproduction-migration-selection.
Locus A is codominant, loci B and C are completely dominant, as in Figure 3.
be stabilized by such epistasis alone (BAZYKIN 1973), and we here model one such case.
Table 2 shows the effect of varying combinations
of epistasic and frequency-dependent selection on a three-locus tension zone. If the clines are maintained purely by epistasis (2s = 0, e = 0.5), the shape and speed are little different from the pure frequency- dependent model (2s = 0.5, e = 0). T h e heterozygous deficit F is increased for codominant loci because the simple phenotype model of epistasis used here implies heterozygous disadvantage at codominant loci; domi- nant loci have similar F across models. Because epis- tasis favors particular gene combinations, disequilibria are strongly affected; purely epistatic selection causes correlations, R, in the center of the zone to increase by about 60% over those produced in a purely phe- notypic model. However, if only a small proportion of the selection is due to epistasis (for example 2s =
0.5, e = 0.1, compared with 2s = 0.5, e = 0) the disequilibria are less strongly affected.
This analysis is somewhat crude because 2s and e
are not really equivalent. However, Table 2 shows in a general way that large amounts of epistasis will lead to an overestimate of selection if disequilibria in a natural tension zone were assumed to result solely from frequency-dependent selection. With these res- ervations, it seems that the differences in the estimates will usually be less than twofold [see also BARTON (1983), p. 4641.
Order of processes: The order of processes makes no difference at low s. The order assumed thus far has been reproduction-migration-selection. If s is high
and the order is instead reproduction-selection-migra-
tion, the maximum gradients are reduced and become closer to the low s a~~proximations (Figure 2); the
speed is similar, but does not tail off at high s (Figure
4); disequilibria, R, are reduced and become closer to the small s approximation of equation 9 (Figure 5);
and within-locus correlations, F , are reduced also (Fig-
ure 6). Many of these effects result because selection
acts on genotypes in Hardy-Weinberg equilibrium, rather than on genotypes that have just been disturbed by migration. Additional effects are due to the partial reduction of disequilibrium by reproduction before selection. Because populations are nearer to linkage equilibrium, we expect that clines will not be attracted together as strongly. This prediction is borne out: for the model of Figure 3 and Table 2 under the order
reproduction-selection-migration, codominant and
dominant clines always separate for 2s 5 1, compared with clines under the standard order, in which the critical 2s
=
0.5.DISCUSSION
Linear frequency-dependent selection on codomi- nant genes produces, in the low selection limit, recur- sions that have the same form as those for heterozy- gote and disadvantage. Dominant clines are similar, but differ in that asymmetries of selection caused by the dominance produce an assymmetric cline. Domi- nant clines will also move, even in the absence of
phenotypic selective differences: codominant clines do not move unless there are such selective differences.
Clines can provide estimates of gene flow, u'l, and selection pressure, s, which do not require direct field
measures (BARTON 1982; SZYMURA and BARTON
1986). For biologically possible values (2s I l), these estimates will be correct to within a factor of -2,
whatever the exact form of selection. However, clines
Frequency-Dependent Selection
mosomes strongly affect phenotypes, and presumably fitness [e.g., Heliconius (MALLET 1986a, 1989; MAL- LET and BARTON 1989), Bombus (OWEN and
PLOWRICHT 1980), and birds (GILL 1973, 1980)l. T o analyze tension zones, we will therefore often need to extend the weak selection theory, as is attempted here. These extensions are problematical because, whereas a number of models collapse into a single model at lows s, as we increase s the order of processes as well as other assumptions begin to matter. (Whether fitness differences at such strongly selected loci were built up
gradually is not at issue here: provided r E 0.01 or
less, intragenic recombinants are selected out more rapidly than they are produced by recombination in tension zones, so that they can be ignored for the purposes of inference).
Analytical theory is most useful if the order is reproduction-selection-migration. This might be par- tially true if the organism dispersed throughout its life, and selection occurred relatively early on. T h e
abolition of F and reduction of R by mating and
recombination just before selection make loci virtually
independent for low numbers of unlinked loci. If
there are many loci scattered around the genome the average r would be greatly reduced'and disequilibria become important, requiring a different analysis (BAR-
On the other hand, in many species a burst of
migration is followed by a relatively sedentary period during which selection is likely to occur. Then migra- tion mainly precedes selection and the increasing de- viations from Hardy-Weinberg under stronger selec- tion cause narrower clines which in turn create stronger deviation from Hardy-Weinberg: this causes a strongly curvilinear relation between
4
and maxi- mum gradient. This effect is magnified still further as the number of loci is increased because of a similar feedback effect on disequilibria (Figure2).
Under this order of processes simulations will be required to estimate u2 and s accurately from the cline data.T o make inferences about selection and gene flow
we need measurements of at least two parameters
from tension zones. T h e simplest feature to measure is width, defined l/max. (dpldx). This gives the ratio u/&(Figure 2). One further measurement will fix the absolute values of each parameter. One possibility is to use heterozygote disadvantage F . However, F de- pends strongly on details of the model. F is more responsive to selection on dominant genes; unfortu- nately, heterozygote frequencies required for estimat- ing F will usually be difficult to measure unless a locus is codominant in an alternative biochemical test, for example. T h e F at codominantly selected loci are much lower, and will be hard to detect, even for relatively high levels of selection (see Figure 6 and
LEWONTIN and COCKERHAM 1959). However, meas-
TON 1983).
urements of F will be the only way to make inferences
from single locus clines (e.g. MALLET 1986a).
Correlations between loci, R , equilibrate at a higher
level than F because they are only partly broken down
by recombination in each generation, will thus be easier to measure, and can give an efficient means of estimating the absolute value of s (Figure 5). Higher order disequilibria (Figure 3) could also be used, but require greater sample sizes for accurate estimation.
Finally, it should be borne in mind that the selection inferred by this means depends on a one parameter model of frequency-dependent selection. Consider
warning color: among the actual parameters of im-
portance are likely to be the epistasis between loci affecting the phenotype, the unpalatability of the apo- sematic species, relative numbers of predators and aposematic prey, one or more learning parameters of the predators, and the availability of alternative foods. T h e value of s that is inferred will give a good idea of the strength of selection, but not its exact nature. For reasonably large data sets, the accuracy of these esti- mates will be limited by uncertainties as to the model
rather than by sampling error. Nonetheless, these
measures are likely to be very useful given the inac- curacy of most other information on evolution: at the very least they can confirm the results of field exper- iments.
We thank the Natural Environmental Research Council for
financial support, and N. SANDERSON, M. SLATKIN and an anony-
mous reviewer for comments on the manuscript.
LITERATURE CITED
BARTON, N. H., 1979 The dynamics o f hybrid zones. Heredity
BARTON, N. H., 1982 The structure o f the hybrid zone in Uro-
BARTON, N. H., 1983 Multilocus clines. Evolution 37: 454-471.
BARTON, N. H., and B. CHARLESWORTH, 1984 Genetic revolu-
tions, founder effects, and speciation. Annu. Rev. Ecol. Syst.
BARTON, N. H., and G. M. HEWITT. 1985 Analysis o f hybrid
BAZYKIN, A. D., 1969 Hypothetical mechanism of speciation. Ev-
BAZYKIN, A. D., 1973 Population genetic analysis o f disruptive
and stabilizing selection. Part 11. Systems o f adjacent popula-
tions within a continuous area. Genetika 9: 156-166.
BROWN, K. S., 1979 Ecologza Geograjca e Evoluccio nas Florestas
Neotropicais. Universidade Estadual de Campinas, Campinas, Brazil.
BROWN, K. S., P. M. SHEPPARD and J. R. G. TURNER,
1974 Quaternary refugia in tropical America: evidence from
race formation in Heliconius butterflies. Proc. Roy. SOC. Lond.
B 187: 369-378.
ENDLER, J. A., 1977 Geographic Variation, Speciation and Clines.
Princeton University Press, Princeton, N.J.
ENDLER, J. A., 1988 Frequency-dependent selection, crypsis, and
aposematism. Phil. Trans. R . SOC. Lond. B 3 1 9 459-472.
FISHER, R. A., 1950 Gene frequencies in a cline determined by
selection and diffusion. Biometrics 6: 353-361.
GILBERT, L. E., and J. T. SMXLEY, 1978 Determinants of local
43: 341-359.
derma bilobatum. Evolution 3 6 863-866.
15: 133-164.
zones. Annu. Rev. Ecol. Syst. 16: 113-148.
976 J. Mallet and N. Barton
diversity in phytophagous insects: host specialists in tropical environments, pp. 89-104 in Diversity oflnsect Faunas, edited by L. A. MOUND and N. WALOFF. Blackwell, Oxford.
GILL, F. B., 1973 Intra-island variation in the mascarene white- eye Zosterops borbonica. Ornithol. Monogr. 12: 1-66.
winged and golden-winged warblers. Auk 97: 1-18.
284.
GILL, F. B., 1980 Historical aspects of hybridization between blue-
HALDANE, J. B. S., 1948 The theory of a cline. J. Genet. 48: 277-
H E W I ~ , G. M., 1988 Hybrid zones-Natural laboratories for evolutionary studies. Trends Ecol. Evol. 3: 158-167.
JOHNSON, M. S., J. MURRAY and B. CLARKE. 1987 Independence of genetic subdivision and variation for coil in Partula sutaralis.
Heredity 58: 307-3 13.
KIMURA, M., A N D G. H. WEISS, 1964 The stepping stone model of population structure and the decrease of genetic correlation with distance. Genetics 49: 561-576.
LANDE, R., 1982 Rapid origin of sexual isolation and character divergence in a cline. Evolution 3 6 213-223.
LANDE, R., 1985 The fixation of chromosomal rearrangements in a subdivided population with local extinction and recoloni- zation. Heredity 5 4 323-332.
LEVIN, B. R., 1988 Frequency-dependent selection in bacterial populations. Phil. Trans. R. SOC. Lond. B. 319: 459-472. LEWONTIN, R. C., and C. C. COCKERHAM, 1959 The goodness-of-
fit test for detecting natural selection in random-mating popu- lations. Evolution 13: 561-564.
MALLET, J., 1984 Population Structure and Evolution in Heliconius
Butterflies. Ph.D. Dissertation, The University of Texas at Austin.
MALLET, J., 1986a Hybrid zones of Heliconius butterflies in Pan- ama and the stability and movement of warning colour clines. Heredity 5 6 191-202.
MALLET, J., 1986b Gregarious roosting and home range in Heli- conius butterflies. Natl. Geogr. Res. 2: 198-215.
MALLET, J., 1986c Dispersal and gene flow in a butterfly with home range behavior Heliconius erato (Lepidoptera: Nymphal- idae). Oecologia 68: 2 10-2 17.
MALLET, J., 1989 The genetics of warning colour in hybrid zones of Heliconius erato and H . melpomene. Proc. R. SOC. Lond. B. 236: 163-185.
MALLET, J., and N. H. BARTON, 1989 Strong natural selection in a warning color hybrid zone. Evolution 43: 421-431.
MALLET, T . J., and M. C. SINGER, 1987 Individual selection, kin selection, and the shifting balance in the evolution of warning colours: the evidence from butterflies. Biol. J. Linn. SOC. 32: 337-350.
MANI, G. S., 1985 Evolution of resistance in the presence of two insecticides. Genetics 109: 761-783.
MAY, R. M., J. A. ENDLER, and R. E. MCMURTRIE, 1975 Gene frequency clines in the presence of selection opposed by gene flow. Am. Nat. 1 0 9 659-676.
MCLAIN, D. K., 1988 Male mating preferences and assortative mating in the soldier beetle. Evolution 42: 729-735.
MOORE, W. S., 1979 A single locus mass-action model of assorta- tive mating, with comments on the process of speciation. He- redity 42: 173-186.
MOORE, W. S., 1987 Random mating in the Northern Flicker hybrid zone: implications for the evolution of bright and con- trasting plumage patterns in birds. Evolution 41: 539-546. NAGYLAKI, T., 1975 Conditions for the existence of clines. Ge-
netics 8 0 595-615.
OWEN, R. E., A N D R. C. PLOWRIGHT, 1980 Abdominal pile color dimorphism in the bumble bee, Bombus melanopygus. J. Hered. 71: 241-247.
ROUHANI, S., and N. H. BARTON, 1987 Speciation and the “shift- ing balance” in a continuous population. Theor. Pop. Biol. 31: 465-492.
SHEPPARD, P. M . , J. R. G . TURNER, K. S. BROWN, W. W. BENSON, and M. C. SINGER, 1985 Genetics and the evolution of muel- lerian mimicry in Heliconius butterflies. Phil. Trans. R. SOC. Lond. B. 308: 433-613.
SLATKIN, M., 1972 On treating the chromosome as the unit of selection. Genetics 72: 157-168.
SLATKIN, M., 1973 Gene flow and selection in a cline. Genetics 75: 733-756.
SLATKIN, M., 1975 Gene flow and selection in a two-locus system. Genetics 81: 209-222.
SLATKIN, M., 1981 Fixation probabilities and fixation times in a subdivided population. Evolution 35: 477-488.
SZYMURA,J. M., AND N. H. BARTON, 1986 Genetic analysis of a hybrid zone between the fire-bellied toads, Bombina bombina
and E . variegata, near Cracow in Southern Poland. Evolution 40: 1141-1159.
WALSH, J. B., 1982 Rate of accumulation of reproductive isolation by chromosome rearrangements. Am. Nat. 1 2 0 510-532. WRIGHT, S . , 1932 The roles of mutation, inbreeding, crossbreed-
ing, and selection in evolution. Proc. VIth Int. Congr. Genet. 1: 356-366.
WRIGHT, S., 1969 Evolution and the Genetics of Populations. Vol.
2. The Theory of Gene Frequencies. University of Chicago Press, Chicago.
WRIGHT, S., 1980 Genic and organismic selection. Evolution 34: 825-843.
WRIGHT, S., 1982 Character change, speciation, and the higher taxa. Evolution 36: 427-443.
![FIGURE The lines represent all domi- (C) 2 dominant loci is also plotted. The low dominant genes (J[s/S], upper dotted line), and codom- inant genes (J[s/12], lower dotted line) are also shown in each mations nant (open squares), and all codominant (fill](https://thumb-us.123doks.com/thumbv2/123dok_us/1736560.1222059/5.594.305.543.58.437/figure-represent-dominant-plotted-dominant-mations-squares-codominant.webp)