INTEGRATION AND EXPRESSION OF DIFFERENT LENGTHS OF DNA DURING THE TRANSFORMATION O F PNEUMOCOCCUS
T O ERYTHROMYCIN RESISTANCE1
Department of Biology, University of Rochester, Rochester, New York
Received May 18, 1962
RANSFORMATION in bacteria has provided us with a means by which Tmutations in genetically determinative molecules of deoxyribonucleic acid (DNA) can be ordered or mapped, and in recent years this has bcen attempted both in pneumococcus (LACKS and HOTCHKISS 1960; ROTHEIM and RAVIN 1961) and in Bacillus subtilis (EPHRATI-ELIZUR, SRINIVASAN and ZAMENHOF 1961 ;
ANAGNOSTOPOULUS and CRAWFORD 1961). The mapping of DNA molecules is subject to certain uncertainties (LACKS and HOTCHKISS 1960; RAVIN and IYER
1961, 1962; EPHRATI-ELIZUR, SRINIVASAN and ZAMENHOF 1961), for it is based on the frequency with which recombinant classes of transformed bacteria are observed; the recovery of these recombinants depends not only upon the use of appropriate selective techniques, but also upon the successful completion of a series of stages in the host bacterium that has made an effective contact with a transforming DNA molecule. The outcome of mixing a transformable popula- tion of bacteria with transforming DNA depends on ( a ) the irreversible fixation of the DNA by the bacterium, (b) the integration of the specificity of part of the donor DNA molecule into the genome of the recipient or its progeny and (c) the expression of the phenotype determined by such an integration. Thus, the fre- quency of intramolecular recombination will depend on the susceptibility of each of these stages to the intracellular environment of the host.
I n an earlier report on linked transformations of pneumococci to erythromycin resistance (RAVIN and IYER 1961), certain anomalies were reported. It was noted that in the transformation of sensitive pneumococci by transforming prepara- tions bearing linked mutations, the frequency of occurrence of the multiply- marked transformants could be greater than one of the singly marked ones. Subsequent studies have confirmed these findings and have also revealed that the ratios of the transformant classes obtained in such experiments are considerably influenced by the state of the recipient cell population. Similar observations have been made in the transformation of pneumococci to sulfonamide resistance by
1 T h e research described in this article was made possible by a grant awarded by the
Present address: Microbiology Research Institute, Canada Department of Agriculture, National Institute for Allergy and Infectious Disease.
Ottawa, Canada.
1356 V. N. I Y E R A N D A. W. R A V I N
HOTCHKISS and EVANS (1958) whose findings suggested that the size of the genetic region integrated in transformation was affected by metabolic factors a3d also that there was a direct relationship between the competence (ability to be transformed) of a culture and the size of the region integrated. The present study examines the influence of the intracellular environment of the host in determining the magnitude of the region to be integrated from the transforming molecule. More specifically we ask: are the intercellular conditions influencing the magnitude of an integrated region identical to those that determine the com- petence of a population? We are next concerned with the events that follow integration. Specifically: can intracellular conditions influence the postinte- grative expression of a transformant? Is the rate of expression of the transfom- ant influenced by the magnitude of the genetic region integrated?
M A T E R I A L S A N D M E T H O D S
The capsule-deficient Rx strain of pneumococcus served as the recipient in all experiments described in this paper. The donor transforming DNA was prepared from each of the following erythromycin-resistant mutant strains derived from strain Rx or from strains bearing combinations of these mutations: ery-7-2, ery-73, ery-r5, e7-y-1-6, and ery-r7. The origin of these strains and the methods used in preparing transforming DNA and culture media have been previously described in detail (RAVIN and IYER 1961).
The transformation procedure consisted first in securing a population of recipi- ent cells which had developed the competence to transform. Rx cells from an
exponentially growing culture were inoculated into Medium 3 of EPHRUSSI-
TAYLOR (1951 ) supplemented with 0.2 percent beef serum albumin to yield ap- proximately l o 5 colony-forming units per ml and incubated at 37°C. At 15 minute intervals during a phase when they were judged to be developing compe- tence, aliquots of the culture were withdrawn and frozen immediately in a
glycerol medium at -80°C (Fox and HOTCHKISS 1957; RAVIN and IYER 1961). Batches of competent cells frozen in this manner retained their competence for several months. To be transformed, a frozen batch of cells was thawed in the cold and diluted tenfold in Medium 3 plus 0.2 percent beef serum albumin to which was added a saturating concentration of the transforming DNA. The mix- ture was held for 15 minutes at 32°C and, as a rule, the reaction terminated by the addition of M g + + activated pancreatic DNase. Following the addition of DNase, the transformed cells were allowed to express their phenotype in the liquid medium at 37°C before being challenged on antibiotic containing agar. The chal- lenging concentration of antibiotic was always less than that to which the strain was maximally resistant. After acquisition of any one of the mutations ery-rZ,
-7-3, -7-5. or -r6, the period required for all transformants to develop resistance to
E F F I C I E N C Y O F I N T E G R A T I O N 1357 at the same rate as do untransformed cells in the medium in which expression occurs.
Other experimental details are described where relevant in the following section.
RESULTS
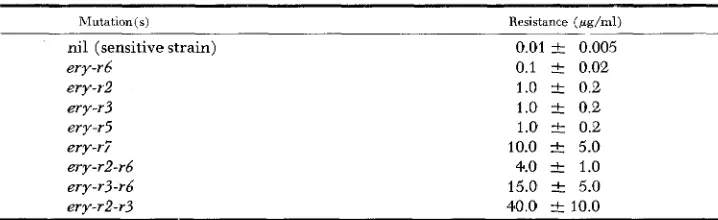
Resistance of strains bearing ery-r nutations: Table 1 shows the level of resist- ance to erythromycin of the ‘parent’ Rx strain and strains bearing one or more of the ery-r mutations. The level of resistance is defined here as the maximum concentration of antibiotic which, in solid medium, permits the growth of as many colonies as a medium lacking antibiotic. This maximum concentration is readily determined by spreading from 1 O2 to 1
o3
cells on the surface of media containing increasing concentrations of erythromycin. The strains bearing two mutations were as a rule obtained by treating the less resistant strain with DNA prepared from the more resistant strain. Recognition of two or more specific mutations in a strain is based not only on the distinctive resistance level which possession of a combination of mutations may confer, but also on the ability of DNA prepared from the strain to transfer the mutations singly and in combination to the parental sensitive strain ( RAVIN and IYER 1961 ).
Transformation of the sensitive strain b y D N A bearing each of the ery-r muta- tions: The frequency of transformation of the sensitive strain to a level of resist- ance characteristic of the mutated donor strain was determined in the following type of experiment. Aliquots of sensitive cells drawn from a single competent batch were exposed under identical conditions to individual transforming DNAs each bearing a different ery-r mutation and, in addition, a n unlinked strepto- mycin-resistance mutation, str-rl, which served as a reference marker. Following exposure, all potential transformants were allowed to express their resistance before being challenged with the antibiotics. A comparison of the ratio of erythro- mycin-resistant to streptomycin-resistant transformants obtained i n each case
TABLE 1
Resistance to erythromycin of strains bearing different ery-r
mutations or combinations of these mutations
illutation(s)
nil (sensitive strain)
ery-r0 ery-r2
my-r3 ery-r5
ery-ri ery-rZ-rb ery-r?-rd ery-r2-r3
Resistance (gg/ml)
0.01 t 0.005 0.1 2 0.02 1.0 -c 0.2 1.0 2 0.2 1.0 rt 0.2 10.0 rt 5.0 4.0 f 1.0 15.0 rt 5.0 40.0 t 10.0
The estimate of variability indicated in the table expresses the highest and lowest levels of resistance that were
1358 V. N . I Y E R A N D A . W. R A V I N
provides a measure of the relative ability of each of the ery-r mutations to be integrated into the genome of the sensitive strain (Table 2 ) .
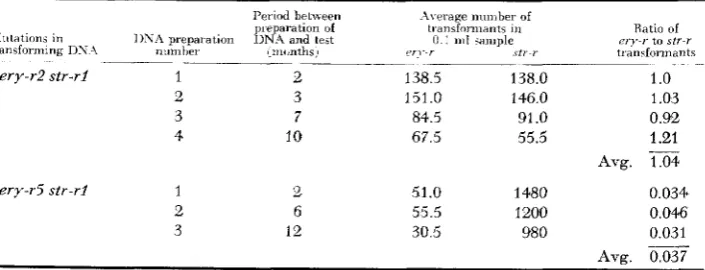
T h e variability in the ratio of erythromycin-resistant to streptomycin-resistant transformants is quite low when a single batch of competent cells is used to test a given transforming preparation (Table 2). In Table 3 are recorded the results of another experiment in which a different batch of competent cells was used. In addition, several DNA preparations subjected to different conditions of storage and handling were tested with aliquots drawn from this new batch of cells. It may be seen from a comparison of Tables 2 and 3 that: ( a ) the use of different DNA
preparations bearing the same ery-r and sir-r markers. although stored for differ- ent periods of time and probably otherwise affected in their quality, does not cause significant differences in the ratio of erythromycin-resistant to strepto- mycin-resistant transformants so long as the same batch of competent cells is used; ( b ) although this ratio is altered when different batches of recipient cells
TABLE 2
Relatiue frequency of transformation to erythronzyczn resistance of the Aensitiue strain b y
D N A bearing each of the ery-r mutations
I L i h o of the frequenry of ~ 7 , I
~i,m\friimants LO st1 , I Standard
\Intatinn tr'mafonnants de, lation
ery-r2 1.48 0.022
ery-rb 0.4 7 0.21
ery-r7 0.077 0.01
ery-r3 1.31 0.058
ery-r5 0.045 0.014
-2liquots of sensitive rells from a single ~ ( m i p e t e n t batch were s i n i u l t a n ~ n u i 1 ~ - exposed in quadruplicate ti) DN.1 preparations hearing each of the above er%*-r mutations and a standard s w r l mutation.
TABLE 3
Transformation of the sensitiue strain b y different D N A preparations all bearing an ery-r
mutation and the str-rl mutation but subjected to different periods of storage and handling
Ratio of e-ry-r to S t T - r
transfonnants
___ . ~ _ _ _ .____ _ ~ ~
ery-r2 str-ri 1 2 138.5 138.0 1
.o
2 3 151.0 146 0 1.03 3 7 84.5 91 .0 0.5%
4 10 67 5 55.5 1.21
Ayg.
ery-r5 str-ri 1 2 51.0 1480 0.034.
2 6 55.5 1200 0.046
3 12 30.5 980 0.031
Avg.
-
0.037EFFICIENCY O F I N T E G R A T I O N 1359 are used, the relative difference between two ery-r markers remains constant. Thus, by changing the batch of competent cells, the ratio of ery-r to str-rl trans- formants was changed to the same extent for the ery-7-2 and ery-r5 markers.
It is observed from Table 2 that the five ery-r mutations studied may, under similar conditions, yield different numbers of transformants, showing that they are integrated with different degrees of efficiency. The relative ability to be inte- grated can thus be determined by the nature of the mutation being transferred.
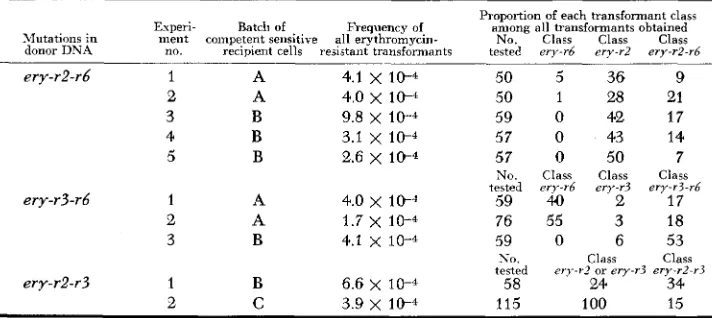
Transformation of t h sensitive strain by DNA bearing two linked mutations in the region ery-r2-r6-r3: Evidence for the close linkage of the mutations ery-r2, ery-r6 and ery-r3 has been presented earlier (RAVIN and IYER 1961). When the
sensitive strain was treated with DNA bearing the mutations ery-r2-r6 or ery-r3- rb, it was observed that the proportion of the doubly marked transformant class
ery-r2-r6 or ery-r3-r6 was often greater than the proportion of a transformant class bearing a single mutation. This observation has been confirmed and also extended to transforming DNA bearing the mutations ery-r2-r3. Table 4 shows the results of these experiments in which three different batches of sensitive cells were used. Examination of the results indicate the following: ( 1 ) in the different experiments using the same batch of recipient cells, the relative proportions of the various classes of transformants are generally quite similar from one experi- ment to the next; (2) a significant alteration in these ratios often occurs with the use of a different batch of recipient cells.
It should be pointed out that the relative proportion of the doubly marked
ery-r transformants recovered in a given experiment is not a reflection of different rates of expression for single and combined ery-r markers. As will be shown below (Tables 5-7). the rates of expression of these markers, individually or in com-
TABLE 4
Proportion of transformant classes arising from the transformation of sensitive cells b y D N A bearing two ery-r mutations
Proportion of each transformant class
Experi- Batch of Frequency of among all transformants obtained
Mutations in ment competent sensitive all erythromycin- No. Class Class Class
donor DNA no. recipient cells resistant transformants tested e n - r 6 erv-r2 ery-r2-r6
ery-rZ-rb 1 A 4.1
x
10-4 50 5 36 92 A 4.0
x
10-4 50 1 28 213 B 9.8 x 1 0 - 4 59 0 42 17
4 B 3.1 x 1 0 - 4 57 0 4'3 14
5 B 2.6 x 10⁻⁴ 57 0 50 7
No. Class Class Class
tested ery-rb ery-r? ery-r3-rb
59 40 2 17
2 A 1.7 x 10⁻⁴ 76 55 3 18
3 B 4.1 x 10⁻⁴ 59 0 6 53
ery-rZ-r3 1 B 6.6 x 10⁻⁴ 58 24 34
2 C 3.9 x 10⁻⁴ 115 100 15
ery-r3-r6 1 A 4.0 x 1 0 - 4
NO. Class Class
tested ery-r? or ery-r? ery-rZ-r3
1360 V . N . IYER A N D A. W. R A V I N
bination, are indistinguishable. The results in Table 4 demonstrate, therefore, that the integration of a pair of linked mutations from donor genetic material may, under certain conditions, be more efficient than the integration of a member of
the pair. If one adopts the reasonable assumption that integration of two closely linked markers involves a longer segment of donor genetic material than does
the integration of a single one of these markers (HOTCHKISS 1958), we may con- clude that integration of a long segment of genetic matcrial may be more efficient than that of a shorter segment. This conclusion is amply supported by the results
TABLE 5
Expression of transformants integraiing the mutations ery-r2, ery-r3 or ery-r2-r3 following the exposure of sensitiue cells' to D N A bearing the mutations ery-r2-r3 str-rl
Proportion of ery-rZ-r3 transIoormamts
Periml.irf Freqriency of Frrquency of among a l l e r y ~ r transformants
eupression i t r ~ r l a l l P q - 7 Noniber Number in
(mino Le\) tran\fornr;ints k m s f o n n a n t s tested cry-rl-r3 class
< I 3.4
x
IO-$ 2.3x
10-5 31 235 4.5
x
I P 4.3x
10-4 36 26 10 2.4x
1.6x
10-3 36 29 15 2.4x
1.5x
10-3 36 27* Sensitive cells used in this cxpcrirnent were from a p n p l a t l o n capable of eypressing antibiotic-resistance rapidly.
TABLE 6
Expression of transformants integrating the mutations ery-re, ery-r6 or ery-r2-r6 following the exposure of sensitiue cellsf to D N A bearing the mutations ery-r2-r6 str-rl
~~~
Proportion of tlrc three transformant
Ppriod of Frequency Frequency classes among all cr.v-r transformants
expression of str-rl of all e r p r Nunihrr Class Class Class
(nrinutcs) trsns€nrmnnti trim sforman ts tested ery-r2 ery-r6 er.yr2-rl
~~ - -.
< I 2.6 X 10⁻⁵ 5.3
x
10-6 71 11 2 58 2 1.1x
10-4 7.0x
10-5 . . 10 1.8 x 10⁻⁴ 1.2 x 10⁻⁴ . . . . 15 1.4 x 10⁻⁴ 2.3x
10-4 . .30 1.4 X 10⁻⁴ 2.4 x 10⁻⁴ 64 I 2 1 51
* Sensitive cells uscd in this experiment were from a population capable of expressing antibiotic-resistance rapidly.
TABLE 7
Expression of transformants integrating the mutations ery-1-3, ery-r6 or ery-r3-r6 following the exposure of sensitiue cells to DATA bearing the mutations eryr3-1-6 str-rl
Proportion o€ the thrce transformant
Period j>f Frequency Frequency classes among all e r y r transfonnants
expression of str-rl of all ery-r Nuniber Class Class Class
(minutes) trnnsforniarlts transformants tested ery-r3 ery-rh cry-r?-rb
10 1.1 x 10⁻⁴ 3.4 x 10⁻⁶ 11 5 2 4
45 3.0 x 10⁻⁴ 3.7
x
I@* 15 1.1x
10-4 4 1 x 10-630 3 4 x 1 0 - * 7.9 x 10⁻⁵ 47 22 10 15
E F F I C I E N C Y O F I N T E G R A T I O N 1361
of three-factor crosses (RAVIN and IYER 1961, 1962) in which double- and even triple-marker integration occurs more frequently than integration of the medially located marker.
The results show, moreover, that the integration of mutated regions from a donor molecule is not exclusively determined by the nature of those regions. The physiology of the recipient cell can play a decisive role in determining the length of the genetic region to be integrated in transformation.
Although it may be expected to have some influence on the relative frequency of transfer of linked markers, the quality of the DNA preparation appears to play a minor role, if any, under the conditions of our experiments. Different preparations of DNA bearing the same markers, but produced by similar methods, were used in some experiments involving the same batch of competent cells (for example, in Table 4, experiments 3 , 4 , and 5 involving the ery-r2-r6 mark- ers) ; no significant difference in the distribution of the recombinant classes was noted.
DijjCerentiation of t h host conditions determining frequency of transformation from those determining the length of the genetic region integrated: The physi- ological state which determines the ability of a cell to be transformed is termed competence. For any given transforming DNA, differences in the frequency of transformation of a recipient population may therefore be attributed to differences in the competence of the population. The question to be resolved is whether the cellular factors that determine competence (i.e. the total ability to be trans- formed) also determine the length of the genetic region to be integrated from the donor molecule. The results presented in Table 4 suggest no such relationship; that is, the degree of competence of a population does not appear to be associated with an altered probability of integration of a larger region of the donor molecule. This conclusion has been verified as follows. Aliquots of a growing population of sensitive cells were frozen at different stages of growth corresponding to differ- ent degrees of competence. Each aliquot was thawed in the cold and exposed separately to a DNA preparation bearing the linked mutations ery-rZ-r3 and the unlinked str-rl mutation. Transformants were quantitatively detected on media containing concentrations of antibiotic that permitted the growth of all classes of transformants. The proportion of doubly-marked ery-r2-r3 transformants among the total erythromycin-resistant transformants was next determined. This was done by transferring to antibiotic-free agar a large sample of the transform- ants originally selected, and then distinguishing the ery-r2-r3 transformants by their characteristic higher resistance upon velvet replication (LEDERBERG and
LEDERBERG 1952) to plates containing an increasing concentration of erythro- mycin.
1362 V. N. IYER A N D A . W. RAVIN
frequency-of e transformants
0-
-
-0$:
frequency of transformants , I \
,
* _ _ _ _ _ _ _ _ A
number of all colonies per ml.
proportion of [ e r v - r 2 - r ~ : e r H l transformants
2.5 3.0 3.5 4.0 4.5 5.0
hours of incubation a t 37"
C.
FIGURE 1 .-Transformation of populations of erythromycin-sensitive pneumococci by DNA
ery-r2-r3 str-rl. Indicated i n the boxes are the proportions of ery-r2-r3 transformants among all
ery-r transformants produced in populations a t different stages of growth and competence.
determine competence are, therefore, not identical with those determining the magnitude of the genetic region integrated. In fact, thc conditions that determine the length of the region to be integrated operate over arl appreciably longer period than those conditions that determine competence.
E F F I C I E N C Y O F IN T E GR A T IO N 1363
I n subsequent experiments using diff crent batches of sensitive recipient cells, it was observed that expression could occur much earlier than one hour (com- pare Tables 5 and 6 with Table 7 ) . This implies that the expression of a trans- formant can be influenced by the state of the recipient cells. Furthermore, the factor or factors contributing to this state do not specifically influence the mole- cule bearing the ery-r mutations, as can be Seen from the fact that the expression of the unlinked str-r marker is likewise influenced.
We observe that the ability of a cell population to express the transformed character relatively early or late is rather stable, for it persists through several serial transfers involving many cell generations. It is therefore likely that such states have some genetic basis. Notwithstanding these variations in the specific period required for expression, the distinctive nature of the mutation ery-r7 is preserved, because when aliquots from any single batch of sensitive cells are simultaneously but separately transformed by DNAs bearing different ery-r
mutations, the expression of ery-r-7 is consistently and significantly slower than that of all the other ery-r mutations. Thus, the postintegrative expression of a transformant is detennined both by the recipient as well as by certain qualities
of the region that is integrated.
The expression of resistance following the integration of regions of different
length: When the sensitive strain of pneumococcus is transformed by DNA bear- ing any two linked mutations in the region ery-r2-rb-r3, one may recover trans- formants that bear either one of the single mutations or transformants that bear both linked mutations. A useful question that one might ask is whether the ex- pression of transformants bearing both linked mutations, and therefore a longer integrated region of the molecule, is slower than the expression of transformants bearing a smaller component region. To determine this, a competent batch of sensitive cells was exposed to transforming DNA bearing the mutations ery-r2- 7-3 str-rl. At various periods after exposure, the population was challenged with a low concentration of erythromycin permitting the development of all trans- formant classes. As is to be expected, the total number of transformants that could be recovered on the erythromycin agar increased with increasing periods of expression until all transformants had expressed themselves. Transformant colonies obtained at various intervals during the period of incomplete expression and after complete expression had occurred, were next examined for the propor- tion of doubly marked (ery-r2-r3) transformants among them. This was accom- plished by regrowing a sample of the colonies in the absence of the antibiotic and testing their resistance by velvet replication ( LEDERBERG and LEDERBERG 1952).
1354 V. N. IYER A N D A . W. R A V I N
the mutations ery-r2-r6 str-rl or ery-r3-r6 str-rl. The proportion of all three transformant classes remains unaltered during different stages of expression (Tables 6 and 7 ) . It m a y be concluded from these findings that the expression of resistnnce following the integration of one or more mutated sites in the region
ery-r2-r6-r3 is independent of the magnitude of the integrated region. This fur- ther suggests that the delayed expression observed in the case of ery-r7. a muta- tion linked to ery-rZ-rl-rS and presumably located in the same molecule. may be due to some quality of this mutated region other than size.
DISCUSSION
It is now known that in a n y population of transformable pneumococci. every COCCUS possesses the potential ability to be transformed under suitable conditions
(RAVIN 1954; SCHAEFFER 1957). At a n y one time, however, it is only a fraction of the population that is susceptible to transformation and the term competence has been historically used in a relative sense to connote the ability of a population to undergo transformation to a particular genetic characteristic under suitable conditions. HOTCHKISS (1954) and THOMAS (1955) have shown that competence is a physiological property of the cell that arises during a particular period of growth and division, persisting for only a fraction of the generation time of the cell. Subsequently, Fox (1957) and LERMAN and TOLMACH (1957) found a simple proportionality, independent of several experimental variables, betu een trans- formation frequency and irreversible Pq2 uptake. The latter also noted that in the presence of a constant amount of labeled pneumococcal DNA and varying amounts of unlabeled calf thymus or E. coli DNA, while pneumococcal trans- formation is reduced, the ratio of P s L uptake to tramformation frequency is preserved. On the basis of these observations, it was suggested (LERivxw and
TOLMACH 1957) that the term competence might appropriately be applied to the capacity of a cell to bind DNA and it has been used on occasion to denote this specific ability ( EPHRUSSI-TAYLOR 1958).
However, in more recent studies, both on pneumococcus ( L E R X ~ N and
TOLMACH 1959) and on Bacillus subtilis (YOUNG and SPIZIZEN 1961) significant deviations from proportionality between P?? uptake and transformation frequency have been observed,, suggesting that the uptake of DNA is not the sole process determining transformation frequency. These observations are not altogether unexpected. It would indeed have been surprising if a strict invariant proportion- ality between DNA uptake and transformation frequency to a n y observed char- acter had been observed under all conditions. After all, during transformation the uptake of DNA is followed by processes (integration and expression), each of which is susceptible to variation and capable. therefore, of influencing a popu- lation’s competence, as broadly defined.
EFFICIENCY O F I N T E G R A T I O N 1365 of the genetic region which the recipient genome is able to integrate from the donor molecule. Unlike the ability to take up DNA, this condition persists for several generations. This condition, moreover, appears to be physiological in nature, for it varies considerably, but in a nonprogressive way with time, in batches of recipient cells prepared on different occasions from the same strain. These different occasions may differ with respect to small, uncontrolled changes in medium composition, rate of freezing the cells, etc. At the present time, we have no tested explanation for these physiological variations affecting the relative length of the donor DNA molecule that can be integrated.
Integration of the specificity of part of the donor DNA molecule appears to be depe-dent also upon the nature of the region to be integrated. This conclusion is supported by the quite different efficiencies with which the different ery-r
markers are integrated into recipient cells of an identical state of competence. A thirtyfold difference in the ability to be integrated exists between the ery-r2
marker, at one extreme, and the ery-r5 marker, at the other (Table 2). It is possible that these different efficiencies of integration reflect the size of the muta- tion, for it is believed that in transformation, as a rule, long lengths of genetic material are less easily integrated than shorter lengths (HOTCHKISS 1958). The experimental evidence in support of this belief is reasonable and is drawn both from studies on the relative integration of multisite mutations and smaller muta- tions with which they are allelic (LACKS and MOTCHKISS 1960) and from numer-
ous observations that the frequency of transformants acquiring two linked muta- tions is usually less than the frequency of transformants acquiring either one of the linked mutations (HOTCHKISS and EVANS 1958; BRYAN 1961; GOODGAL 1961; NESTER and LEDERBERG 1961 ; EPHRATI-ELIZUR, SRINIVASAN and ZAMENHOF 1961). The work of LACKS and HOTCHKISS (1960) also has drawn on physical evidence in support of this contention. The possibility should not be overlooked however. that the particular nucleotide composition of a mutation, rather than its length alone, may determine the ease of its integration in transformation. Size is obviously got the sole factor determining the relative frequency of integration of a pair of closely linked mutations. When two ery-r markers are present on the same donor DNA molecule, the integration of the pair of them often occurs more frequently than one of the members of the pair (example: ery-rZ-r& in Table 4).
This may be due to the fact that, when the distance between two linked markers is shorter than the length of one of them, the integration of the pair may be rela- tively very frequent (RAVIN and IYER 1962). In any case, integration efficiency
should not be used, by itself, as a n index of the size of a given mutation. I n another paper (IYER 1962) it is shown that the expression of erythromycin- resistant transformants, following integration, occurs i n two stages: first, the development of the ability to withstand, but not to multiply in the presence of the antibiotic; second, the development of the ability to reproduce in the presence of the antibiotic. This result is similar to that observed by EPRRUSSI-TAYLOR
(1 958) with streptomycin resistance in pneumococci.
1366 V. N. IYER A N D A. W . R A V I N
on at least two factors. One of these is apparently the genetic constitution of the recipient population, for certain populations transmit in a stable fashion through clonal growth the ability to express resistance very rapidly. In such populations all of the transformants express the ability to multiply in the presence of ery- thromycin within ten to 15 minutes after contact with the transforming DNA (Tables 5 and 6 ) although in other populations such expression requires from 45 to 60 minutes (Table 7, and RAVIN and IYER 1961). We believe that a gene (or genes) controlling the rate of expression differentiates such populations, but it has been difficult to verify this view. It is likely, however, that whatever condi- tion is responsible for rapid expression, it is not specific since it affects expression of streptomycin resistance as well.
The other factor which affects expression is the nature of the mutation itself. The mutation ery-r7 requires a considerably longer period of time to express resistance than do any of the other ery-r markers. This obtains whether the host condition for rapid expression is present or not. The evidence suggests that it is not the size of the ery-7 mutation that is responsible for the slowness of its expres- sion. In the first place, the rate of expression appears to be largely independent of length in the ery-r2-r6-r3 mutated region. Secondly, studies on the genetic linkage of the five ery-r mutations reveal that ery-r7 is only loosely linked to the other four mutations which form a more tightly linked cluster (RAVIN and IYER
1962). Thus, it may be that ery-r7 belongs to a different cistron having a slightly different function in the production of the erythromycin-resistant phenotype. This different function may have an intrinsic rate of expression, slower than that of the adjacent cistron.
The totality of the results described in this paper stresses the importance of us-
ing controlled competent batches of recipient cells in the mapping of DNA mole- cules. Unless intramolecular recombination between mutations is followed within the same intracellular environment, interpretations drawn from the ob- served recombination frequencies are apt to be spurious.
SUMMARY
In the region of the DNA molecule controlling resistance to erythromycin, the efficiency of integration into the recipient genome depends on the nature of the mutated region being integrated. This efficiency is not clearly related to the length of the mutated regions, as long segments of the molecule are often more readily integrated than shorter, component segments. Physiological variations in the recipient cell do, however, have a significant influence on the length of the region to be integrated. These physiological variations are different in duration from those that control the ability of the pneumococcus to bind and take up trans- forming DNA.
EFFICIENCY O F INTEGRATION 1367 ent of length in o x closely linked cluster of mutations. In a n adjacent region, a mutation has a considerably slower rate of expression.
LITERATURE CITED
ANAGNOSTOPOULOS, C., and I. P. CRAWFORD, 1961 Transformation studies on the linkage of markers i n the tryptophane pathway in Bacillus subtilis. Proc. Natl. Acad. Sci. U.S. 47:
3 78-390.
BRYAN, B. E., 1961 Genetic modifiers of streptomycin resistance in pneumococcus. J. Bacteriol.
EPHRATI-ELIZUR, E., P. R. SRINIVASAN, and S. ZAMENHOF, 1961 Genetic analysis, by means of transformation, of histidine linkage groups in Bacillus subtilis. Proc. Natl. Acad. Sci. U S .
47: 5 6 6 3 .
Transformations allogenes du Pneumocoque. Exptl. Cell Res.
The mechanism of deoxyribonucleic acid-induced transformations Pp. 51-68. Recent
Fox, M. S., 1957 Deoxyribonucleic acid incorporation by transformed bacteria. Biochim.
Fox, M. S., and R. D. HOTCHKISS, 1957 Initiation of bacterial transformation. Nature 179:
GOODGAL, S., 1961
HOTCHKISS, R. D., 1954 82: 461-470.
EPHRUSSI-TAYLOR, H. E., 1951 2: 589-6087.
Progress in Microbiology. Edited by G. TUNEVALL. C. C Thomas. Springfield, 111.
Biophys. Acta 26: 83-85.
1322-1325.
Studies on transformation of Hemophilus influenzae. IV. Linked and unlinked transformations. J. Gen. Physiol. 45: 205-228.
Cyclical behavior i n pneumococcal growth and transformability OC-
casioned by environmental changes. P m . Natl. Acad. Sci. U.S. 40: 49-55.
Size limitations governing the incorporation of genetic material in bacterial trans- formations and other nonreciprocal recombinations. Symp. Soc. Exptl. Biol. 12 : 49-59:
Analysis of the complex sulfonamide resistance locus of Pneumococcus. Cold Spring Harbor Symp. Quant. Biol. 23: 85-97.
Application of the membrane filter for the quantitative study of transfor- mations with particular reference to phenotypic expression of a n erythromycin-resistance mutation. J. Bacteriol. 84: 326-330.
LACKS, S., and R. D. HOTCHKISS, 1960 A study of the genetic material determining a n enzyme activity in Pneumococcus. Biochim. Biophys. Acta 39: 508-518.
LEDERBERG, J., and E. M. LEDERBERG, 1952 Replica plating and indirect selection of bacterial mutants. J. Bacteriol. 63: 399406.
LERMAN, L. S., and L. J. TOLMACH, 1957 Genetic transformation. I. Cellular incorporation of DNA accompanying transformation in pneumococcus. Biochim. Biophys. Acta 26 : 68-82. Genetic transformation. 11. The significance of damage to the DNA molecule. Biochim. Biophys. Acta 33: 371-387.
Linkage of genetic units of Bacillus subtilis in DNA transformation. Proc. Natl. Acad. Sci. U.S. 47: 52-55.
A quantitative study of autogenic and allogenic transformations in pneumococcus. Exptl. Cell Res. 7: 58-82.
The genetic relationship and phenotypic expression of mutations endowing pneumococcus with resistance to erythromycin. J. Gen. Microbiol. 26 :
Genetic mapping of DNA: influence of the mutated configuration on the frequency of 1958
1958
HOTCHKISS, R. D., and A. H. EVANS, 1958
IYER, V. N., 1962
1959
NESTER, E. W., and J. LEDERBERG, 1961
RAVIN, A. W., 1954
RAVIN, A. W., and V. N. IYER, 1961
277-301. 1962
1368
ROTHEIM, M. B., and A. W. RAVIN, 1961 The mapping of genetic loci affecting streptomycin resistance in pneumococcus. Genetics 46: 1619-1634.
SCHAEFFER, P., 1957 Linhibition de la transformation comme moyen de mesure de la “competence” bacterienne. Compt. Rend. 245 : 451-453.
THOMAS, R., 1955 Recherches sur la cinetique des transformations bacteriennes. Biochim. Biophys. Acta 18: 467-481.
YOUNG, F. E., and J. SPIZIZEN, 1961 Physiological and genetic factors affecting transformation of Bacillus subtilis. J. Bacteriol. 81 : 823-829.