Tool Wear Study on Tin Coated Cutting
Inserts During CNC Turning Process
Lalit Patel
1, Harshit Dave
2Head of the Department, Department of Mechanical Engineering, Valia Polytechnic College, Ankleshwar, Gujarat, India1
Assistant Professor, Department of Mechanical Engineering, S. V. National Institute of Technology, Surat, Gujarat, India2
ABSTRACT: The present research paper is focused on the analysis of optimum cutting conditions to get lowest tool wear rate and tool flank wear in CNC turning of different grades of EN materials by Taguchi approach. The experimentation plan is designed using Taguchi‟s L 27 Orthogonal Arrays (OA). The experimental result analysis
showed that the optimum combination of various input factors as type of insert type, work piece material, spindle speed, feed and depth of cut. Analysis of variance (ANOVA) is used to analyse the influence of process parameters during machining. Further, the confirmation tests are conducted and the results are found to be within the confidence interval.In addition, SEM analysis is carried out to study the wear of tin coated cutting tools under varying process parameters.
KEYWORDS: Turning, Tool Wear Rate, Flank Wear, Design of Experiments. CVD Coating, PVD Coating, Optimization.
I.
I
NTRODUCTIONIndustries around the world continually strive for lower cost solutions with reduced lead time in order to maintain their competitiveness.It has long been recognized that conditions during cutting, such as feed rate, cutting speed and depth of cut, should be selected to optimize the economics of machining operations as assessed by productivity, total manufacturing cost per component or some other suitable criterion[1]. Regarding economic aspects, tool wear is the most important consideration in the cutting practice. Consequently tool wear prediction and tool substitution policy are regarded as important tasks in order to maximize tool performance and minimize cutting costs. The primary tool wear are classified as flank wear, crater wear and nose wear, are important wear which will affect the smoothness of the product, cost of operation and performance. During turning tool wear is caused by the normal load generated by interaction between tool work piece and tip [2].Tool wear depends on the tool, work piece material (physical, mechanical and chemical properties), tool geometry, cutting parameters, cutting fluid, etc. The geometry of the tool plays a big part in controlling wear. The geometry of the cutting tool must allow for chip removal in order to take the heat out with the chip [3]. This study intend to investigate the effect of insert geometries on cutting performance in terms of tool wear when machining of different grades of EN materials.
II. MATERIALS AND METHODS A. Machine Tool
CNC turning centre (Sprint 16 TC),Batliboi Ltd. is used to carry out the experiment with 7.5 kW(10 hp) spindle power, maximum spindle speed of 5000 rpm, feed range 0-5000 mm/min, Z axis stroke 325 mm and X axis stroke 125 mm. The CNC Machine used in experiments as shown in Figure1.
Figure 1. Experimental Setup
B. Process parameters for experiments with their Levels
Process parameters (control factors) are one of the most important factors for any experimental work. The process parameters in present case are selected based on various literature reviews. Then various cutting parameters are set based on selected inserts. The different levels for process parameters are shown in table 3 below.
Table 3 Levels for Process parameters
Level
Factors
A B C D E
Insert Work piece material Speed (m/min) Feed (mm/rev)
Depth of cut (mm)
1 CN1500 EN-8 100 0.15 0.5 2 CN8020 EN-31 125 0.2 1 3 CC1500 EN-36 150 0.25 1.5
III.EXPERIMENTAL PLAN AND PROCEDURE
Turning experiments are carried out on a CNC turning centre under dry cutting conditions.Lubrication is normally used in machining to prevent cutting at excessive high temperature. Basically, lower cutting temperature results in longer tool life of the cutting tool. But in the case of cutting tool inserts with TiN coating, the cutting tool insert will work better at high temperature. Dry cutting is better than wet cutting for TiN coating inserts under high speed cutting [6].
a) Tool Wear Rate
As the tool material used for the experimentation possesses different values of densities, the tool wear rate in terms of „change in volume‟ per unit time can be a better measure of the rate at which the different tools materials are eroded while machining takes place. Hence, the tool wear rate is calculated [10] as reduction in volume per unit time (mm3/min) so as to facilitate more accurate comparison of the TWR for different tool materials under varying process conditions.
W -Wi f TWR =
(tm)(ρ) --- (1)
Where, Wi= Initial Weight of cutting insert in gm.
Wf = Final Weight of cutting insert in gm.
tm= Machining time in minute.
ρ = Density of the Tool material in gm/ cm3.
Here density for K20 and P30 cutting tool materials are 14.8 gm/cm3 and 11.4 gm/cm3 respectively [11]. b) Study of different modes of wear
Flank and crater wear are the most important measured forms of tool wear. The flank wear in these experiments can be seen obviously when high speed turning applied.Generally speaking, flank wear is caused by friction between the flank face of the tool and the machined surfaces. Flank wear is generally attributed to rubbing of the tool with work piece at the interface, causing abrasive and/or adhesive wear at high temperatures. Abrasion is the main wear mechanism in flank wear [12].Researchers normally regard flank wear land width VB as the tool life criterion owing to its significant
influence on surface finish and dimensional accuracy of the machined part [13-14]. Crater wear occurs on the rake face of the tool. The crater wear affects the tool geometry. The most important factors influencing crater wear is temperature at the tool tip interface and the chemical affinity between tool and work piece materials. During machining, flow of chips on the rake face result in severe friction and thus leads to material removal, referred as crater wear. The abrasion is a mechanically activated form of wear, which depends upon on the material properties like hardness, carbides, marten site structure, etc. [12].BUE and irregular wear are often faced in machining stainless steels. At low cutting speed, the contact between work piece and flank of the tool was more and rubbing action continued for more time. The cutting zone temperature increases, this softens and decreases the strength of the BUE [15].
(a) Crater Wear (b) Flank Wear
Figure 3.Loading and Magnification of the insert by use of S-3400N Scanning Electron Microscope
As part of present study, Depth of flank wear VB has been measured using Scanning Electron Microscope
S-3400N.Flank wear is characterized by the average width VB. Tool damage on the rake face is characterized by the
maximum depth KT of the crater shown in figure 2 (a) and (b).Further, the wear trends for different combination of
input parameters in SEM are observed and discussed.
IV.EXPERIMENTAL DESIGN
The objective of Design of experiment is to determine the variables in a process that are the critical parameters and their target values. On the basis of selected parameters, experimental design is carried out.
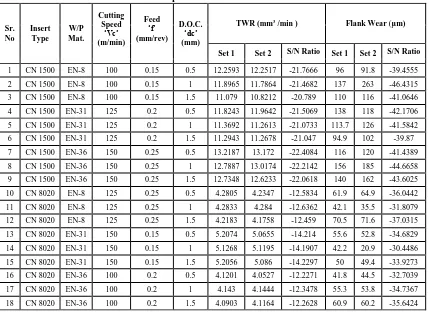
Table 4. Experimental results for L27 OA
Sr. No
Insert Type
W/P Mat.
Cutting Speed
‘Vc’ (m/min)
Feed ‘f’ (mm/rev)
D.O.C. ‘dc’ (mm)
TWR (mm3 /min ) Flank Wear (µm)
Set 1 Set 2 S/N Ratio Set 1 Set 2 S/N Ratio
1 CN 1500 EN-8 100 0.15 0.5 12.2593 12.2517 -21.7666 96 91.8 -39.4555
2 CN 1500 EN-8 100 0.15 1 11.8965 11.7864 -21.4682 137 263 -46.4315
3 CN 1500 EN-8 100 0.15 1.5 11.079 10.8212 -20.789 110 116 -41.0646
4 CN 1500 EN-31 125 0.2 0.5 11.8243 11.9642 -21.5069 138 118 -42.1706
5 CN 1500 EN-31 125 0.2 1 11.3692 11.2613 -21.0733 113.7 126 -41.5842
6 CN 1500 EN-31 125 0.2 1.5 11.2943 11.2678 -21.047 94.9 102 -39.87
7 CN 1500 EN-36 150 0.25 0.5 13.2187 13.172 -22.4084 116 120 -41.4389
8 CN 1500 EN-36 150 0.25 1 12.7887 13.0174 -22.2142 156 185 -44.6658
9 CN 1500 EN-36 150 0.25 1.5 12.7348 12.6233 -22.0618 140 162 -43.6025
10 CN 8020 EN-8 125 0.25 0.5 4.2805 4.2347 -12.5834 61.9 64.9 -36.0442
11 CN 8020 EN-8 125 0.25 1 4.2833 4.284 -12.6362 42.1 35.5 -31.8079
12 CN 8020 EN-8 125 0.25 1.5 4.2183 4.1758 -12.459 70.5 71.6 -37.0315
13 CN 8020 EN-31 150 0.15 0.5 5.2074 5.0655 -14.214 55.6 52.8 -34.6829
14 CN 8020 EN-31 150 0.15 1 5.1268 5.1195 -14.1907 42.2 20.9 -30.4486
The Taguchi experimental design is done for L27 OA for five parameters which are insert, material, speed, feed and
depth of cut. Table 4 shows complete design matrix with coded variables as well as actual value of this variable. V. EXPERIMENTAL RESULTS& DISSCUSSION
MINITAB statistical software has been used for the analysis of the experimental work. The MINITAB software studies the experimental data and then provides the calculated results of signal-to-noise ratio. In this work, the software has given the signal-to-noise ratio for both the tool wear rate and flank wear. The effect of different process parameters on tool wear rate and flank wear are calculated and plotted as the process parameters changes from one level to another. The average value of S/N ratios has been calculated to find out the effects of different parameters and as well as their levels. The use of both ANOVA (Analysis Of Variance) technique and S/N ratio approach makes it easy to analyse the results and hence, make it fast to reach on the conclusion [17].In turning operation, desired responses are minimum tool wear rate and minimum flank wear so, smaller the better “SB” ratio were selected. The S/N ratio for minimum responses type of characteristic can be calculated as follows [18].
η = −10 log
yu2Ni Ni
n=1
---(2)
Where y1, y2…, yn are the responses of the machining characteristics for a trial condition repeated for n times.
A. Tool Wear Rate
Figure 4. Shows the response diagram for tool wear rate. Tool wear rate is being smaller the better characteristics. From the response diagram it can be seen that an optimum combination of parameters is A2-B3-C2-D1-E1. It means that EN 36 gives minimum tool wear rate when machined by CN8020 tool at 125 m/min speed, 0.15 mm/rev feed and 0.5 mm depth of cut. It can be seen that PVD coated inserts are better for less tool wear rate and geometry point of view positive inserts are superior as compare to negative inserts for less TW. The tool wear rate greatly increases as the feed is increased. In case of cutting speed, it is clear that tool wear rate would less for medium and low speed. As speed is increased, tool wear rate would increase and tool wear rate is constant for different depth of cut. Also the graph shows that for minimum tool wear rate EN-36 material is preferable as compare to EN-8 and EN-31.
19 CC 1500 EN-8 150 0.2 0.5 6.6602 6.8289 -16.5798 71.4 77 -37.4143
20 CC 1500 EN-8 150 0.2 1 7.4668 7.3028 -17.3673 97.9 125 -41.0053
21 CC 1500 EN-8 150 0.2 1.5 7.7188 7.8717 -17.837 118 130 -41.8786
22 CC 1500 EN-31 100 0.25 0.5 7.0356 6.951 -16.8938 79.4 84.6 -38.2806
23 CC 1500 EN-31 100 0.25 1 7.5308 7.8059 -17.6954 95.3 104 -39.9778
24 CC 1500 EN-31 100 0.25 1.5 7.8427 7.9301 -17.9377 120 129 -41.9091
25 CC 1500 EN-36 125 0.15 0.5 5.3209 5.4096 -14.5921 109 137 -41.854
26 CC 1500 EN-36 125 0.15 1 5.6605 5.7772 -15.1467 131 144 -42.7757
C C 1500 C N8020 C N1500 -14 -16 -18 -20 -22 EN-36 EN-31
EN-8 100 125 150
0.25 0.20 0.15 -14 -16 -18 -20 -22 1.5 1.0 0.5 Insert M ea n of S N ra tio s
W /P Speed
Feed D.O .C
Main Effects Plot for SN ratios for TWR
Figure 4.Response Diagram for Tool Wear Rate
Table 5 shows that ANOVA for tool wear analysis it can be seen that insert is most significant parameter affecting tool wear rate with 94.58% significance. The significance of speed, depth of cut, feed and w/p material are found to be 3.32%, 0.04%, 0.48 and 1.57% respectively.
Table 5 ANOVA for tool wear rate analysis
Factors SS DF MS F %P
Insert 185.426 2 92.713 2352.039 94.58 w/p material 3.0777 2 1.539 39.039 1.57
Speed 6.507 2 3.253 82.536 3.32
Feed 0.948 2 0.474 12.027 0.48
D.O.C 0.0788 2 0.039 1 0.04
Total 196.037 10 98.01874 2486.642 100
B. Confirmation Tests for TWR
The confirmation experiment is the final step in verifying the conclusions drawn based on Taguchi‟s parameter design approach. The confirmation experiment is very important in parameter design, particularly when screening or small fractional factorial experiments are utilized [19].
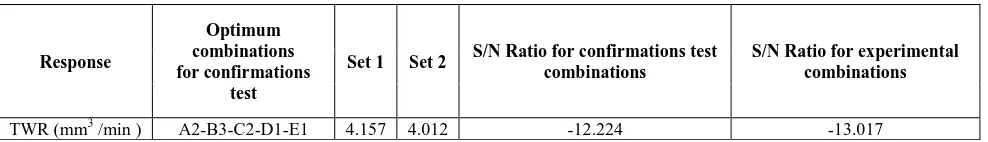
Table 6 Confirmation test for TWR
Response
Optimum combinations for confirmations
test
Set 1 Set 2 S/N Ratio for confirmations test combinations
S/N Ratio for experimental combinations
corresponded with the predicted values of average tool wear rate. The confirmation runs with optimum tool wear rate parameters (A2-B3-C2-D1-E1) resulted in tool wear rate values of 4.157 mm3 /min and 4.012 mm3 /min. Each tool wear rate measurement was repeated and S/N ratio for optimum tool wear rate (-12.224) has been obtained.
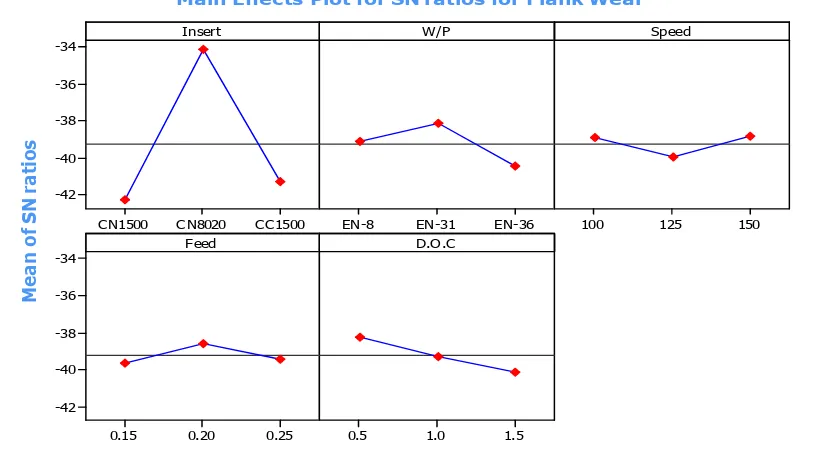
C. Flank Wear
Flank wear is being smaller the better characteristics. From the response diagram in figure 5 it can be seen that an optimum combination of parameters is A2-B2-C3-D2-E1.It means that EN 31 gives minimum flank wear when machined by CN8020 tool at 150 m/min speed, 0.20 mm/rev feed and 0.5 mm depth of cut. It can be seen that PVD coated inserts are better than CVD coated inserts for decrease in flank wear and for less flank wear of inserts, EN-31 materials are most preferable. In case of cutting speed, if cutting speed is low then flank wear would decrease and vice versa but after certain stages for the high value of speed again flank wear would decrease. Also the graph shows that at low value of feed, flank wear would decrease and when feed is increase flank wear would increase but again if feed is increased then flank wear would increase. For depth of cut, it can be seen that if depth of cut is increased then flank wear would increase.
CC1500 CN8020 CN1500 -34 -36 -38 -40 -42 EN-36 EN-31
EN-8 100 125 150
0.25 0.20 0.15 -34 -36 -38 -40 -42 1.5 1.0 0.5 Insert M e a n o f S N r a ti o s W/P Speed Feed D.O.C
Main Effects Plot for SN ratios for Flank Wear
Figure 5. Response Diagram for Flank Wear
Table 7 ANOVA for flank wear analysis
Factors SS DF MS F %P
Insert 197.019 2 98.510 59.659 86.96 W/p mat. 13.327 2 6.664 4.036 5.88
Speed 3.894 2 1.947 1.179 1.72
Feed 3.302 2 1.651 1 1.46
D.O.C 9.007 2 4.504 2.727 3.98
Table 7 shows that ANOVA for flank wear analysis it can be seen that insert is most significant parameter affecting flank wear with 86.96% significance. The significance of speed, feed, depth of cut, w/p material is found to be 1.72%, 1.46%,3.98% and 5.88% respectively.
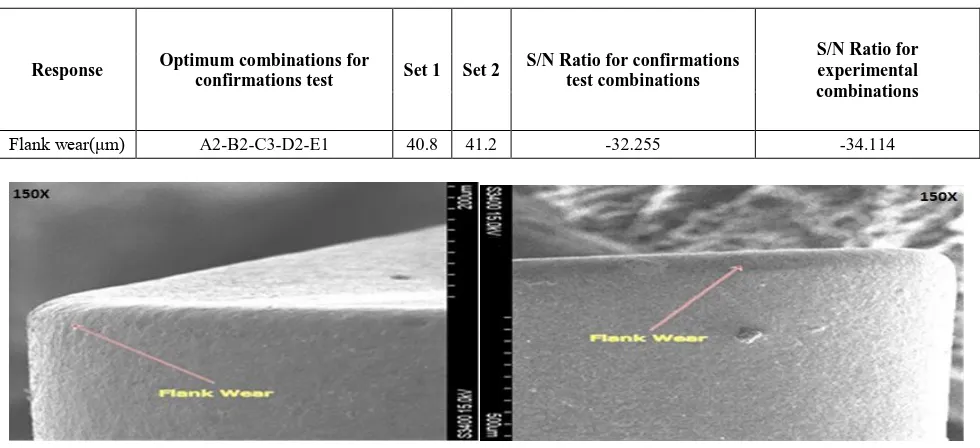
D. Confirmation Tests For Flank Wear
The confirmation runs with optimum flank wear parameters (A2-B2-C3-D2-E1) resulted in flank wear values of 40.8μm and 41.2μm. Each flank wear measurement was repeated and s/n ratio for optimum flank wear (-32.255) has been obtained.
Table 8 Confirmation Test for Flank Wear
Response Optimum combinations for
confirmations test Set 1 Set 2
S/N Ratio for confirmations test combinations
S/N Ratio for experimental combinations
Flank wear(μm) A2-B2-C3-D2-E1 40.8 41.2 -32.255 -34.114
Figure 6. SEM Photographs for flank wear during confirmation test
It can be seen that, the values of S/N ratios for all optimum combinations are higher as compare to experimental combinations of parameters. Hence, the experimental plan and conclusion are verified and acceptable. The above two SEM photographs shown in figure 6shows the minimum flank wear for the optimum confirmation test. The minimum flank wear was found during the test and the measured data for flank wear given in Table no. 8.
E. Tool wear conditions
Vc=125, f=0.20, doc=1 Vc=100, f=0.25, doc=1
Figure 7. Crater wear formation for EN-31 under 100X magnification
The crater wear is found in this experiment run when machining at 125 m/min cutting speed, 0.20 mm/rev feed, DOC 1mm for material EN 31 and insert CNMG 1500.Also the crater wear in this experiment is found when machining at 100 m/min cutting speed, 0.25 mm/rev feed, DOC 1mm for material EN 31 and insert CCMT 1500.
Here,
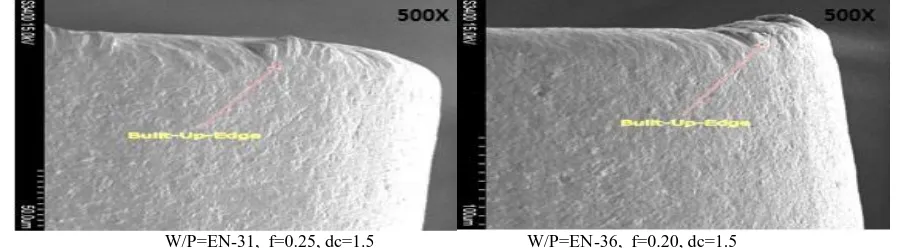
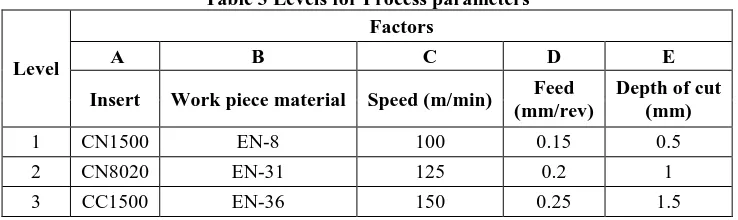
one remark is that the crater wear was not present at higher cutting speed.W/P=EN-31, f=0.25, dc=1.5 W/P=EN-36, f=0.20, dc=1.5
Figure 8. Built Up edge formation at cutting speed of 100 m/min
The BUE is formed at 100 m/min cutting speed, 0.25 mm/rev feed, DOC 1.5 mm for material EN 31 and insert CCMT 1500 and also one remark is that the flank wear was not present in this combination of parameters. The BUE is also formed at 100 m/min cutting speed, 0.20 mm/rev feed, DOC 0.5mm and at 100 m/min cutting speed, 0.20 mm/rev feed, DOC 1.5mm for material EN 36 and insert CNMG 8020.here also the flank wear was not present.
VI.CONCLUSION
Turning tests were performed on three different types of materials viz; EN-8, EN-31, EN-36 and three different types of TiN coated carbides cutting inserts CNMG 1500, CNMG 8020, CCMT1500 are experimentally investigated on CNC turning centre. It can be concluded from the results that for particular material and inserts different parameters make different relations with responses. Observing the wear trends in SEM, based on the SEM micrographs following conclusions have been observed:
2) Maximum tool wear rate 13.21 mm3 /min observed on CNMG 1500 insert at speed 150 m/min, feed 0.25 mm/rev and 0.5 mm depth of cut and also from results PVD coated inserts are better than CVD coated inserts for less too wear rate.
3) Negative type insert is better than positive type inserts for minimum tool wear rate.
4) Analysis of variance suggested the Cutting inserts has a most significant impact on flank wear and tool wear rate.
5) Crater wear is not found at higher cutting speed.
6) At low cutting speed of 100 m/min formation of built up edge is inevitable due to more contact time.
REFERENCES
[1]H.Ganesan, G.Mohankumar,K.Ganesan, K.Ramesh kumar , “Optimization of machining Parameters in turning process Using genetic algorithm and Particle swarm optimization With experimental Verification”, International Journal of Engineering Science and Technology, vol. 3,pp. 1091-1102, 2011.
[2]S. Thamizhmnaii, B. Bin Omar, S. Saparudin, S. Hasan, “Tool flank wear analyses on martensitic stainless steel by turning”, International Scientific Journal published monthly by the World Academy of Materials and Manufacturing Engineering, Vol. 32,Issue 1, pp.41-44,2008.
[3]Basim A. Khidhir and Bashir Mohamed, “Analysing the effect of cutting parameters on surface roughness and tool wear when machining nickel based hastelloy – 276”, IOP Conf. Series: Materials Science and Engineering , pp.17-23, 2011.
[4]Ajay P. Dhavan and M.T.Telsang,“optimization of cutting parameters in multipass turning using taguchi method”, International Journal of mechanical engineering and materials sciences, vol. 4,PP 39-46, 2011.
[5] Raviraj Shetty , R. Pai and S.S.Rao, “Experimental Studies on Turning of Discontinuously Reinforced Aluminium Composites under Dry, Oil Water Emulsion and Steam Lubricated Conditions Using TAGUCHI‟s Technique”, G.U. Journal of Science, vol. 22, pp. 21-32, 2009.
[6] Samir K. Khrais, Y.J. Lin,“Wear mechanisms and tool performance of TiAlN PVDcoated inserts during machining of AISI 4140 steel” , Wear 262, pp.64–69, 2008.
[7] R.S .Arora, Hand book of mechanical engineering,Academic (INDIA) Publishers, New Delhi, pp. 361-364, 2010. [8] Taegu Tec‟s Metal Working Turning Tools, Taegu Tec India Ltd, Bangalore, India, pp. B30-B120.
[9]Serope Kalpak Jain and Steven R. Schmid, “Manufacturing processes for Engineering Materials”, pp.459-460, 2009.
[10]Vinod Kumar and J.S.Khamba, “Parametric optimization of ultrasonic machining of co-based super alloy using the taguchi multi-objective approach”,German academic society for production engineering (WGP), Vol. 3, pp. 417-425, 2009.
[11]H M T, Production Technology, Tata McGraw-Hill Publishing Company Limited. New Delhi, Edition 33, pp. 37-38, 2004.
[12]S. Thamizhmnaii, B. Bin Omar, S. Saparudin, S. Hasan, “Tool flank wear analyses on martensitic stainless steel by turning”, International Scientific Journal published monthly by the World Academy of Materials and Manufacturing Engineering, Vol. 32, Issue 1, pp. 41-44, 2008. [13]Takatsu S., Shimoda, H., and Otani, K., “Effect of CBN content on the cutting performance of polycrystalline CBN tools”, Int. J. Refract. Met. Hard Mater, Vol.2, pp.175–178, 1983.
[14]Dewes, R. C. and Aspinwall, D. K, “The use of high speed machining for the manufacture of hardened steel dies”, Trans. NAMRI/SME, Vol.24, PP 21–26, 1996.
[15]S.Thamizhmanii and S.Hasan , “ Investigation of Surface Roughness and Flank Wear by CBN and PCBN Tools on Hard Cr-Mo Steel”, Proceedings of the World Congress on Engineering , London, U.K, Vol.1.pp. 722-728, 2009.
[16]Farouk Mahmood and Gautier List, “High speed turning for hard material with PCBN inserts: tool wear analysis”, Int. J. Machining and Machinability of Materials, Vol. 3, pp.62-78, 2008.
[17]Dave H. K, Patel L.S and Raval H. K.,“Effect of machining conditions on MRR and surface roughness during CNC Turning of different Materials Using TiN Coated Cutting Tools-A Taguchi approach”, International Journal of Industrial Engineering Computations 3, pp.925-930, 2012. [18]J.S.Senthilkumaar, P.Selvarani and R. M. Arunachalam, “Selection Of Machining Parameters Based On The Analysis Of Surface Roughness And Flank Wear In Finish Turning And Facing Of Inconel 718 Using Taguchi Technique”, Emirates Journal for Engineering Research, pp. 7-14, 2010.
![Figure 2. (a) And (b) Features of single- point wear in turning (ISO proposed standard)[16]](https://thumb-us.123doks.com/thumbv2/123dok_us/1667211.1209560/3.595.120.476.537.756/figure-features-single-point-wear-turning-proposed-standard.webp)