128 |
P a g e
SYNTHESIS AND CHARACTERIZATION OF
BACE
0.85
Y
0.15
O
3
SOLID OXIDE FUEL CELL
ELECTROLYTE BY CITRATE EDTA COMPLEXING
SOL-GEL PROCESS
Jampana Madhuri Sailaja
1, V.Veeraiah
21,2
Department of Physics, Andhra University, Vishakhapatnam,
Andhra Pradesh, (India)
ABSTRACT
This paper reports on the effect of Yttrium doping on BaCeO3 electrolyte prepared using the citrate-EDTA
complexing sol-gel process at temperature T=1000°C. The phase formation and evolution with the temperature
has been studied by X-ray diffraction (XRD), thermal analysis (TG-DTA).
The morphology of the sintered powder at T=1300°C are examined by
SEM - Scanning Electron Microscopy
FTIR - Fourier transforms infrared spectrometer
FTRS-Raman measurements
The crystallite size of the ceramic powders calculated from Scherrer equation is 32nm and the diffraction peak
shifted to higher angles. Microstructure of the sintered powder revealed that the average grain size is in the range of 2-3m. Dense ceramic materials were obtained at 1300°C and the relative density is 89% of the
theoretical density. FTIR and Raman measurements reveal the complete single phase formation of the
orthorhombic perovskite structure. The ionic conductivity of the pellet is investigated from room temperature to
400°C and is found to be 7.7x10⁻⁴S/cm (400°C). The conductivity increased as temperature increases and the
activation energies is 0.56eV and hence this composition is worth being electrolyte.
Keywords: Proton conducting electrolyte
,
BaCe
0.85Y
0.15O
3,
Sol-Gel synthesis, Fuel Cells, Raman
spectra.
I. INTRODUCTION
During the past few decades, Hydrogen has been identified as fuel in the fields of electric power generation and
transportation. It is arising as future renewable energy option due to increasing environment pollution aspects
[1-3].The aim is to synthesis a dense ceramic conductor with good chemical stability at high temperatures.
Recently SOFCs based on proton conducting electrolytes (SOFC-H+) have attracted much attention due to their
relatively low temperature operation (400-800°C) that aids in better sealing and interconnection of the materials,
129 |
P a g e
temperatures probe practical problems like excessive costs, material degradation, prolonged start up and shut offperiods [5,6].To solve these issues many researchers have developed various new electrolyte materials to reduce
the sintering and operating temperatures.
Perovskite–type oxides such as BaCeO3, BaZrO3, SrZrO3 and SrCeO3 are known to protonic conductors among
which BaCeO3 has highest protonic conductivity among them [7, 8].Generally, the ceramic electrolytes are
synthesized by means of solid-state reaction (SSR) method which involves extensive ball-milling, repetitive
grinding and high-temperature treatment (T=1,400°C).As a result, some impurities may instigate in the heat
treatment process which provokes into material degradation. To overcome the SSR complications, wet chemical
methods (WCMs) like sol–gel, hydrothermal, co-precipitation, [9-11] is espoused to obtain the desired
perovskite compound. With the help of these methods fine powder morphology with less contamination can be
procured. Sol-gel and Pechini method utilizes the features of both citric acid ðylenediaminetetra acetic acid
(EDTA) to form polybasic acid chelated with various metal cations [12-13]. Iwahara et al. [14] studied the effect
of ionic radii of dopants on mixed ionic conduction (H+ +O2_) in BaCe0.9M0.1O3-δ (M=Yb, Y, Dy, Gd, Sm, Nd)
and found that, as the ionic radius of the dopant increases, the spacing along the a-axis of these materials
becomes longer in approving of the increased combination of oxide ion to the total conduction. Therefore Y is
introduced in the B site to partially replace Ce ions in the present work and study the dependence of ionic
conductivity on lattice volume [16] of the perovskite.
II. EXPERIMENTAL
Powder preparation
The citrate-EDTA complexing sol-gel procedure is used for preparing BaCe 0.85Y0.15O3 oxide. The starting
materials for this process are commercial Ba(NO3)2, ZrO(NO3)2.2H2O, Ce(NO3)36H2O (High Media, 99.5%).
Both citric acid and EDTA are added to the precursor solution as chelating agents. The citric acid molar ratio
and EDTA to the total metal cations content was set at 1:2:1. The pH value of the solution was adjusted to be
around 6 using NH4OH. The mixed solutions were heated under stirring until obtaining viscous gels at
T=100°C. Additional heating at T=250°C evaporates residual water & organics, later these gels were
transformed into black powders. The synthesized powder is then calcined at T=1000°C for 12h with a heating
rate of 5°C/min. To obtain dense sample, the calcined powder is uniaxially pressed into cylindrical pellet under
5 ton pressures for 5min and then sintered in an air atmosphere. Sintering was carried out at T=1300°C for 5h at
a heating rate of 5°C /min.
III. CHARACTERIZATION
Thermo gravimetric analysis (TGA) are performed to the dried powder (T= 250°C) by a TA instrument model
SDT Q 600. The phase identification of the sintered oxides is performed with a powder Diffractometer
(PANalytical X-pert Pro) with Ni filtered Cu Ka radiation and the diffraction angle from 10° to 90° with a step
of 0.01°/min. Morphologies of the sintered pellet is examined using scanning electron microscope JEOL model
JSM-6610 LV in conjunction with an energy dispersion spectrometer (EDS) to find out the percentage of
130 |
P a g e
the FTIR spectra of BaCe0.85Y0.15O3 powder in the range of 4,000-400cm-1and in turn investigate the complexstructure, carbonates and oxides formation. The theoretical density of the powder is calculated with the obtained
XRD. FTRS-Fourier transforms Raman spectroscopy (BTC111-RAMAN-785) studies were conducted to study
the vibrational modes of the samples in the range 0-1000cm-1.LCR measurements from room temperature to
400°C were performed with Wayneker P6500 model in the frequency range from 20Hz to 1 MHz.
The crystallite sizes of the powder are calculated using Scherrer's formula Eq. 1:
cos
.
94
0
p
D
(1)
Where
Dp= Average crystallite size
Β =FWHM
θ =Bragg angle
λ = X-ray wavelength.
The bulk density of the sintered pellet is determined using Archimedes displacement method.
IV. RESULTS AND DISCUSSION
Thermogravimetry / Differential Thermal Analysis
To investigate the reaction of the perovskite phase structure formation, simultaneous TG-DTA curves of the
sample conducted from room temperature to 1200°C are presented in Fig.1.In terms of thermal stability nitrates
are unstable than carbonate and hence are easy to decompose.
From Fig.1 it can be seen that three regions are obtained in TG-DTA of the powder. The gradual weight loss is
18% up to 200°C and is due to absorption of water molecules. The additional weight loss along with exothermal
peaks in DTA reveals that the decomposition of gel takes place in two steps. The weight loss from 200°C to
500°C is found to be 21% accompanied with small exothermic peak at 418°C is due to combustion of the metal
nitrates. The drastic weight loss occurred from 500-630°C (25%) and the exothermic peak at T=573°C is due to
co-oxidation. A very small weight loss is observed at T >1000°C which is due to barium carbonate thermal
decomposition, also detected in XRD. TG curve displays a drastic weight loss starting at around 500°C with a
corresponding exothermic effect, which is related decomposition of BaCO3 and the formation of powder with
the release of CO2 [18-19]. This is consistent with the XRD results from the Fig.2 that BaCe 0.85Y0.15O3 phase
only forms upon calcining at 1000°C and above. There is no apparent weight change is depicted when the
131 |
P a g e
Fig. 1 TG-DTA curves of BaCe
0.85Y
0.15O
3powder preheated at 250
0
C for 24h.
V. X-ray DIFFRACTION (XRD) ANALYSIS
The phase compositions of BaCe 0.85Y0.15O3powder has been identified by X-ray diffraction (XRD) analysis.
The experimental diffraction pattern is collected at room temperature by step scanning at 0.01°/min over the
range 10°2 90°. As shown in Fig.2 sintered oxides are predominantly the perovskite dominant structure with five major diffraction signals (002), (022), (213), (611), and (422) planes (JCPDS Card no. 22-0074). The
XRD patterns of powders calcined at T=1000°C for 12 h showed a single orthorhombic phase Fig.2 with pnma
space group according to Knight et al. [18-22]. The cell parameters were determined by least-square refinements
and the calculated lattice parameters are found to be a=8.6998, b=6.2587, c=6.2339 and cell volume is
339.4323(Å) 3 with a relative density of 89%. It was reported that phase formation in BaCeO3 obtained from
solid state synthesis requires calcinations at 1100°C or 1200°C for 10h or more .Such high temperatures can
result in grain growth which causes decrease in surface area of the powder and sintered density. In the present
method of preparation, 1000°C is sufficient to form a single phase material by adjusting the pH to 6 which
liberates more protons from citric acid that helps to chelate Ba ions and enhance phase formation.
Close examination of the XRD data projects that as Yttrium is doped in the B sites the diffraction peak shifted to
higher angles and increase of the lattice parameters along with lattice volume is observed than BaCeO3
(experimental value 339.376 reported elsewhere), which suggests a plane distance reduction (according to
Bragg’s law).This can be well explained by the fact that Y3+
has a smaller ionic radius than Ce4+ [17].
The crystallite size is examined from XRD peaks based on the Scherrer equation, and the results showed that the
132 |
P a g e
Fig. 2 XRD patterns of calcined (1000
°C) and sintered BaCe
0.85Y
0.15O
3(1300
°C) oxides.
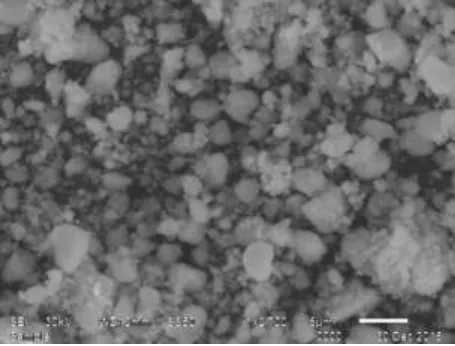
Fig.3. SEM morphologies of sintered (1300
0C/5h) BaCe
0.85Y
0.15O
3oxides.
VI. MICROSTRUCTURE
The surface morphology of the sintered powder is shown in the Fig.3 depicts a heterogeneous distribution of
grains with an average size in the range of 2-3m. This is consistent with the fact that the grain size decreases as the ionic radius of the dopant decreases. Dense ceramic materials were obtained at T=1300°Cand the relative
density is 81% of the theoretical density.
VII. FTIR - FOURIER TRANSFORMS INFRARED SPECTROSCOPY
FTIR spectrum of the sintered powder is shown in Fig.4. FTIR analysis is used to explain in further detail the
formation of the carbonate species during heat treatment. The high intense peak near 860cm-1may be due to the
=C-H bend. The peak localized in the range of 1436cm-1 is attributed to the C-H bend and which may be due to
the complex formed from a chealation process of chelating agents, carboxyl acids and metal ions [19-21].
133 |
P a g e
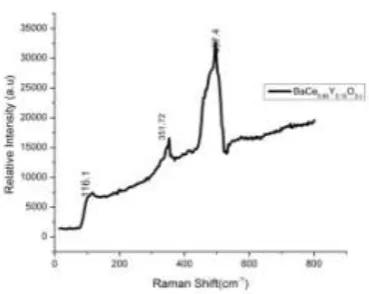
Raman spectra recorded at room temperature is shown in the Fig 5. Raman Spectroscopy can not only beconsidered as an important tool in measuring the degree of cation ordering but also used to study dynamic
changes in a structure. The small peak in the range 116 cm-1 might be assigned to the stretching mode of the
carbonate ion around the strontium ion. The Raman band around 352cm-1 is refers to O-B-O bending in ABO3
perovskites. A small band near 500cm-1 was attributed to torsional mode of the B-O bond of the B sites and
between 450-550cm-1 is CeO2 like peak[22,23].The small peak near 700cm-1 can be attributed to the symmetric
metal-oxygen stretching vibrations of the BO6 octahedra [24,25].Increase in ionic radius of the doped atoms
lead to a more distortion from orthorombhic strucrure with a corresponding decrease in raman active vibration
bands which results in a more symmetric structure confirming the phase structure remaning the same with the
introduction of yttrium into the structure.
Fig. 4. FTIR spectra of sintered
(1300
0C/5h) BaCe
0.85Y
0.15O
3oxides.
Fig. 5. Raman spectra of sintered
(1300
0C/5h)
BaCe
0.85Y
0.15O
3oxides.
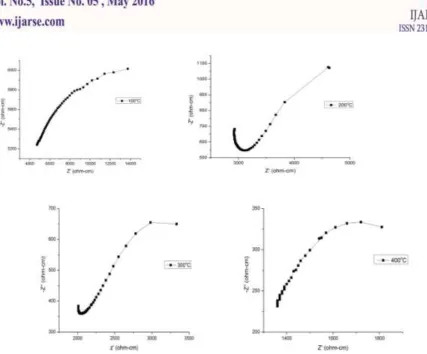
VIII. IMPEDANCE ANALYSIS
The impedance spectra measured in air from 200°C to 400°C in dry air is shown in the Fig.6.Theoritically the
spectra comprises of three arcs at high, medium and low frequencies, corresponding to the response of bulk,
grain boundary and the electrode respectively [26, 27] in the Nyquist plots (Z’ vs. Z’’).In the Nyquist plots of
the present work, the high frequency semi circle related to bulk response could not be seen due to the
instrumental limitations of the experimental range. Therefore, the bulk response is assigned to the high
134 |
P a g e
Fig 6 Nyquist plots at various temperature in air for sintered (1300°C) BaCe
0.85Y
0.15O
3oxides.
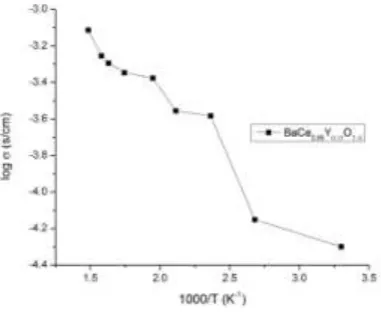
The Arrhenius plots were obtained from the conductivity data using the Arrhenius equation given in Eq. 2.
T
b
K
a
E
o
ac
exp
(2)
Where
σo is the pre-exponential factor
Ea is the activation energy
kB Boltzmann constant
T is the absolute temperature respectively.
In air atmosphere, the Arrhenius plot of the sample followed a linear trend from 200°C to 400°C as shown in the
Fig. 7. Here, the conductivity has a lower value with slightly higher activation energy in air when compared to
wet atmosphere as there is no presence of water for proton conduction mechanism to take place. The
conductivity valuesof BaCe0.85Y0.15O3 is found to be 7.4x10⁻⁴S/cm and the conductivity increased with increase
in temperature. The activation energy (0.56eV) is determined from the slope of the plot Logσ vs. 1000/T are
135 |
P a g e
Fig. 7. Arrhenius plot of conductivity in air for samples sintered at 1300
0C/5h BaCe
0.85
Y
0.15O
3oxides.
Fig 8.Dielectric constant vs frequency plot
of sintered (1300
0C/5h) BaCe
0.85Y
0.15O
3oxides.
Fig. 9. Variation of Dielectric constant with
Temperature of sintered (1300
0C/5h)
BaCe
0.85Y
0.15O
3oxide.
The variation of Dielectric constant with temperature (50°-400°C) and frequency (20Hz to 1MHz) is studied.
From the frequency dependent plot Fig.8 it is evident that the value of r decreases sharply as the frequency
increases .The higher values of dielectric constant at low frequencies can be affliated to space charge
polarization (power frequencies) which occurs due to pile up of charges at the interfaces between the sample and
the electrode. In low frequency regions the diploes will get sufficient time to orient themselves completely along
the field direction when the sample is subjected to an alternating field resulting in larger values of r of the
samples. As the frequency increases further, the dipoles in the samples cannot reorient themselves in pace to the
to the applied electric field but lags behind, resulting in the decrease in r of the samples up to 106 Hz.
From the plot of dielectric constant versus temperature Fig.9, it was proved that as temperature increased the
dielectric constant also increased. This can be explained as follows. In space charge polarization, the increase in
136 |
P a g e
activation barrier for the orientation of polar molecules in the direction of the field which increases the value ofr.
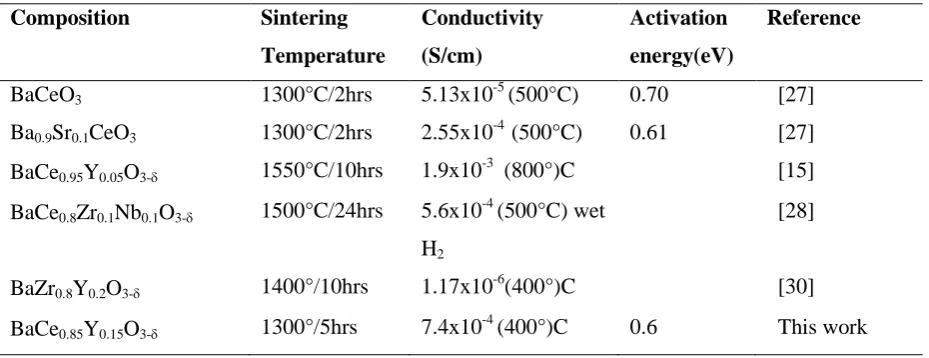
The conductivity and activation energy values determined in the present work with reference to other works are
listed in the Table 1.
Table 1
.
Conductivity and activation energies of various compositions.
Composition
Sintering
Temperature
Conductivity
(S/cm)
Activation
energy(eV)
Reference
BaCeO
31300°C/2hrs
5.13x10
-5
(500°C)
0.70
[27]
Ba
0.9Sr
0.1CeO
31300°C/2hrs
2.55x10
-4
(500°C)
0.61
[27]
BaCe
0.95Y
0.05O
3-1550°C/10hrs
1.9x10
-3
(800°)C
[15]
BaCe
0.8Zr
0.1Nb
0.1O
3-1500°C/24hrs
5.6x10
-4
(500°C) wet
H
2[28]
BaZr
0.8Y
0.2O
3-1400°/10hrs
1.17x10
-6
(400°)C
[30]
BaCe
0.85Y
0.15O
3-1300°/5hrs
7.4x10
-4
(400°)C
0.6
This work
IX. CONCLUSION
BaCe0.85Y0.15O3-has been successfully synthesized using the citrate-EDTA complexing sol-gel process at low
temperature as low as T=1000°C.The sample showed single phase orthorhombic structure with pmna space
group and is consistent with the standard JCPDF data. The crystallite size of the ceramic powders is calculated
from Scherrer equation and is found to be 32nm and the diffraction peaks shifted to higher angles.
Microstructure of the sintered powder revealed that the average grain size is in the range of 2-3m. Dense
ceramic materials were obtained at 1300°C and the relative density is 89% of the theoretical density. FTIR and
Raman measurements reveal the complete of the orthorhombic perovskite structure single phase formation.
The ionic conductivities of the pellet are investigated from room temperature to 400°C and is found to be
7.4x10⁻⁴ S/cm.The conductivity increased as temperature increases and the activation energies is 0.56eV .From
the results above it is proved that this method of preparation yields good electrolyte which exhibited enhanced
conductivity value at low sintering temperature with increased density. Further increase in sintering temperature
may increase the density but there is a chance of evaporation of Ba at high temperatures. Further research on
using of sintering aid to obtain dense samples without rise in sintering temperature along with trivalent dopants
is under process.
X. ACKNOWLEDGEMENTS
The authors wish to thank the Coordinator DST-Purse programme, Advanced Analytical laboratory, Andhra
137 |
P a g e
REFERENCES
[1] EP. Murray,T .Tsai, S.A .Barnett, A direct-methane fuel cell with a ceria-based anode, Nature 400 (1999)
649-51.
[2] S.H Chan, Hohk, Y.Tian, Multi-level modeling of sofc-gas turbine hybrid system, Int J.Hydrogen energy.
28 (2003) 899-900.
[3] S.M Haile, Fuel cell materials and components, Acta Mater. 51 (2003) 5981-6000.
[4] Siriwan Chokka SutinKuharuangrong, Effect of Sr and Y on microstructure and electrical conductivity of
BaCeO3, Songklanakarin J.Sci.Technol. 35(5) (2013) 557-561.
[5] K .Ie, R.Q Yanb, X.Q Liua, Stable BaCe0.7Ti0.1Y0.2O3- Proton conducting for solid oxide fuel cells, J
Alloys Compd. 479 (2009) 40-2.
[6] I.M Hung, H.W Peng, S.L Zheng, C.P Lin, J.S Wu, Phase stability and conductivity of Ba1 ySryCe1-xYxO3-d
solid oxide fuel cell electrolyte, J Power Sources. 193 (2009) 155-9.
[7] T.Takahashi, H.Iwahara, Proton Conduction in Perovskite type oxide solid solution, Solid State Ionics,
Rev. Chim. Miner. 17 (1980) 243-253.
[8] H .Iwahara, H .Uchida, K. Ono, K. Ogaki, Proton conduction in sintered oxides based on BaCeO3, J
Electro Chem Soc. 135 (1988) 529-33.
[9] M.M Amini,M. Mirzaee, Effect of solvent and temperature on the preparation of potassium niobate by
hydrothermal-assisted sol–gel processing, Ceram Int .35 (2009) 2367–2372.
[10] Boschini F, Rulmont A, Cloots R, Vertruyen B Rapid synthesis of submicron crystalline barium zirconate
BaZrO3 by precipitation in aqueous basic solution below 100°C,J EurCeram Soc. 29 (2009) 1457–1462.
[11] A.V.Orlov, O.A.Shlyakhtin,A, L.Vinokurov, A.V.Knotko,Yu.D.Tret Yakov, Preparation and properties of
fine BaCeO3 powders for low temperature sintering, Inorganic Materials.Vol 41 11(2005)1194-1200.
[12] K.Katahira, Y. Kohchi, T.Shimura, H.Iwahara Protonic conduction in Zr-substituted BaCeO3, Solid State
Ion. 138 (2000) 91–98.
[13] K. Kinoshita, E.J. Cairns, “Fuel Cells ”Encyclopedia of Chem. Technol. 11 (1994) 1098-1121.
[14] H. Iwahara, T.Yajima, H. Ushida, Effect of ionic radii of dopants on mixed ionic conduction (H++ O2_) in
BaCeO3 based electrolytes.Solid State Ionics 70-71 (1994)
[15] J. Guan, S .E. Dorries, U. Balachandran, M. Liu, Transport properties of BaCe0.95Y0.05O3- mixed
conductors for hydrogen separation, Solid State Ionics. 100 (1997) 45-72.
[16] A. F. Sammells, R.L.Cook, J.H. White, J.J.Osborne, R.C.MacDuff, Solid State Ionics 52 (1992) 111.
[17] Zhen Shi, Et.al. Samarium and Yttrium Codoped BaCeO3 proton conductor with improved sinterability
and higher Electrical Conductivity, Appl.Mater.Interfaces 6 (2014) 5175-5182.
[18] F. Deganello, G.Marci, G. Deganello. Citrate-nitrate auto combustion synthesis of perovskite-type
nanopowders: a systematic approach, J Eur Ceram Soc. (2009) 29 439e50.
[19] R.R Chien, C.S Tu, V. Hugo-Schmidt, S.C Lee, Huang CC. Synthesis and characterization of
proton-conducting Ba(Zr0.8_xCexY0.2)O2.9 ceramics, Solid State Ionics. (2010) 181 1251e7.
[20] F.Deganello, G.Marci, G.Deganello, Citrate-nitrate auto combustion synthesis of perovskite-type
138 |
P a g e
[21] Ding H, Xue X, BaZr0.1Ce0.7Y0.1Yb0.1O3_ electrolyte-based solid oxide fuel cells with cobalt-freePrBaFe2O5þd layered perovskite cathode, J Power Sources. 195 (2010) 7038e41.
[22] S.U.Dubai, A P.Jamale , C.H. Bhosale, L D.Jadhav, Proton conducting BaCe0.7Zr0.1Y0.2O2.9 thin films by
spray deposition for solid oxide fuel cell, Applied Surface Science 324 (2015) 871-876.
[23] Yuji okuyama, Kaori Isa, Young Sung Lee, Takaai Sakai, Incorporation and conduction of proton in
SrCe0.9-xZrxY0.1O3-, Solid State Ionics. 275 (2015) 35-38.
[24] H. Zheng, I.M. Reaney, G.D.C. Csete de Györgyfalva, R. Ubic, J. Yarwood, M.P. Seabra, VFerreira,
Raman spectroscopy of CaTiO3-based perovskite solid solutions, J. Mater. Res. 19 (2004) 488–495.
[25] HAOH, Study of A-site doping of SrBi4Ti4O15 Bi-layered compounds using micro -Raman
spectroscopy, Appl. Phys. A. 85 (2006) 69.
[26] A.S.Babu, Ranjit Bauri, Synthesis, phase stability and conduction behavior of rare earth and transition
metals doped barium cerates, International journal of hydrogen energy. 39 (2014) 14487-14495.
[27] K. CS Ouzaouit, A. Benlhachemi, H. Benyaich, J. P. Dallas, S. Villain, J. A. Musso, J. R. Gavarri,
Electrical conductivity of BaCeO3 synthesized by new sol-gel Method, M.J.Condensed Matter
Physics.Vol7 (2006) 6.
[28] B. Surinderjt Singh, T.Fursenhaupt, R.Paul, T. Venkatraman, Synthesis, Structure-chemical stability and
electrical properties of Nb-Zr and Nb codoped BaCeO3 perovskites, Inorganic Chemistry.50 (2001)
6493-6499.
[29] R.Vasudevan , Synthesis And characterization of BaCeYO3 and BaZrYO3 composites for solid oxide fuel
cell applications and microwave sintering of nanoceramics, shodhganga (2013)
http://hdl.handle.net/10603/24545.
[30] V.M. Jali, S. Aparna, Ganesh Sanjeev, S.B. Krupanidhi, Ac conductivity studies on the electron irradiated