Discussion on the Standardization of Shielding Materials –
Sensitivity Analysis of Material Compositions
Tomohiro Ogata1,*, Ken-ichi Kimura2, Mikihiro Nakata3, Koichi Okuno4, Takayuki Hirouchi5, Naofumi Kawano6, Koji
Oishi7,8, Ken-ichi Tanaka9, Toshio Amano10 and Yoshihiro Hirao11
1Mitsubishi Heavy Industries, Ltd., 1-1-1 Wadasakicho, Hyogo-ku, Kobe 652-8585, Japan 2Fujita Corporation, 2025-1 Ono, Atsugi 243-0125, Japan
3MHI Nuclear Solutions and Engineering Co., Ltd., 3-3-1 Minatomirai, Nishi-ku, Yokohama 220-8401, Japan 4HAZAMA ANDO Corp., 515-1 Karima, Tsukuba 305-0822, Japan
5Toshiba Corporation, 8 Shinsugitacho, Isogo-ku, Yokohama 235-8523, Japan 6Hitachi-GE Nuclear Energy, Ltd., 3-1-1 Saiwaicho, Hitachi 317-0073, Japan
7Japan Environment Research Co., Ltd., 6-24-1 Nishi Shinjuku, Shinjuku-ku, Tokyo-160-0023, Japan 8Giken Kogyo Co., Ltd., 3-7-2 Asagayaminami, Suginami-ku, Tokyo 166-0004, Japan
9The Institute of Applied Energy, 1-14-2 Nishi Shinbashi, Minato-ku, Tokyo 105-0003, Japan 10ITOCHU Techono-Solutions Corporation, 3-2-5 Kasumigaseki, Chiyoda-ku, Tokyo 100-6080, Japan 11National Maritime Research Institute, 6-38-1 Shinkawa, Mitaka-shi, Tokyo 181-0004, Japan
Abstract. The overview of standardization activities for shielding materials is described. We propose a basic approach for standardizing material composition used in radiation shielding design for nuclear and accelerator facilities. We have collected concrete composition data from actual concrete samples to organize a representative composition and its variance data. Then the sensitivity analysis of the composition variance has been performed through a simple 1-D dose calculation. Recent findings from the analysis are summarized.
1 Introduction
In radiation shielding design and safety analysis, it is necessary to employ appropriate calculation conditions of shielding material, e.g., material density and composition. Concrete, lead and iron are widely used as shielding materials for nuclear power plants and accelerator facilities. Among them, the concrete composition cannot be universally specified in design phase, because it varies greatly depending on the locality of aggregate and a mixture ratio of aggregate and cement.
In Japan, the composition data listed in American National Standards Institute[1] or other reports[2,3] are often quoted for concrete composition. However, it is not clear whether they can represent the actual samples at Japanese construction sites. In fact, the importance and difficulties of this issue has long been widely shared in Japan.
In 2014, a working group was established in order to standardize shielding materials under the Standards Committee of Atomic Energy Society of Japan. Then we have discussed representativeness of the material composition and implication of the composition variance in shielding performance, especially for concrete. In this paper, our approach to standardize material composition is described, and calculation models and results of sensitivity analysis of concrete compositions are shown.
2 Basic approach for standardization of
material composition
Our approach to standardize concrete composition is as follows. First, we collect concrete composition data used in the present shielding calculation and actual sample data to organize the representative composition and variance of composition. Then neutron and gamma ray dose calculations are performed to evaluate influences of the composition variation on shielding performance. Lastly, influences of other variations, such as a moisture within concrete, mixture non-uniformity and trace elements contributing to induced activity, are considered.
3 Sensitivity analyses
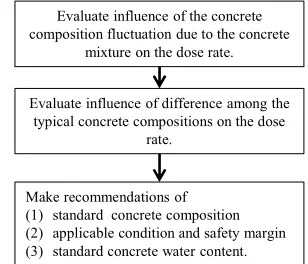
It is needed to prepare sensitivity analyses data so that shielding designers can reffer the influence of the fluctuation of concrete composition and water content on the shielding design. Fig. 1 shows sensitivity analysis method in this paper.
3.1 Method
Evaluate influence of the concrete composition fluctuation due to the concrete
mixture on the dose rate.
Evaluate influence of difference among the typical concrete compositions on the dose
rate.
Make recommendations of (1) standard concrete composition (2) applicable condition and safety margin (3) standard concrete water content.
basic sensitivity analysis conditions. Neutron and gamma dose calculations were performed by using one dimensional SN code ANISN[4] with MATXSLIB-J33
library[5]. As shown in Fig.2, 1-D simple sphere geometry was used for the sensitivity analysis so that influences of concrete composition can be shown clearly. A hollow concrete sphere having inner radius 500cm was used to avoid appearing the distance attenuation nearby source. A radiation source of 1cm diameter is placed at the center of the sphere. Representative concrete composition and its elemental variance data derived from actual samples was used in this calculation. Composition of F02HT is shown in table 2. As radiation sources 60Co for gamma and 235U for neutron were used
in this paper. In neutron dose calculation, it is also considered dose by secondary gamma rays.
Fig.1. Flow chart of the sensitivity analysis.
Table 1. Basic conditions of sensitivity analysis
Item Condition Calculation code ANISN (Doors3.2)
Evaluated nuclear data file JENDL-3.3
Library MATXSLIB-J33 Model 1 dimensional shell model
(See Fig.2) Maximum order of scatter P3 Order of angular quadrature S8
Boundary condition Left: reflection Right: vacuum
Accuracy 0.001
Fig.2.ANISN calculation model for the sensitivity analysis.
Table 2. Concrete compositions (atomic density) of F02HT
x Avogadro Number Element -3sigma average +3sigma
H 6.31E-03 6.31E-03 6.31E-03 C 5.89E-03 5.89E-03 5.89E-03 O 3.92E-02 4.08E-02 4.23E-02 Na 3.81E-04 3.81E-04 3.81E-04 Mg 2.93E-04 2.93E-04 2.93E-04 Al 1.23E-03 1.34E-03 1.45E-03 Si 6.37E-03 7.50E-03 8.63E-03 P 1.17E-05 1.17E-05 1.17E-05 K 3.80E-04 3.80E-04 3.80E-04 Ca 6.89E-03 7.85E-03 8.81E-03 Ti 2.26E-05 2.26E-05 2.26E-05 Mn 5.86E-06 5.86E-06 5.86E-06
Fe 1.20E-04 1.44E-04 1.68E-04 density 2.05g/cm3 2.21g/cm3 2.38g/cm3
3.2 Influence of the concrete composition
Fig.3 shows the calculation results of neutron dose attenuation rates of F02HT, ‘F02HT+3’and ‘F02HT-3’ with U-235 neutron source. ‘F02HT±3’ indicates a representative average density plus/minus 3 times of standard deviation for each of the nuclides. Similarly, Figures 4 and 5 show the secondary gamma and the total dose attenuation rates, respectively. Each curve were normalized by total dose rate of F02HT average concrete at inner concrete surface The results suggest that concrete density variation is dominant attenuation factor compared with the variation of elemental composition.
! !
Fig.3. Neutron dose attenuation rates of F02HT with 235U
source.
"#$%&& "#$%&&! "#$%&&!
Fig.4. Secondary gamma dose attenuation rates of F02HT with
235U source.
source(void) 1cm sphere
void concrete void
500cm
' '! '!
Fig.5. Total dose attenuation rates of F02HT with 235U source.
3.3 Influence of the concrete composition with realistic density
Although calculation with measured elemental composition with ±3sigma carried out, further calculation was carried out with restricted density between ±3sigma of the analyzed an actual concrete density since concrete densities shown in table 1 were too varied (about 8%) to evaluate effect of concrete composition. Concrete density used for radiation shielding was usually controlled to be desinged value. In this calculation, density restricted concrete composition derived with actual concrete data was emplyed. Table 3 shows density restricted concrete composition of F02HT (about 2.2%). Dose attenuation calculation model is shown in Fig.2 (same as first calculation).
Fig.6, Fig.7 and Fig.8 show neutron, secondary gamma and total dose atteuation rate with U-235 source. Neutron dose attenuation rate at 250cm depth of -3sigma concrete is about 2 times as large as that of +3sigma. As a result of this calculation, it can be concluded that neutron dose rate variation due to the density fluctuation by concrete mixing is at most within 2 times.
Table 3. Concrete compositions (atomic density) of F02HT by density reconfigured with analysed concrete density data.
x Avogadro Number Element -3sigma average +3sigma
H 6.31E-03 6.31E-03 6.31E-03 C 5.89E-03 5.89E-03 5.89E-03 O 4.03E-02 4.08E-02 4.13E-02 Na 3.81E-04 3.81E-04 3.81E-04 Mg 2.93E-04 2.93E-04 2.93E-04 Al 1.31E-03 1.34E-03 1.37E-03 Si 7.16E-03 7.50E-03 7.84E-03 P 1.17E-05 1.17E-05 1.17E-05 K 3.80E-04 3.80E-04 3.80E-04 Ca 7.56E-03 7.85E-03 8.14E-03
Ti 2.26E-05 2.26E-05 2.26E-05 Mn 5.87E-06 5.86E-06 5.87E-06
Fe 1.37E-04 1.44E-04 1.51E-04 density 2.16g/cm3 2.21g/cm3 2.26g/cm3
䠄䠄䠅
! (% !
Fig.6. Neutron dose attenuation rate of F02HT with dinsity reconfigured.
"#$%&&! "#$%&& (%
"#$%&&!
Fig.7. Secondary gamma dose attenuation rate of F02HT with dinsity reconfigured.
'! '(% '!
Fig.8. Total dose attenuation rate of F02HT with dinsity reconfigured.
3.4 Influence of the concrete composition with water content
3.4.1 Sensitivity analysis with U-235 neutron source
It is important to set water content in concrete appropriately when neutron transport calculation is carried out because neutron is easily slowing down by low atomic numbered elements (typically hydrogen in water). In this paper, three cases of water content in concrete were evaluated. The cases were absolute dry (0g/cm3 free water), 0.04g/cm3 free water and 0.1g/cm3
calculation model is shown in Fig.2 (same as first calculation)
Fig.9, Fig.10 and Fig.11 show the result of this calculation. Neutron dose attenuation rate is worse with decreasing the water content in concrete because neutron is easily slowing down in rich water content. Secondary gammas generation rate increases with increasing water content in concrete but dose rate of poor water content is higher than dose rate of rich water content because of neutron slowing down by water.
Table 4. Concrete compositions (atomic density) of F02HT with water content sensitivity analysis data.
x Avogadro Number Element average -3sigma +3sigma
H 6.31E-03 8.98E-03 1.30E-02 C 5.89E-03 5.89E-03 5.89E-03 O 4.08E-02 4.21E-02 4.41E-02 Na 3.81E-04 3.81E-04 3.81E-04 Mg 2.93E-04 2.93E-04 2.93E-04 Al 1.34E-03 1.34E-03 1.34E-03 Si 7.50E-03 7.50E-03 7.50E-03 P 1.17E-05 1.17E-05 1.17E-05 K 3.80E-04 3.80E-04 3.80E-04 Ca 7.85E-03 7.85E-03 7.85E-03
Ti 2.26E-05 2.26E-05 2.26E-05 Mn 5.86E-06 5.87E-06 5.87E-06
Fe 1.44E-04 1.44E-04 1.44E-04 density 2.21g/cm3 2.25g/cm3 2.31g/cm3
䠄䠄 䠅 )'$ %*#&+# %*#&+#
Fig.9. Neutron dose attenuation rate of F02HT with dinsity reconfigured. 䠄 䠅 "#$%&& )'$ "#$%&& %*#&+# "#$%&& %*#&+#
Fig.10. Secondary gamma dose attenuation rate of F02HT with dinsity reconfigured. 䠄 䠅 䠄䠅 ' )'$ ' %*#&+# ' %*#&+#
Fig.11. Total dose attenuation rate of F02HT with dinsity reconfigured.
3.4.2 Sensitivity analysis with gamma source
Dose rate sensitivity analysis for water content with gamma source was carried out. Co-60 was set as a gamma source. Fig. 12 shows the dose attenuation rate for these gamma rays. Since increase of water content brings increasing concrete density, gamma dose rate is well attenuated with rich water content concrete. Fig.13 shows the gamma dose attenuation for concrete mass thickness of F02HT. Fig.13 indicates that dose attenuation rate depends on its density since water content in concrete make a little contribution to the gamma dose attenuation rate by mass thickness.
1.0E-18 1.0E-16 1.0E-14 1.0E-12 1.0E-10 1.0E-08 1.0E-06 1.0E-04 1.0E-02 1.0E+00
0 50 100 150 200 250 300
G a m m a d o
se at
te n u a ti o n ret e ( -)
Concrete thickness (cm) Co-60 gamma dose attenuation rate (absolute dry)
Co-60 gamma dose attenuation rate (0.04g/cm3 water content) Co-60 gamma dose attenuation rate (0.1g/cm3 water content)
Fig.12 Co-60 gamma dose attenuation rate for the F02HT.
1.0E-18 1.0E-16 1.0E-14 1.0E-12 1.0E-10 1.0E-08 1.0E-06 1.0E-04 1.0E-02 1.0E+00
0 100 200 300 400 500 600 700
G a m m a d o se at te n u at io n rat e ( -)
Concrete mass thickness䠄g/cm2䠅
Co-60 gamma dose attenuation rate (absolute dry)
Co-60 gamma dose attenuation rate (0.04g/cm3 water content) Co-60 gamma dose attenuation rete (0.1g/cm3 water content)
4 Conclusions
The overview of standardization activities for shielding materials was described. As a first step, important data to determine radiation shielding concrete composition was obtained. Variation and behaviour of dose attenuation rate for gamma ray and neutron caused by variances of the concrete and the water content of the concrete indicates that neutron dose rate is influenced by light elements and gamma dose rate is influenced by concrete density. In the determination of the standard material composition, it has to present the consideration for variation of composition, the effect and dose caused by concrete density for neutron and gamma ray, consideration for water content and conservativeness of the shielding calculation with the standard concrete composition.
The authors wish to acknowledge the contribution of Y. Sakamoto, M. Taniguchi, T. Tsukiyama, S. Ishikawa, H. Sakamoto, H. Kawano, M. Yoshida and K. Kosako.
References
Online references will be linked to their original source, only if possible. To enable this linking extra care should be taken when preparing reference lists.
1. American Nuclear Society, Nuclear analysis and design of concrete radiation shielding for nuclear
power plants, ANSI/ANS-6.4.1-1997 (1997)
2. Argonne National Laboratory, Reactor physics constants, ANL-5800 (1963)
3. R. L. Walker and M. Grotenhuis, A Summary of shielding constants for concrete, ANL-6443 (1961) 4. Oak Ridge National Laboratory, Doors3.2: one,
two- and three-dimensional discrete ordinates
neutron/photon transport code system, Radiation
Safety Information Computational Center computer code collection, Oak Ridge, TN, CCC-650 (1998) 5. K. Kosako, N. Yamano, T. Fukahori, K. Shibata and
A. Hasegawa, The libraries FSXLIB and MATXSLIB
based on JENDL3.3, JAERI-Data/Code 2003-011