Drug, Healthcare and Patient Safety
R e v i e w
Dove
press
open access to scientific and medical research
Open Access Full Text Article
Prevention of NSAiD-related upper gastrointestinal
toxicity: a meta-analysis of traditional NSAiDs
with gastroprotection and COX-2 inhibitors
Alaa Rostom1
Katherine Muir2
Catherine Dube3
Angel Lanas4
emilie Jolicoeur3
Peter Tugwell3
1University of Calgary, Calgary,
Alberta, Canada; 2University
of Toronto, Toronto, Ontario, Canada; 3University of Ottawa,
Ottawa, Ontario, Canada;
4University Hospital Lozano
Blesa, instituto Aragones de Ciencias de la Salud, Zaragoza, Spain
Correspondence: Alaa Rostom MD, MSc, FRCPC
Associate Professor of Medicine, Division of Gastroenterology, University of Calgary, Forzani and MacPhail Colon Cancer Screening Centre, 3280 Hospital Drive Nw, Calgary, Alberta, Canada, T2N 4N1
email arostom@ucalgary.ca
Background: Traditional NSAIDs (tNSAIDs) and COX-2 inhibitors (COX-2s) are important agents for the treatment of a variety or arthritic conditions. The purpose of this study was to systematically review the effectiveness of misoprostol, H2-receptor antagonists (H2RAs), and proton pump inhibitors (PPIs) for the prevention of tNSAID related upper gastrointestinal (GI) toxicity, and to review the upper gastrointestinal (GI) safety of COX-2s.
Methods: An extensive literature search was performed to identify randomized controlled trials (RCTs) of prophylactic agents used for the prevention of upper GI toxicity, and RCTs that assessed the GI safety of the newer COX-2s. Meta-analysis was performed in accordance with accepted techniques.
Results: 39 gastroprotection and 69 COX-2 RCTs met inclusion criteria. Misoprostol, PPIs, and double doses of H2RAs are effective at reducing the risk of both endoscopic gastric and duodenal tNSAID-induced ulcers. Standard doses of H2RAs are not effective at reducing the risk of tNSAID-induced gastric ulcers, but reduce the risk of duodenal ulcers. Misoprostol is associated with greater adverse effects than the other agents, particularly at higher doses. COX-2s are associated with fewer endoscopic ulcers and clinically important ulcer complications, and have fewer treatment withdrawals due to GI symptoms than tNSAIDS. Acetylsalicylic acid appears to diminish the benefit of COX-2s over tNSAIDs. In high risk GI patients, tNSAID with a PPI or a COX-2 alone appear to offer similar GI safety, but a strategy of a COX-2 with a PPI appears to offer the greatest GI safety.
Conclusion: Several strategies are available to reduce the risk of upper GI toxicity with tNSAIDs. The choice between these strategies needs to consider patients’ underlying GI and cardiovascular risk.
Keywords: NSAID, gastrointestinal toxicity, COX-2 inhibitors
Introduction
Nonsteroidal anti-inflammatory drugs (NSAIDs) are widely used to treat arthritis, menstrual, musculoskeletal and post-operative pain, as well as headache and fever. NSAIDs include acetylsalicylic acid (ASA), traditional NSAIDs (tNSAIDs) (eg, diclofenac, ibuprofen, indomethacin, and naproxen) and inhibitors of the COX-2 isoform of cyclo-oxygenase (referred to here as COX-2s, eg, celecoxib, lumiracoxib, etoricoxib, rofecoxib).
One cohort study found that about 25% of Canadians in 2001 were prescribed short-term NSAIDs (a rise of 28% over 1999 when COX-2s were first introduced), and about 4% were prescribed these agents long-term (defined in this study as 6 months);1 this equates to approximately 6.2 million short-term users, and
1.0 million long-term users of NSAID therapy. However, this substantially underestimates
Drug, Healthcare and Patient Safety downloaded from https://www.dovepress.com/ by 118.70.13.36 on 22-Aug-2020
For personal use only.
Number of times this article has been viewed
This article was published in the following Dove Press journal: Drug, Healthcare and Patient Safety
Rostom et al Dovepress the true magnitude of NSAID uses since it does not include
use of over the counter NSAIDs. A US cohort study, reported the point prevalence of daily prescription NSAID use as 8.7% between 2002 and 2003 with 46% being COX-2s.2
Low-dose ASA is extensively used for cardiovascular risk reduction.
There are increasing concerns over the risks of gas-trointestinal and cardiovascular adverse events with these medications. The increased risks of upper gastrointestinal ulcers and complications with tNSAIDs and ASA are well documented,3–7 and while the risks are reduced by about
50% with COX-2s, they continue to be important since this risk is not reduced to baseline.8–10 Furthermore with the
introduction of COX-2s in the late 1990, overall NSAID prescriptions rose with COX-2s overtaking tNSAIDs suggesting that individuals not previously on NSAIDs were being prescribed COX-2s. Over the same time frame, there was a 75.9% increase in the rate of non-fatal digestive perforations and hemorrhages in the presence of NSAIDs. Moreover, the benefits of COX-2s are attenuated when COX-2s are co-prescribed with ASA10 although to a lesser
extent than when tNSAIDs are co-prescribed with ASA. In addition, extensive data associate COX-2s and non-naproxen tNSAIDs with an increased risk of cardiovascular events,11,12 which has led regulatory authorities to introduce
warning statements and advisories Additionally, the COX-2s, rofecoxib, valdecoxib, and lumiracoxib have been withdrawn from the market because of cardiovascular, cutaneous, and hepatic adverse events respectively.1,2,13–15 Health Canada
and the Food and Drug Administration (FDA) require the product information for tNSAIDs and COX-2s to include a warning of the increased incidence of cardiovascular (eg, heart attack, stroke) and gastrointestinal (eg, ulcer, bleeding) adverse events, as well as recommendations to limit use of the drug to the lowest effective dose for the shortest possible duration of treatment.2,15
The purpose of this study was to systematically review the literature on interventions to prevent tNSAID related upper gastrointestinal (GI) toxicity, and on the GI safety of COX-2s.
Methods
This review was conducted in accordance with the methods of the Cochrane Collaboration.16
Literature search strategy
The search strategy and methods have been previously described elsewhere. These were updated to May 2009.10,17
inclusion criteria
Types of studies
RCTs of COX-2s (celecoxib [Celebrex®], rofecoxib
[Vioxx®], etoricoxib [Arcoxia®], valdecoxib [Bextra®],
lumi-racoxib [Prexige®]) were considered eligible for inclusion if
the upper GI toxicity of these agents was compared to that of a non-selective NSAID or to placebo. RCTs of prosta-glandin analogues (misoprostol), H2-receptor antagonists (H2RA), and proton pump inhibitors (PPI) in the prevention of NSAID-induced upper GI toxicity were also considered if these agents were used alongside an NSAID compared to an NSAID alone. Further the RCTs had to meet the following additional criteria.
Participants were 18 years or older and had osteoarthritis, rheumatoid arthritis or another arthritic condition; NSAID exposure was 4 weeks or longer (chronic NSAID exposure); the proportion of patients with endoscopic ulcers, significant clinical GI events (eg, perforation, obstruction, bleeding, symptomatic ulcers), and/or symptom based clinical events (adverse GI symptoms, withdrawals due to GI symptoms) could be determined; endoscopic ulcers were defined as being at least 3 mm in diameter or could be distinguished from erosions based on the authors’ descriptions; and it was noted whether endoscopy was performed based on symptoms or as part of a protocol.
Types of interventions
The interventions included the following COX-2s: celecoxib (Celebrex®), rofecoxib (Vioxx®), etoricoxib (Arcoxia®),
valdecoxib (Bextra®), lumiracoxib (Prexige®). For this
review, low-dose COX-2s were defined as celecoxib 200 mg bid or less, rofecoxib 25 mg daily or less, etoricoxib 60 mg daily or less, valdecoxib 10 mg daily or less, and lumiracoxib 100 to 200 mg. High-dose COX-2s were defined as celecoxib 400 mg bid, rofecoxib 50 mg daily, etoricoxib 90 mg daily or more, valdecoxib 20 mg daily or more, and lumiracoxib 400 mg or more. For prophylaxis against tNSAID induced upper GI toxicity we included: the prostaglandin antagonist misoprostol (Cytotec®) (low dose 400 µg/day, intermediate
dose 600 µg/day; high dose 800 µg/day); the PPIs omeprazole, esomeprazole, pantoprazole, and lansoprazole (Losec®, Nexium®, Pantoloc®, Prevacid®, respectively); and
the H2RAs cimetadine, ranitidine, nizatidine, and famotidine (Tagamet®, Zantac®, Axid®, and Pepcid®, respectively).
Double doses of H2RAs were defined as a dose equivalent to or greater than 300 mg of ranitidine twice daily, and standard dose of PPIs were considered the equivalent of 20 mg of omeprazole once daily.
Drug, Healthcare and Patient Safety downloaded from https://www.dovepress.com/ by 118.70.13.36 on 22-Aug-2020
Prevention of NSAiD-related upper Gi toxicity
Dovepress
Types of outcome measures
The primary outcomes were: endoscopically detected ulcer in endoscopy trials; and clinical GI events. Clinically important adverse events were categorized in two ways: 1) strict ulcer complications, which are referred to as “POB” (for perforation, obstruction or bleeding), and 2) ulcer complications and/or ulcer-related symptoms that lead to the identification of an ulcer (so called symptomatic ulcer), which are referred to as “PUB” (for perforation, obstruction, bleeding or the presence of a symptomatic ulcer). Efficacy/tolerability trials were defined as studies that focused on clinical efficacy or effectiveness of COX-2s but also reported on adverse symptoms or other clinical adverse events. Secondary outcomes were: adverse GI symptoms (dyspepsia, nausea, abdominal pain, or diarrhea); and treatment withdrawals due to GI symptoms.
Quality assessment
All RCTs were scored for quality by 2 independent reviewers using the Jadad scale.18 The quality of allocation
concealment was also assessed.19 Differences were resolved
by consensus.
Statistical analysis
Data were analyzed using Review Manager (RevMan) version 5.0. Endoscopic, clinical and symptom-based outcomes were analyzed separately. The primary analyses were expressed as relative risks using a fixed effects model. A random-effects model was used to combine “heterogeneous trials” only if it was clinically and statistically appropriate. The absolute risk reduction (ARR ) was calculated for appropriate clinical endpoints.
Subgroup analyses
Studies were grouped by interventions (eg, COX-2s vs tNSAIDs, and COX-2s vs placebo), dosage (low-dose and high-dose), and duration of therapy. Additionally, within each of the three main outcome analyses (endoscopic ulcer, clinical ulcer, and symptoms), studies were analyzed as all COX-2s vs all tNSAIDs, individual COX-2s vs all comparator tNSAIDs, individual tNSAIDs vs all comparator COX-2s, and individual COX-2s vs individual tNSAIDs.
Heterogeneity
Sources for clinical and statistical heterogeneity were sought prior to statistical analyses. Logical analyses subgroups were created (see above) to allow for more homogeneous analyses groups. Heterogeneity was tested using the I2 statistic and
a chi-square test. An I2 50% or a chi-square p value of
less than 0.10 is considered to be evidence of statistical heterogeneity.20
Sensitivity analyses
In addition to the published reports, unique studies were identified from the FDA web site, and in the form of published “combined analyses” studies. The latter studies combined published and unpublished primary patient data from the endoscopic studies, as well as the safety and tolerability studies to allow sample sizes large enough to comment on clinical ulcer complications. We carefully examined these studies by their ID number, their sample size, patient demographics and list of authors and cross referenced with the FDA web site in order to ensure that their use in the ulcer complication analyses would not create duplication of individual patient data. Sensitivity analyses were conducted removing or adding FDA studies, and the combined analyses studies. Additionally, sensitivity analyses were used to assess the impact of supplemental FDA data on published study results when available (eg, CLASS study). Sensitivity analysis was also performed removing studies with quality scores of 2 or less.
Results
Part i – tNSAiD prophylaxis
Of a total of 1205 references with 256 being potentially relevant, 39 RCTs met the inclusion criteria: 23 misoprostol trials (includes 6 head to head studies); 12 H2RA (9 standard dose, 3 double dose, 1 head to head); and 9 PPI trials (6 direct, 5 head to head). Some studies considered more than one active intervention. Table 1 summarizes the characteristics of the included studies. Effects of interventions are summarized below.
Misoprostol
We found 23 studies that assessed the long term effect of misoprostol on the prevention of tNSAID ulcers.14,21–42
endoscopic ulcers
Eleven studies with 3,641patients compared the incidence of endoscopic ulcers, after at least 3 months, of misoprostol to that of placebo.21,22,25,29–33,36,38,42 The cumulative incidence
of endoscopic gastric and duodenal ulcers with placebo were 15% and 6% respectively. Misoprostol (any dose combined) significantly reduced the relative risk of gastric ulcer and duodenal ulcers by 74% relative risk [RR] 0.26; 95% confidence interval [CI] 0.17 to 0.39, random effects),
Drug, Healthcare and Patient Safety downloaded from https://www.dovepress.com/ by 118.70.13.36 on 22-Aug-2020
Rostom et al Dovepress
Table 1 included studies of gastro-protection
Study Comparisons NSAID Number Mean age Primary or
secondary
Follow-up times (months) Intervention Comparator
Misoprostol
Graham30 misoprostol 400 µg/day placebo ibuprofen, piroxicam,
naproxen
421 59 primary 1, 2, 3
misoprostol 800 µg/day
Agrawal21 misoprostol 800 µg/day placebo various 356 60 primary 3
Chandrasekaran26 misoprostol 600 µg/day placebo various 90 39 primary 1
Saggioro39 misoprostol 800 µg/day placebo various 166 56 primary 1
Bolten24 misoprostol 400–600 µg/day placebo diclofenac 361 60 primary 1
verdickt42 misoprostol 400–600 µg/day placebo diclofenac 339 53 primary 3
Melo14 misoprostol 400 µg/day +
diclofenac
placebo + piroxicam
piroxicam 643 60 primary 1
Graham31 misoprostol 800 placebo various 643 59 primary 3
Henriksson34 misoprostol 600 µg/day placebo naproxen, ibuprofen,
aspirin
40 60 primary 1
Roth38 misoprostol 800 placebo ibuprofen 113 53 and 60 primary 3
Delmas28 misoprostol 400 µg/day placebo various 256 54 primary 1
misoprostol 800 µg/day
elliott29 misoprostol 600–800 µg/day placebo various 83 65 primary 3, 6, 12
Agrawal22 misoprostol 400–600 µg/day placebo diclofenac 384 57 secondary 3, 6, 12
Raskin36 misoprostol 400 µg/day placebo various 1618 58 primary 3
misoprostol 600 µg/day misoprostol 800 µg/day
Silverstein40 misoprostol 800 µg/day placebo various 8843 68 primary 24
Bocanegra23 misoprostol 200 µg bid
misoprostol 200 µg tid
placebo diclofenac 481 62 primary 1
Chan25 misoprostol 200 bid nabumetone naproxen 90 74 secondary 6
H2 antagonists
Berkowitz43 ranitidine 150 mg bid placebo aspirin 50 28.5 primary 1
Roth140 cimetidine 400 mg/day placebo various 26 nd primary 10
ehsanullah44 ranitidine 150 mg bid placebo various 297 57 primary 1, 2
Robinson46 ranitidine 150 mg bid placebo various 144 48 primary 1, 2
Swift50 ranitidine 150 mg bid placebo various 24 56.5 primary 4
Robinson45 ranitidine 150 mg/day placebo 227 54.2 primary 1
Levine49 nizatidine 150 mg bid placebo 496 56.9 primary 3
Simon51 nizatidine 150 mg/day nizatidine
150 mg bid
237 58 secondary 3, 6
Taha47 famotidine 20 mg/day primary 1, 3, 6
famotidine 40 mg/day placebo various 285 53.4
wolde53 ranitidine 300 bid placebo 30 67 ranitidine,
58 placebo
secondary 12
van Groenendael48 ranitidine 150 mg bid (Grp B) placebo various 36 52 primary 1
Hudson52 famotidine 40 mg bid placebo various 78 58 secondary 1, 3, 6
(Continued)
Drug, Healthcare and Patient Safety downloaded from https://www.dovepress.com/ by 118.70.13.36 on 22-Aug-2020
Prevention of NSAiD-related upper Gi toxicity
Dovepress
Table 1 (Continued)
Study Comparisons NSAID Number Mean age Primary or
secondary
Follow-up times (months) Intervention Comparator
Proton pump inhibitors
Cullen55 omeprazole 20 mg/day placebo 168 primary 6
ekstrom56 omeprazole 20 mg/day placebo various 177 58 primary 3
Hawkey85 misoprostol 400 µg/day
omeprazole 20 mg/day
placebo diclofenac, ketoprofen, naproxen
725 58 secondary 6
Bianchi Porro54 pantoprazole 40 mg/day placebo various 104 58 primary 3
Lai57 lansoprazole 30 mg placebo naproxen 43 69 secondary 2
Head to head comparisons
valentini41 misoprostol 400 diclofenac 61 59.2 44% n/a
ranitidine 150 mg bid
Raskin37 misoprostol 800 µg/day ranitidine
150 mg bid
various 538 61 primary 2
Hawkey85 misoprostol 400 µg/day
omeprazole 20 mg/day
placebo diclofenac, ketoprofen, naproxen
725 58 secondary 6
Yeomans58 omeprazole 20 mg/day ranitidine
150 mg bid
diclofenac, indomethacin, naproxen
425 56 30% 1, 2
Jensen35 misoprostol 200 µg qid omeprazole
20 mg bid
various 46 n/a secondary 6
Graham32 misoprostol 800 µg
lansoprazole 15 mg lansoprazole 30 mg
placebo various 537 60 secondary 3
Stupnicki13 misoprostol 400 µg/day pantoprazole
40 mg/day
diclofenac 515 55 primary 1
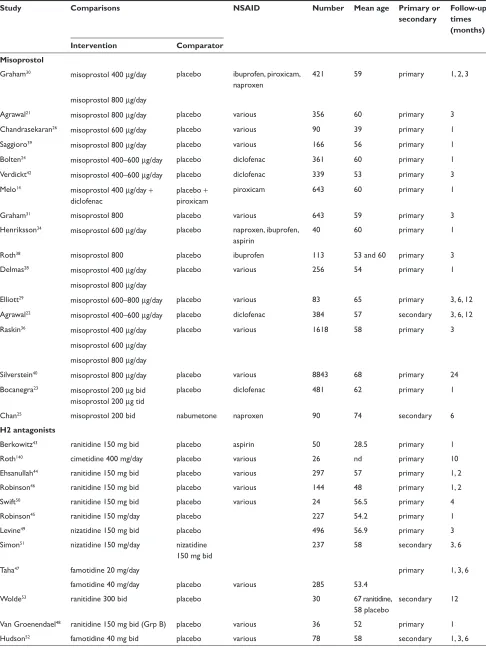
and 58% (RR 0.42; 95% CI 0.22 to 0.81, random effects). These relative risks correspond to a 12.0%, and 3% absolute risk reductions for gastric and duodenal ulcers respectively. The observed heterogeneity in these estimates was due to inclusion of all misoprostol doses in the analyses. Analysis of the misoprostol studies stratified by dose eliminated this heterogeneity.
Analysis by dose
All the studied doses of misoprostol significantly reduced the risk of endoscopic ulcers, and a dose response relationship was demonstrated for endoscopic gastric ulcers. Six studies with 2,461 patients used misoprostol 400 µg.22,25,30,33,36,42
1 study with 928 patients used 600 µg daily,36 and 7 with
2,423 patients used 800 µg daily.21,29–32,36,38 Misoprostol
800 µg daily was associated with the lowest risk (RR 0.17; 95% CI 0.11 to 0.24) of endoscopic gastric ulcers when compared to placebo, whereas misoprostol 400 ug daily was associated with a relative risk of 0.42 (95% CI 0.28 to 0.67, random effects model for heterogeneity) (Figure 1).
This difference between high- and low-dose misoprostol reached statistical significance (P0.0055). The intermediate misoprostol dose (600 µg daily) was not statistically different from either the low or high dose. The pooled relative risk reduction of 78% (4.7% absolute risk difference, RR 0.21; 95% CI 0.09 to 0.49) for duodenal ulcers with misoprostol 800 µg daily was not statistically different from those of the lower daily misoprostol dosages.
Studies including data with less than 3 months tNSAiD exposure
Eight studies, with 2,206 patients, assessed the rates of endoscopic ulcers with misoprostol compared to placebo at 1 to 1.5 months.14,23,24,26,28,29,34,39 The pooling of these studies
revealed an 81% relative risk reduction of gastric ulcers with misoprostol (RR 0.17; 95% CI 0.09 to 0.31) and an 72% relative risk reduction of duodenal ulcers (RR 0.28; 95% CI 0.14 to 0.56).
One study compared misoprostol to a newer cytoprotective agent, dosmafate, for tNSAID prophylaxis and found no
Drug, Healthcare and Patient Safety downloaded from https://www.dovepress.com/ by 118.70.13.36 on 22-Aug-2020
Rostom et al Dovepress
Study or Subgroup
4.4.1 Low dose (400−600 µg) Agrawal22
Chan25 Graham30 Hawkey33 Raskin36 Verdickt42 Subtotal (95% CI) Total events
Heterogeneity: Chi² = 10.97, df = 5 (P = 0.05); I² = 54% Test for overall effect: Z = 6.88 (P < 0.00001)
4.4.2 Mid-range dose (600 µg) Raskin36
Subtotal (95% CI) Total events
Heterogeneity: Not applicable
Test for overall effect: Z = 4.64 (P < 0.00001)
4.4.3 High dose (800 µg) Agrawal21
Elliott29 Graham30 Graham31 Graham32 Raskin36 Roth38
Subtotal (95% CI) Total events
Heterogeneity: Chi² = 6.71, df = 6 (P = 0.35); I² = 11% Test for overall effect: Z = 9.28 (P < 0.00001)
Events
6 5 8 31 29 4
83
13
13
2 4 2 6 8 6 0
28 Total
193 45 143 296 462 164 1303
474 474
179 40 140 320 111 228 60 1078
Events
20 2 30 50 51 6
159
51
51
21 11 30 25 54 51 7
199 Total
191 45 138 155 454 175 1158
454 454
177 43 138 323 111 454 53 1299
Weight
11.5% 1.1% 17.4% 37.4% 29.3% 3.3% 100.0%
100.0% 100.0%
11.5% 5.8% 16.5% 13.6% 29.5% 18.6% 4.4% 100.0%
M-H, Fixed, 95% CI
0.30 [0.12, 0.72] 2.50 [0.51,12.22] 0.26 [0.12, 0.54] 0.32 [0.22, 0.49] 0.56 [0.36, 0.87] 0.71 [0.20, 2.48] 0.42 [0.32, 0.53]
0.24 [0.13, 0.44] 0.24 [0.13, 0.44]
0.09 [0.02, 0.40] 0.39 [0.14, 1.13] 0.07 [0.02, 0.27] 0.24 [0.10, 0.58] 0.15 [0.07, 0.30] 0.23 [0.10, 0.54] 0.06 [0.00, 1.01] 0.17 [0.11, 0.24]
Misoprostol Control Risk Ratio Risk Ratio
M-H, Fixed, 95% CI
0.02 0.1 1 10 50
Favors misoprostol Favors control
Figure 1 Misoprostol vs placebo for the prevention of gastric ulcers – efficacy by dose.
statistically significant difference in ulcer rates between the two agents.27
Clinical ulcers
Only 1 RCT, the MUCOSA trial, evaluated the efficacy of misoprostol prophylaxis against clinically important TNSAID induced ulcer complications as the powered primary endpoint. In this study, of 8,843 patients studied over 6 months, the overall GI event incidence was about 1.5% per year.40 Misoprostol 800 µg/day was associated with a
statisti-cally significant 40% risk reduction (odds ratio0.598; 95% CI 0.364 to 0.982) in combined GI events (P0.049), representing a risk difference of 0.38% (from 0.95% to 0.57%).
Adverse effects
Misoprostol was associated with a small but statistically significant 1.6 fold excess risk of drop out due to drug induced
side effects, and an excess risk of drop-outs due to nausea (RR 1.30; 95% CI 1.08 to 1.55), diarrhea (RR 2.36; 95% CI 2.01 to 2.77), and abdominal pain (RR 1.36; 95% CI 1.20 to 1.55). In the MUCOSA trial, 732 out of 4,404 patients on misoprostol experienced diarrhea or abdominal pain, compared to 399 out of 4,439 on placebo for a relative risk of 1.82 associated with misoprostol (P 0.001). Overall 27% of patients on misoprostol experienced one or more side effects.40
When analyzed by dose, only misoprostol 800 µg daily showed a statistically significant excess risk of drop-outs due to diarrhea (RR 2.45; 95% CI 2.09 to 2.88), and abdominal pain (RR 1.38; 95% CI 1.17 to 1.63 ). Both misoprostol doses were associated with a statistically significant risk of diarrhea. However, the risk of diarrhea with 800 µg/day (RR 3.25; 95% CI 2.60 to 4.06) was significantly higher than that seen with
Drug, Healthcare and Patient Safety downloaded from https://www.dovepress.com/ by 118.70.13.36 on 22-Aug-2020
Prevention of NSAiD-related upper Gi toxicity
Dovepress
400 µg/day (RR 1.81 95% CI 1.52 to 2.16) (P0.0012). The results for overall dropouts due to symptoms analyzed by dose are shown in Figure 2.
H2RAs
Seven trials with over 900 patients assessed the effect of standard dose H2RAs on the prevention of endoscopic tNSAID ulcers at 1 month,43–48 and 5 trials with 1,005 patients assessed
these outcomes at 3 months or longer.44,47,49–51 Standard dose
H2RAs are effective at reducing the risk of duodenal ulcers (RR 0.24; 95% CI 0.10 to 0.57, and RR 0.36; 95% CI 0.18 to 0.74 at 1 and 3 or more months respectively), but not of gastric ulcers (NS). One study did not have a placebo comparator and was not included in the pooled estimate.51
Three RCTs with 298 patients assessed the efficacy of double dose H2RA for the prevention of tNSAID induced upper GI toxicity.47,52,53 Double-dose H2RAs when compared
to placebo were associated with a statistically significant reduction in the risk of both duodenal (RR 0.26; 95% CI 0.11 to 0.65) and gastric ulcers (RR 0.44; 95% CI 026 to 0.74). This 56% relative risk reduction in gastric ulcer corresponds to a 12% absolute risk difference (from 23.1% to 11.3%) (Figures 3 and 4). Analysis of the secondary prophylaxis studies alone yielded similar results.
Symptoms
H2RA, in standard or double doses, were not associated with an excess risk of total drop-outs, dropouts due to side effects,
Study or Subgroup
5.8.1 Misoprostol 400 µg/day Agrawal22
Bolten24 Delmas28 Raskin36 Verdickt42
Subtotal (95% CI) Total events
Heterogeneity: Chi² = 0.17, df = 4 (P = 1.00); I² = 0% Test for overall effect: Z = 1.01 (P = 0.31)
5.8.2 Misoprostol 600 µg/day Raskin36
Subtotal (95% CI) Total events
Heterogeneity: Not applicable
Test for overall effect: Z = 0.49 (P = 0.62)
5.8.3 Misoprostol 800 µg/day Agrawal21
Delmas28 Elliott29 Graham31 Hawkey33 Raskin36 Roth38 Saggioro39 Silverstein40 Subtotal (95% CI) Total events
Heterogeneity: Chi² = 14.18, df = 8 (P = 0.08); I² = 44% Test for overall effect: Z = 9.33 (P < 0.00001)
Events
11 11 5 55 18
100
56
56
31 10 5 38 23 46 9 6 1210
1378 Total
193 178 73 462 164 1070
474 474
179 80 40 320 297 228 60 82 4404 5690
Events
9 10 6 49 15
89
49
49
16 6 1 34 3 49 2 1 896
1008 Total
191 183 103 454 175 1106
454 454
177 103 43 323 155 454 53 84 4439 5831
Weight
10.3% 11.2% 5.7% 56.3% 16.5% 100.0%
100.0% 100.0%
1.6% 0.5% 0.1% 3.4% 0.4% 3.3% 0.2% 0.1% 90.3% 100.0%
M-H, Fixed, 95% CI
1.21 [0.51, 2.85] 1.13 [0.49, 2.60] 1.18 [0.37, 3.71] 1.10 [0.77, 1.59] 1.28 [0.67, 2.46] 1.15 [0.88, 1.51]
1.09 [0.76, 1.57] 1.09 [0.76, 1.57]
1.92 [1.09, 3.38] 2.15 [0.81, 5.66] 5.38 [0.66, 44.04] 1.13 [0.73, 1.74] 4.00 [1.22, 13.12] 1.87 [1.29, 2.71] 3.98 [0.90, 17.58] 6.15 [0.76, 49.94] 1.36 [1.26, 1.47] 1.41 [1.31, 1.51]
Treatment Control Risk Ratio Risk Ratio
M-H, Fixed, 95% CI
0.5 0.7 1 1.5 2
Favors treatment Favors control
Figure 2 Misoprostol vs placebo – drop-outs due to side-effects by dose.
Drug, Healthcare and Patient Safety downloaded from https://www.dovepress.com/ by 118.70.13.36 on 22-Aug-2020
Rostom et al Dovepress
Study or Subgroup 8.1.1 High dose
Hudson52
Taha47
Wolde53
Subtotal (95% CI)
Total events
Heterogeneity: Chi² = 0.06, df = 2 (P = 0.97); I² = 0% Test for overall effect: Z = 3.13 (P = 0.002)
8.1.2 Low dose
Ehsanullah44
Levine49
Swift50
Taha47
Subtotal (95% CI)
Total events
Heterogeneity: Chi² = 1.54, df = 3 (P = 0.67); I² = 0% Test for overall effect: Z = 1.55 (P = 0.12)
Events
7 7 3
17
8 20 0 11
39
Total
39 97 15
151
151 248 16 95
510 Events
16 16 6
38
7 28 1 16
52
Total
39 93 15
147
146 248 8 93
495 Weight
41.7% 42.6% 15.7%
100.0%
13.4% 52.6% 3.7% 30.4%
100.0%
M-H, Fixed, 95% CI
0.44 [0.20, 0.94] 0.42 [0.18, 0.97] 0.50 [0.15, 1.64]
0.44 [0.26, 0.74]
1.11 [0.41, 2.97] 0.71 [0.41, 1.23] 0.18 [0.01, 3.91] 0.67 [0.33, 1.37]
0.73 [0.50, 1.08]
Treatment Control Risk Ratio Risk Ratio
M-H, Fixed, 95% CI
0.1 0.2 0.5 1 2 5 10 Favors treatment Favors control
Figure 3 H2RAs compared to placebo for the prevention of gastric ulcer. Analysis by dose in studies of 12 weeks or longer duration.
Study or Subgroup 8.2.1 High dose
Hudson52
Taha47
Wolde53
Subtotal (95% CI)
Total events
Heterogeneity: Chi² = 1.44, df = 2 (P = 0.49); I² = 0% Test for overall effect: Z = 2.87 (P = 0.004)
8.2.2 Low dose
Ehsanullah44
Levine49
Taha47
Subtotal (95% CI)
Total events
Heterogeneity: Chi² = 2.15, df = 2 (P = 0.34); I² = 7% Test for overall effect: Z = 2.78 (P = 0.005)
Events
3 2 0
5
2 5 3
10
Total
39 97 15
151
151 248 95
494 Events
6 10 4
20
10 7 10
27
Total
39 93 15
147
146 248 93
487 Weight
29.0% 49.3% 21.7%
100.0%
37.3% 25.7% 37.1%
100.0%
M-H, Fixed, 95% CI
0.50 [0.13, 1.86] 0.19 [0.04, 0.85] 0.11 [0.01, 1.90]
0.26 [0.11, 0.65]
0.19 [0.04, 0.87] 0.71 [0.23, 2.22] 0.29 [0.08, 1.03]
0.36 [0.18, 0.74]
Treatment Control Risk Ratio Risk Ratio
M-H, Fixed, 95% CI
0.01 0.1 1 10 100
Favors treatment Favors control
Figure 4 H2RAs compared to placebo for the prevention of duodenal ulcer. Analysis by dose in studies of 12 weeks or longer duration. or symptoms compared to placebo. However, high-dose
H2RAs significantly reduced symptoms of abdominal pain when compared to placebo (RR 0.57, 95% CI 0.33 to 0.98).
PPis
Six RCTs with 1,259 patients assessed the effect of PPIs on the prevention of NSAID-induced upper GI toxicity.32,33,54–57
PPIs significantly reduced the risk of both endoscopic duodenal (RR 0.20; 95% CI 0.10 to 0.39) and gastric ulcers
(RR 0.39; 95% CI 0.31 to 0.50) compared to placebo (Figures 5 and 6).32,33,54–57 The results were similar for both
primary and secondary prophylaxis trials.
Symptoms
Four omeprazole trials used the same composite endpoints to define treatment success.33,55,56,58 In these trials omeprazole
significantly reduced “dyspeptic symptoms” as defined by the authors. In the combined analysis, drop-outs overall
Drug, Healthcare and Patient Safety downloaded from https://www.dovepress.com/ by 118.70.13.36 on 22-Aug-2020
Prevention of NSAiD-related upper Gi toxicity
Dovepress
(RR 0.89; 95% CI 0.62 to 1.29) and drop-outs due to side effects (RR 1.20; 95% CI 0.66 to 2.15) were not different from placebo.
Head to head comparisons
of gastroprotective agents
Misoprostol vs H2RAs
Two trials with 600 patients compared misoprostol (400 to 800 µg) to ranitidine 150 mg twice daily.36,41 Misoprostol
appears superior to standard dose ranitidine for the prevention of tNSAID induced gastric ulcers (RR 0.12; 95% CI 0.03 to 0.51) but not for duodenal ulcers (RR 1.00; 95% CI 0.14 to 7.14).
PPi vs H2RAS
Yeomans et al in a 12-week study of 425 patients, compared omeprazole 20 mg daily to ranitidine 150 mg twice daily for tNSAID prophylaxis (various tNSAIDs used).58 In this study,
omeprazole was superior to standard-dose ranitidine for the prevention of both gastric (RR 0.32; 95% CI 0.17 to 0.62) and duodenal ulcers (RR 0.11; 95% CI 0.01 to 0.89).
PPi vs misoprostol
Four trials with a total of 1,478 patients13,32,33,35 compared
a PPI to misoprostol. Two studies compared low-dose misoprostol (400 µg) daily to a standard-dose PPI13,33 while
the Graham study compared high-dose misoprostol (800 µg) to lansoprazole 15 or 30 mg daily. PPIs are superior to misoprostol for the prevention of duodenal (RR 0.25; 95% CI 0.11 to 0.056), but not gastric (RR 1.61; 95% CI 0.88 to 3.06, random effects) or total gastroduodenal ulcers (RR 0.90; 95% CI 0.47 to 1.72, random effects).
Symptoms
In the two head to head comparison of omeprazole and misoprostol,32,33 PPIs were associated with significantly less
drop-outs overall (RR 0.71; 95% CI 0.52 to 0.97), as well as significantly less drop-outs due to side effects (RR 0.48; 09% CI 0.29 to 0.78). Compared to H2RA used for less than 2 months, misoprostol caused significantly more drop-outs due to abdominal pain (RR 3.00, 95% CI 1.11 to 8.14) and more symptoms of diarrhea (RR 2.03, 95% CI 1.38 to 2.99). There were no significant differences in drop-outs due to Study or Subgroup
Bianchi Porro54
Cullen55
Ekstrom56
Graham32
Hawkey33
Lai57
Total (95% CI) Total events
Heterogeneity: Chi² = 2.64, df = 5 (P = 0.75); I² = 0% Test for overall effect: Z = 7.79 (P < 0.00001)
Events 7 3 2 45 35 1
93 Total
43 83 86 236 274 22
744
Events 5 9 6 54 50 7
131 Total
23 85 91 111 155 21
486
Weight 3.9% 5.4% 3.5% 44.3% 38.5% 4.3%
100.0%
M-H, Fixed, 95% CI 0.75 [0.27, 2.10] 0.34 [0.10, 1.22] 0.35 [0.07, 1.70] 0.39 [0.28, 0.54] 0.40 [0.27, 0.58] 0.14 [0.02, 1.02]
0.39 [0.31, 0.50]
Treatment Control Risk Ratio Risk Ratio
M-H, Fixed, 95% CI
0.1 0.2 0.5 1 2 5 10
Favors treatment Favors control
Figure 5 Proton pump inhibitors compared to placebo for the prevention of gastric ulcer in studies of 8 weeks or longer duration.
Study or Subgroup Bianchi Porro54 Cullen55 Ekstrom56 Hawkey33 Lai57
Total (95% CI) Total events
Heterogeneity: Chi² = 1.16, df = 4 (P = 0.89); I² = 0% Test for overall effect: Z = 4.76 (P < 0.00001)
Events 0 0 2 7 1
10 Total
43 83 86 274 22
508
Events 2 6 9 19 2
38 Total
23 85 91 155 21
375
Weight 7.2% 14.4% 19.6% 54.3% 4.6%
100.0%
M-H, Fixed, 95% CI 0.11 [0.01, 2.18] 0.08 [0.00, 1.38] 0.24 [0.05, 1.06] 0.21 [0.09, 0.48] 0.48 [0.05, 4.88]
0.20 [0.10, 0.39]
Treatment Control Risk Ratio Risk Ratio
M-H, Fixed, 95% CI
0.05 0.2 1 5 20
Favors treatment Favors control
Figure 6 Proton pump inhibitors compared to placebo for the prevention of duodenal ulcer in studies of 8 weeks or longer duration.
Drug, Healthcare and Patient Safety downloaded from https://www.dovepress.com/ by 118.70.13.36 on 22-Aug-2020
Rostom et al Dovepress side effects (RR 1.90, 95% CI 0.77 to 4.67) or symptoms
of abdominal pain or diarrhea between low-dose H2RAs and PPIs.
Part II – COX-2 inhibitors
The search strategy identified 1,169 studies. Of these, 255 references were rated as potentially relevant and the full articles were retrieved. Sixty studies met the inclu-sion criteria, including 4 unique studies obtained from the new drug submission documents on the FDA web site.59–63
An additional 5 “combined analyses studies” were identified by the search strategy and were included for the clinical ulcer complication endpoint (Table 2).64–68
Quality scores of the 60 included trials ranged between 4 to 5 in 47 and between 2 to 3 in 22 studies. Removal of quality score 2 studies did not influence overall results. The use of allocation concealment was implied in all of the included trials, but was adequately described in only 6 studies.
Endoscopic ulcers were the measured endpoints of 17 studies.59–61,63,69–81 Eleven COX-2 studies,78,82–91 and
5 combined analyses65–68,92 reported on the outcome of clinical
GI events (POBs or PUBs).
The remaining trials were either safety or tolerability studies or examined the clinical efficacy of COX-2s compared to tNSAIDS, but allowed for extraction of GI tolerability data.62,67,88,93–111 FDA study data are only presented as part
of sensitivity analyses. Results specifically pertaining to meloxicam are not included herein.
endoscopic ulcer trials
CoX-2s vs non-selective NSAiDs
Seventeen studies with over 10,000 patients assessed the proportion of patients who developed endoscopic ulcers while taking a COX-2 compared to those taking a tNSAID.59–61,63,69–79,81 Seven studies assessed
celecoxib,59,60,69–71,75,81 3 assessed rofecoxib,72–74 2 assessed
etoricoxib,78,79 5 that assessed valdecoxib,61,63,76,77,80 and
2 assessed lumiracoxib.75,81 Some studies assessed more
than one intervention.75,81
endoscopically detected gastro-duodenal ulcers
Thirteen studies with a total of 7,839 patients showed a 74% relative risk reduction (RRR ) in combined gastro-duodenal ulcers with COX-2s vs tNSAIDs (RR 0.26; 95% CI 0.23 to 0.30).69–80,112 This represented a 16% absolute risk reduction
(ARR). Addition of the FDA studies did not significantly alter the results (RR 0.28; 95% CI 0.24 to 0.32). The results analyzed by the dose of COX-2s gave similar results. Results below are for “any dose” combined.
Eleven studies with a total of 6,726 patients compared the safety of a COX-2 to a comparator tNSAID for endoscopic gastric ulcers.69–77,80,112 The use of a COX-2 in this setting
was associated with a 79% RRR in gastric ulcers (RR 0.21; 95% CI 0.18 to 0.25) (Figure 7). This represented a 14% ARR in gastric ulcers with the use of COX-2s compared with tNSAIDs. Addition of the FDA studies did not significantly alter the results (RR 0.26; 95% CI 0.22 to 0.30).
The same 11 studies also compared the proportions of duodenal ulcers that occurred while using a COX-2 vs a tNSAID.69–77,80,112 Compared to using a tNSAID, the use
of a COX-2 was associated with a 66% RRR in duodenal ulcers (RR 0.34; 95% CI 0.25 to 0.45) (Figure 7). This represented a 3% ARR. Addition of the FDA studies did not significantly alter the results (RR 0.29; 95% CI 0.23 to 0.38) Keeping in mind that tNSAID related gastric ulcers were more commonly observed than duodenal ulcer, a trend was observed for greater RRR and ARR in gastric ulcers than for duodenal ulcers with COX-2s, compared to tNSAIDs (RR 0.21 vs 0.34, ARR of 14% vs 3%). This trend was consistent when celecoxib, rofecoxib and valdecoxib were analyzed separately. Analysis by duration The data presented above are for any dose and duration up to 6 months. Subgroup analysis of these studies on the basis of duration (1 to 3 months and 3 to 6 months) did not significantly alter the results.
Analysis by COX-2
Analyses stratified by the individual COX-2s showed that each of the studied agents were safer than comparator tNSAIDs (Figure 8).
Celecoxib
Five studies with a total of 2,439 patients compared celecoxib to non-selective NSAIDs, showing a 79% RRR in total gastro-duodenal ulcers (RR 0.21; 95% CI 0.16 to 0.28) with celecoxib.69–71,75,112 Similar RRR were observed for
gastric ulcers (RR 0.20; 95% CI 0.14 to 0.28) and duodenal ulcers alone (RR 0.29; 95% CI 0.18 to 0.47), as well as when the FDA studies were included (RR 0.26; 95% CI 0.21 to 0.32).
Rofecoxib
Three studies with a total of 1,526 patients compared rofecoxib to non-selective NSAIDs.72–74 In this case, a 74% RRR was
seen with rofecoxib (RR 0.26; 95% CI: 0.21 to 0.32). The results were similar when FDA studies were added to the analysis as well as when the analysis was done only for gastric ulcers (RR 0.20; 95% CI 0.15 to 0.26) and duodenal ulcers alone (RR 0.36; 95% CI 0.14 to 0.93, random effects).
Drug, Healthcare and Patient Safety downloaded from https://www.dovepress.com/ by 118.70.13.36 on 22-Aug-2020
Prevention of NSAiD-related upper Gi toxicity
Dovepress
Table 2 COX-2 included studies
Endpoint Study Comparisons Number
of patients Mean age
Arthritis type
Follow-up
Intervention Comparator Endoscopic
ulcer
Celecoxib
emery70 200 mg bid diclofenac 75 mg bid 655 55 RA 24 weeks
FDA, 021 50 mg bid, 100 mg bid, 200 mg bid
naproxen 500 mg bid; placebo
1,108 unk OA 2, 6, 12 weeks
FDA, 071 200 mg bid diclofenac 75 mg bid; ibuprofen 800 mg tid
1,097 unk OA and RA 4, 8, 12 weeks
Goldstein69 200 mg bid naproxen 500 mg bid 537 57 OA and RA 4, 8, 12 weeks
Simon71 100 mg bid, 200 mg bid,
400 mg bid
naproxen 500 mg bid; placebo
1,149 54 RA 2, 6, 12 weeks
Rofecoxib
Hawkey73 25 mg/day, 50 mg day ibuprofen 800 mg tid 775 62 OA 6 weeks, 3, 6 months
Hawkey74 50 mg/day naproxen 500 mg bid;
placebo
660 51.7 RA 3, 6, 9, 12 weeks
Laine72 25 mg/day, 50 mg/day ibuprofen 800 mg tid 742 62 OA 6 weeks, 3, 6 months
Etoricoxib
Hunt78 – multiple 120 mg/day ibuprofen 800 mg tid 680 62 OA 3, 6, 9, 12 weeks
Hunt79 –
naproxen
120 mg/day naproxen 500 mg bid; placebo
742 54 OA and RA 3, 6, 9, 12 weeks
Valdecoxib
FDA 047 20 mg bid, 40 mg bid naproxen 500 mg bid 1,217 56 OA and RA 26 weeks FDA 063 10 mg/day, 20 mg/day diclofenac 75 mg bid 784 unk OA 1, 2, 4, 6 weeks Kivitz80 5 mg/day, 10 mg/day,
20 mg/day
naproxen 500 mg tid; placebo
1,019 60 OA 2, 6, 12 weeks
Sikes76 10 mg/day, 20 mg/day ibuprofen 800 mg tid;
diclofenac 75 mg bid; placebo
1,052 60 OA 2, 6, 12 weeks
Lumiracoxib
Hawkey74,113 lumiracoxib 200 mg/day,
400 mg/day; celecoxib 200 mg/day
ibuprofen 800 mg tid 1,042 58.7 OA 4, 8, 13 weeks
Kivitz81 lumiracoxib 400 mg/day,
800 mg/day; celecoxib 200 mg bid
ibuprofen 800 mg tid 893 51.7 RA 8, 13 weeks
Clinical ulcer complications
Celecoxib
Goldstein92
com-bined analysis study
25 mg bid to 400 mg bid naproxen 500 mg bid; diclofenac 75 mg bid; ibuprofen 800 mg tid; placebo
11,008 59 OA and RA 2 to 24 weeks
Silverstein82 400 mg bid diclofenac 75 mg bid;
iboprofen 800 mg tid
8,059 60 OA and RA 4, 13, 26 weeks (1 year FDA) Singh91 Success-1 100 mg bid, 200 mg bid naproxen 500 mg bid 13,274 62 OA 6, 12 weeks
Zhao89 50 mg bid, 100 mg bid,
200 mg bid
naproxen 500 mg bid: placebo
1,004 62.2 OA 2, 6, 12 weeks
Rofecoxib
Bombardier83 50 mg/day naproxen 500 mg bid 8,076 58 RA 4, 8, 12 months
Geusens90 25 mg/day, 50 mg/day naproxen 500 mg bid;
placebo
1,023 53.6 RA 2, 4, 8, 12 weeks
(Continued)
Drug, Healthcare and Patient Safety downloaded from https://www.dovepress.com/ by 118.70.13.36 on 22-Aug-2020
Rostom et al Dovepress
Table 2 (Continued)
Endpoint Study Comparisons Number
of patients Mean age
Arthritis type
Follow-up
Intervention Comparator Langman66
combined analysis study
25 mg/day, 50 mg/day ibuprofen 800 mg tid; diclofenac 50 mg tid; nabumetone 1,500 mg/day
5,435 63 OA 6 weeks, 4, 6, 12, 24 months
Lisse88 25 mg/day naproxen 500 mg bid 5,597 63 OA 3, 6, 9, 12 weeks
Saag101 12.5 mg/day, 25 mg/day ibuprofen 800 mg tid 736 61 OA 2, 4, 6 weeks
Saag101 12.5 mg/day, 25 mg/day diclofenac 50 mg tid 693 62 OA up to 1 year
Etoricoxib
Leung87 60 mg/day naproxen 500 mg bid;
placebo
501 63 OA 2, 4, 8, 12 weeks
Ramey68
combined analysis study
5 to 120 mg/day diclofenac 150 mg/day; naproxen 1000 mg/day; ibuprofen 2400 mg/day
5,441 56.7 OA and RA up to 190 weeks
Laine116 MeDAL 60 or 90 mg/day diclofenac 150 mg/day 34 701 63 OA and RA up to 36 months
Valdecoxib Goldstein92
combined analysis study
5 to 80 mg/day naproxen 500 mg bid; diclofenac 75 mg bid; ibuprofen 800 mg tid; placebo
7,445 58.1 OA and RA up to 26 weeks
Lumiracoxib Schnitzer86
TARGeT
400 mg/day naproxen 500 mg bid; ibuprofen 800 mg tid
18,244 63.5 OA 4, 13, 20, 26, 39, 52 weeks COX-2 and PPI
Chan118 celecoxib 200 mg bid diclofenac 75 mg +
omeprazole 20 mg
287 67 OA and RA 24 weeks
Lai119 celecoxib 200 mg daily naproxen 250 mg tid +
lansoprosol 30 mg
142 57 OA and RA 24 weeks
Chan120 celecoxib 200 mg bid celecoxib 200 mg bid;
esomeprazole 20 mg bid
271 71 OA and RA 52 weeks
Tolerability Celecoxib
Bensen95 50 mg bid, 100 mg bid,
200 mg bid
naproxen 500 mg bid; placebo
1,003 62 OA 2, 6, 12 weeks
Geba102 celecoxib 200 mg/day;
rofecoxib 12.5 mg/day, 25 mg/day
acetaminophen 4000 mg/day
382 63 OA 2, 4, 6 weeks
Kivitz122 100 mg/day, 200 mg/day,
400 mg/day
naproxen 500 mg bid; placebo
1,061 62.6 OA 2, 6, 12 weeks
McKenna104 100 mg bid diclofenac 50 mg tid;
placebo
600 62 OA 2, 6 weeks
McKenna105 celecoxib 200 mg/day;
rofecoxib 25 mg/day
placebo 182 62 OA 3, 6 weeks
whelton103 celecoxib 200 mg/day;
rofecoxib 25 mg/day
none 811 74 OA 1, 2, 6 weeks
williams94 200 mg/day placebo 686 63 OA 2, 6 weeks
williams142 100 mg bid, 200 mg/day placebo 718 61.5 OA 2, 6 weeks
(Continued)
Drug, Healthcare and Patient Safety downloaded from https://www.dovepress.com/ by 118.70.13.36 on 22-Aug-2020
Prevention of NSAiD-related upper Gi toxicity
Dovepress
Table 2 (Continued)
Endpoint Study Comparisons Number
of patients Mean age
Arthritis type
Follow-up
Intervention Comparator Rofecoxib
Cannon98 12.5 mg/day 25 mg/day diclofenac 50 mg tid 784 64 OA up to 1 year
Day97 12.5 mg/day, 25 mg/day ibuprofen 800 mg tid 809 64 OA 2, 4, 6 weeks
ehrich99 25 to 125 mg/day placebo 219 64 OA 1, 2, 4, 6 weeks
Myllykangas121 12.5 mg/day naproxen 500 mg bid 944 61.6 OA 2, 4, 6 weeks
Schnitzer100 5 to 50 mg/day placebo 658 55 RA 2, 4, 8 weeks
Truitt96 12.5 mg/day, 25 mg/day nabumetone
1500 mg/day; placebo
341 83 OA 1, 2, 4, 6 weeks
Etoricoxib
Collantes110 90 mg/day naproxen 500 mg bid;
placebo
891 52 RA 2, 4, 8, 12 weeks
Gottesdiener108 Part 1: 5 to 90 mg/day
Part 2: 30 mg/day, 60 mg/day 90 mg/day
Part 1: placebo Part 2: diclofenac 50 mg tid
617 60 OA 1, 2, 4, 6, 8, 14 weeks
Matsumoto111 90 mg/day naproxen 500 mg bid;
placebo
816 56 RA 2, 4, 8, 12 weeks
wiesenhutter123 30 mg/day ibuprofen 2400 mg/day;
placebo
258 61.3 OA 1, 2, 4, 6 weeks
Zacher109 60 mg/day diclofenac 50 mg tid 516 63 OA 2, 4, 6, 8 weeks
Valdecoxib
Bensen107 10 mg/day, 20 mg/day,
40 mg/day
naproxen 500 mg bid; placebo
1,090 55 RA 4, 8, 12 months
FDA 061 10 mg/day, 20 mg/day, 40 mg/day
naproxen 500 mg bid; placebo
1,093 57 RA 12 weeks
Makarowski106 5 mg/day, 10 mg/day naproxen 500 mg bid;
placebo
513 68 OA 3 weeks
Pavelka77 20 mg/day, 40 mg/day diclofenac 75 mg bid 722 56 RA 2, 6, 8, 12, 18,
26 weeks
Lumiracoxib
Geusens124 200 mg/day, 400 mg/day naproxen 500 mg bid 1,124 71 RA 2, 4, 13, 20, 26 weeks
Grifka125 200 mg/day, 400 mg/day placebo 594 61.9 OA 2, 4, 6 weeks
Lehmann126 100 mg/day, 100 mg/day
with 200 mg loading dose for first 2 weeks; celecoxib 200 mg/day
placebo 1,684 62.4 OA 2, 4, 8, 13 weeks
Schnitzer86 50 mg bid, 100 mg bid,
200 mg bid, 400 mg bid
diclofenac 400 mg bid; placebo
583 60.3 OA 4 weeks
Schnitzer86 50 mg bid, 100 mg bid,
200 mg bid, 400 mg bid
diclofenac 400 mg bid; placebo
569 54.4 RA 2, 6, 12 weeks
Tannenbaum141 lumiracoxib 200 mg/day,
400 mg/day; celecoxib 200 mg/day
placebo 1,702 64.3 OA 2, 4, 8, 13 weeks
Abbreviations: unk, unknown; OA, osteoarthritis; PPi, protein pump inhibitors; RA, rheumatoid arthritis.
Drug, Healthcare and Patient Safety downloaded from https://www.dovepress.com/ by 118.70.13.36 on 22-Aug-2020
Rostom et al Dovepress
Study or Subgroup 1.6.7 Gastric ulcers total Emery70 Goldstein69 Hawkey73 Hawkey74 Hawkey75 Kivitz80 Kivitz81 Laine72 Pavelka77 Sikes76 Simon71
Subtotal (95% CI) Total events
Heterogeneity: Chi² = 6.54, df = 10 (P = 0.77); I² = 0% Test for overall effect: Z = 17.28 (P < 0.00001)
1.6.8 Duodenal ulcers total Emery70 Goldstein69 Hawkey73 Hawkey74 Hawkey75 Kivitz80 Kivitz81 Laine72 Pavelka77 Sikes76 Simon71
Subtotal (95% CI) Total events
Heterogeneity: Chi² = 13.49, df = 10 (P = 0.20); I² = 26% Test for overall effect: Z = 7.38 (P < 0.00001)
1.6.9 Combined total Emery70
Goldstein69 Hawkey73 Hawkey74 Hawkey75 Hunt78 − multiple Hunt79 − naprox Kivitz80 Kivitz81 Laine72 Pavelka77 Sikes76 Simon71
Subtotal (95% CI) Total events
Heterogeneity: Chi² = 8.67, df = 12 (P = 0.73); I² = 0% Test for overall effect: Z = 19.61 (P < 0.00001)
Events 5 13 30 13 20 16 14 17 10 11 17 166 4 9 15 2 9 5 4 5 12 3 6 74 8 20 42 15 29 13 11 21 19 44 22 14 23 281 Total 212 269 369 219 763 547 419 364 483 299 423 4367 212 269 369 219 763 547 632 364 483 299 423 4580 212 269 369 219 763 216 235 547 632 364 483 299 423 5031 Events 24 76 85 48 22 16 29 40 31 40 29 440 15 19 10 11 20 2 2 10 14 13 8 124 33 89 88 56 39 24 43 18 27 76 45 49 36 623 Total 218 267 187 220 248 183 199 167 239 294 137 2359 218 267 187 220 248 183 199 167 239 294 137 2359 218 267 187 220 248 215 234 183 199 167 239 294 137 2808 Weight 4.4% 14.2% 21.0% 8.9% 6.2% 4.5% 7.3% 10.2% 7.7% 7.5% 8.1% 100.0% 9.7% 12.5% 8.7% 7.2% 19.9% 2.0% 2.0% 9.0% 12.3% 8.6% 8.0% 100.0% 4.3% 11.8% 15.4% 7.4% 7.8% 3.2% 5.7% 3.6% 5.4% 13.8% 8.0% 6.5% 7.2% 100.0%
M-H, Fixed, 95% CI
0.21 [0.08, 0.55] 0.17 [0.10, 0.30] 0.18 [0.12, 0.26] 0.27 [0.15, 0.49] 0.30 [0.16, 0.53] 0.33 [0.17, 0.66] 0.23 [0.12, 0.42] 0.19 [0.11, 0.33] 0.16 [0.08, 0.32] 0.27 [0.14, 0.52] 0.19 [0.11, 0.33] 0.21 [0.18, 0.25]
0.27 [0.09, 0.81] 0.47 [0.22, 1.02] 0.76 [0.35, 1.66] 0.18 [0.04, 0.81] 0.15 [0.07, 0.32] 0.84 [0.16, 4.27] 0.63 [0.12, 3.41] 0.23 [0.08, 0.66] 0.42 [0.20, 0.90] 0.23 [0.07, 0.79] 0.24 [0.09, 0.69] 0.34 [0.25, 0.45]
0.25 [0.12, 0.53] 0.22 [0.14, 0.35] 0.24 [0.18, 0.33] 0.27 [0.16, 0.46] 0.24 [0.15, 0.38] 0.54 [0.28, 1.03] 0.25 [0.13, 0.48] 0.39 [0.21, 0.72] 0.22 [0.13, 0.39] 0.27 [0.19, 0.37] 0.24 [0.15, 0.39] 0.28 [0.16, 0.50] 0.21 [0.13, 0.34] 0.26 [0.23, 0.30]
COX-2 tNSAID Risk Ratio Risk Ratio
M-H, Fixed, 95% CI
0.1 0.2 0.5 1 2 5 10
Favors experimental Favors control
Figure 7 COX-2 vs tNSAiD for endoscopic ulcers with any COX-2 dose.
Drug, Healthcare and Patient Safety downloaded from https://www.dovepress.com/ by 118.70.13.36 on 22-Aug-2020
Prevention of NSAiD-related upper Gi toxicity
Dovepress
etoricoxib
Two studies, with a total of 900 patients compared etoricoxib to non-selective NSAIDs using the endpoint of endoscopic gastro-duodenal ulcers.78,79 These trials demonstrated a 64%
RRR (RR 0.37; 95% CI 0.18 to 0.77, random effects) with etoricoxib.
valdecoxib
Three studies compared valdecoxib to non-selective NSAIDs in 2,045 patients and demonstrated a 70% RRR in
gastro-duodenal ulcers (RR 0.29; 95% CI 0.21 to 0.39) with valdecoxib.76,77,80 Similar RRR were observed when the analysis
was done for gastric ulcers (RR 0.24; 95% CI 0.18–0.37) and duodenal ulcers alone (RR 0.39; 95% CI 0.21 to 0.70), and when the FDA studies were included in the gastro-duodenal ulcers analysis (RR 0.30; 95% CI 0.24 to 0.39).
Lumiracoxib
Two studies with a total of 1,376 patients compared lumi-racoxib to non-selective NSAIDs.112,113 Lumiracoxib was
Study or Subgroup
3.6.1 Celecoxib gastroduodenal
Emery70 Goldstein69 Hawkey75 Kivitz81 Simon71
Subtotal (95% CI)
Total events
Heterogeneity: Chi² = 0.91, df = 4 (P = 0.92); I² = 0% Test for overall effect: Z = 11.10 (P < 0.00001)
3.6.2 Rofecoxib gastroduodenal
Hawkey73 Hawkey74 Laine72
Subtotal (95% CI)
Total events
Heterogeneity: Chi² = 0.20, df = 2 (P = 0.90); I² = 0% Test for overall effect: Z = 12.55 (P < 0.00001)
3.6.3 Valdecoxib gastroduodenal
Kivitz80 Pavelka77 Sikes76
Subtotal (95% CI)
Total events
Heterogeneity: Chi² = 1.47, df = 2 (P = 0.48); I² = 0% Test for overall effect: Z = 7.75 (P < 0.00001)
3.6.4 Etoricoxib gastroduodenal
Hunt78− multiple Hunt79− naprox
Subtotal (95% CI)
Total events
Heterogeneity: Chi² = 2.63, df = 1 (P = 0.10); I² = 62% Test for overall effect: Z = 4.51 (P < 0.00001)
3.6.5 Lumiracoxib gastroduodenal
Hawkey75 Kivitz81
Subtotal (95% CI)
Total events
Heterogeneity: Chi² = 0.00, df = 1 (P = 0.98); I² = 0% Test for overall effect: Z = 6.72 (P < 0.00001)
Events
8 20 8 4 23
63
42 15 44
101
21 22 14
57
13 11
24
21 15
36
Total
212 269 253 213 423
1370
369 219 364
952
547 483 299
1329
216 235
451
510 419
929 Events
33 89 39 27 36
224
88 56 76
220
18 45 49
112
24 43
67
39 27
66
Total
218 267 248 199 137
1069
187 220 167
574
183 239 294
716
215 234
449
248 199
447 Weight
13.4% 36.7% 16.2% 11.5% 22.3%
100.0%
42.2% 20.2% 37.6%
100.0%
19.7% 44.1% 36.2%
100.0%
35.8% 64.2%
100.0%
58.9% 41.1%
100.0%
M-H, Fixed, 95% CI
0.25 [0.12, 0.53] 0.22 [0.14, 0.35] 0.20 [0.10, 0.42] 0.14 [0.05, 0.39] 0.21 [0.13, 0.34]
0.21 [0.16, 0.28]
0.24 [0.18, 0.33] 0.27 [0.16, 0.46] 0.27 [0.19, 0.37]
0.26 [0.21, 0.32]
0.39 [0.21, 0.72] 0.24 [0.15, 0.39] 0.28 [0.16, 0.50]
0.29 [0.21, 0.39]
0.54 [0.28, 1.03] 0.25 [0.13, 0.48]
0.36 [0.23, 0.56]
0.26 [0.16, 0.44] 0.26 [0.14, 0.48]
0.26 [0.18, 0.39]
COX-2 tNSAID Risk Ratio Risk Ratio
M-H, Fixed, 95% CI
0.2 0.5 1 2 5
Favors experimental Favors control
Figure 8 Gastroduodenal ulcers analysed by individual COX-2 inhibitor compared to tNSAiDs.
Drug, Healthcare and Patient Safety downloaded from https://www.dovepress.com/ by 118.70.13.36 on 22-Aug-2020
Rostom et al Dovepress associated with a 74% RRR in gastro-duodenal ulcers
(RR 0.26; 95% CI 0.18 to 0.39). Similar results were observed for gastric ulcers (RR 0.25; 95% CI 0.16 to 0.40) and duodenal ulcers (RR 0.20; 95% CI 0.09 to 0.43) when they were considered alone.
Analysis by comparator NSAiDs
Naproxen
Five studies compared either celecoxib or valdecoxib to naproxen in 2,734 patients. These showed a 75% RRR in endoscopic gastro-duodenal ulcers in favor of the COX-2s (RR 0.25; 95% CI 0.20 to 0.32). Results were similar when the FDA studies were included in the analysis (RR 0.27; 95% CI: 0.22 to 0.32).69,71,74,79,80
ibuprofen
Six studies which enrolled over 3,800 patients (2 rofecoxib,72,73
1 etoricoxib,78 2 lumiracoxib,112,113 and 1 valdecoxib76)
showed a 73% RRR in gastro-duodenal ulcers with COX-2s compared with ibuprofen (RR 0.27; 95% CI 0.23 to 0.32). Results were similar when the FDA studies were included in the analysis (RR 0.28; 95% CI 0.23 to 0.32).
Diclofenac
Three studies which enrolled a total of 1,596 patients demonstrated a 75% RRR in gastro-duodenal ulcers with COX-2s compared to diclofenac (RR 0.25; 95% CI 0.18 to 0.35). This effect was somewhat reduced when the FDA studies were included in the analysis (RR 0.36; 95% CI 0.27 to 0.47).70,76,77
Similar results were obtained when individual COX-2s were compared with the individual non-selective NSAIDs.
COX-2s vs placebo
Eight studies with a total of 4,081 patients compared low- and high-dose COX-2s to placebo.71–74,76,78–80 Low
dose COX-2s appeared to demonstrate no greater risk of gastric or gastro-duodenal ulcers than placebo. However, high doses of COX-2s appeared to raise the relative risk of gastric (RR 1.22; 95% CI 0.83 to 1.80), duodenal (RR 1.29; 95% CI 0.63 to 2.66), and combined gastro-dudenal ulcers (RR 1.57; 95% CI 0.96 to 2.56, random effects), though these trends missed statistical significance. Clinical GI events COX-2s vs non-selective NSAIDs Nine studies with a total of 94,294 patients assessed the safety of COX-2s by using the clinically important endpoint of ulcer complica-tion, POB.65,66,68,82,83,92,114–116 Three of these trials studied
celecoxib,82,92,115 2 studied rofecoxib,66,83 2 trials evaluated
etoracoxib,68,116 and 1 each evaluated valdecoxib65 and
lumiracoxib114 separately. Overall, the use of these COX-2s
was associated with a 57% RRR in POBs (RR , 0.43; 95% CI 0.28 to 0.67, random effects), compared with using tNSAIDs. Removal of the combined analyses studies had no influence on the result (RR 0.39; 0.29 to 0.53) and the inclusion of the FDA 12-month CLASS study data117 did
not alter the results (RR 0.42; 95% CI 0.33 to 0.54). The 60% RRR in these analyses represents an ARR of 0.4% (Figure 9).
Fourteen studies compared COX-2s with tNSAIDs by using PUB as the study endpoint.65,66,68,78,82,83,87–90,92,114–116
In this analysis, the use of a COX-2 was associated with a 57% RRR in PUBs (RR 0.43; 95% CI 0.34 to 0.55, random effects). Removal of the combined analyses studies eliminated the observed heterogeneity but had little effect on the point estimate (RR 0.49; 95% CI 0.41 to 0.58). Similarly, the use of the FDA CLASS data did not significantly alter the estimate (RR 0.42; 95% CI 0.33 to 0.53, random effects) (Figure 10).
Analyses stratified by cyclooxygenase-2s Celecoxib
Four studies with 31,106 assessed the effect celecoxib vs non-selective NSAIDs on clinical GI events (POBs or PUBs).82,89,92 Celecoxib use was associated with a 77% RRR
in POBs (RR 0.23; 95% CI 0.07 to 0.76, random effects) and a 61% RRR in PUBs (RR 0.39; 95% CI 0.21 to 0.73, random effects). Removal of the combined analyses study92
eliminated the heterogeneity observed in both the POB (RR 0.42; 95% CI 0.22 to 0.80) and PUBs (RR = 0.34; 95% CI 0.22 to 0.80) analyses. The use of the FDA 12-month CLASS data did not alter the RR estimates for POBs or PUBs significantly.
Rofecoxib
Four studies with 19,288 patients assessed the effect of rofecoxib vs non-selective NSAIDs on clinical GI events (POBs or PUBs).66,83,88,90 Rofecoxib use reduced the relative
risk of POBs by 58% (RR 0.42; 95% CI 0.24 to 0.73) and the relative risk of PUBs by 56% (RR 0.44; 95% CI 0.34 to 0.58). Removal of the combined analysis study did not alter the point estimates.
valdecoxib
One combined analysis study with 6,461 patients evaluated the effect of valdecoxib on POBs and PUBs.65 Valdecoxib
reduced the relative risk of POBs by 65% (RR 0.35; 95% CI 0.14 to 0.87) and the relative risk of PUBs by 77% (RR 0.23; 95% 0.15 to 0.36).
Drug, Healthcare and Patient Safety downloaded from https://www.dovepress.com/ by 118.70.13.36 on 22-Aug-2020
Prevention of NSAiD-related upper Gi toxicity
Dovepress
etoricoxib
Four studies with 10,856 patients evaluated the effect of etoricoxib on POBs68,116 and PUBs.78,87 Etoricoxib
demonstrated a nonsignificant trend in reducing the risk of POBs (RR 0.82; 95% CI 0.44 to 1.51, random effects), but it significantly reduced the RR of PUBs by 46% (RR 0.64; 95% CI 0.42 to 0.96).
Lumiracoxib
One study with 18,244 patients demonstrated a significant 64% RRR in POBs (RR 0.36; 95% CI 0.24 to 0.55) and a 44% RRR in PUBs (RR 0.56; CI 0.41 to 0.78) with the use of lumiracoxib, compared with using non-selective NSAIDs.114
Analysis by comparator NSAiDs
In general COX-2s appeared to maintain their safety advantage regardless of the comparator non-selective NSAID. COX-2s were statistically superior to naproxen (RR 0.34; 95% CI 0.24 to 0.48), and ibuprofen (RR 0.46; 95% CI 0.30 to 0.71) for the POB endpoint. The data comparing COX-2s to diclofenac are predominately derived from 2 studies and heavily influenced by the CLASS trial data which showed no significant difference between celecoxib vs diclofenac.82,92 In the current analysis, celecoxib
demonstrated a non-significant trend towards fewer POBs than diclofenac (RR 0.31; 95% CI 0.06 to 1.61) while a statistically significant 59% RRR in PUBs was observed (RR 0.41; 95% CI 0.30 to 0.55).
Study or Subgroup
Goldstein92
Singh91 SUCCESS-I
Langman66
Schnitzer114− TARGET
Goldstein65
Bombardier83
Silverstein82
Ramey68
MEDAL
Total (95% CI)
Total events
Heterogeneity: Tau² = 0.24; Chi² = 26.03, df = 8 (P = 0.001); I² = 69% Test for overall effect: Z = 3.91 (P < 0.0001)
Events 2 2 2 29 8 16 11 19 78 167 Total 6376 8800 3357 9117 4362 4047 3987 3226 17412 60684 Events 9 7 3 83 11 37 20 23 82 275 Total 2768 4394 1564 9127 2099 4029 3981 2215 17289 47466 Weight 5.5% 5.3% 4.4% 16.4% 10.3% 14.2% 12.3% 14.0% 17.7% 100.0%
M-H, Random, 95% CI
0.10 [0.02, 0.45] 0.14 [0.03, 0.69] 0.31 [0.05, 1.86] 0.35 [0.23, 0.53] 0.35 [0.14, 0.87] 0.43 [0.24, 0.77] 0.55 [0.26, 1.14] 0.57 [0.31, 1.04] 0.94 [0.69, 1.29]
0.43 [0.28, 0.66]
Risk Ratio
Control Risk Ratio
Treatment
M-H, Random, 95% CI
0.1 0.2 0.5 1 2 5 10 Favors treatment Favors control
Figure 9 POBs (perforation, obstruction or bleeding) with COX-2s vs tNSAiDs.
Study or Subgroup
Bombardier83
Geusens90
Goldstein92
Goldstein65
Hunt78 – multiple
Langman66
Leung87
Lisse88
MEDAL Ramey68
Schnitzer114 – TARGET
Silverstein82
Singh91 SUCCESS-I
Zhao89
Total (95% CI)
Total events
Heterogeneity: Tau² = 0.10; Chi² = 39.65, df = 13 (P = 0.0002); I² = 67% Test for overall effect: Z = 6.93 (P < 0.00001)
Events 56 1 12 28 30 19 0 2 176 40 87 30 18 0 499 Total 4047 592 6376 4362 3142 3357 224 2785 17412 3226 9117 3987 8800 602 68029 Events 121 4 26 58 41 16 5 9 246 55 186 49 18 1 835 Total 4029 142 2768 2099 1828 1564 221 2772 17289 2215 9127 3981 4394 198 52627 Weight 11.5% 1.1% 6.6% 9.5% 9.2% 6.8% 0.7% 2.1% 13.1% 10.2% 12.3% 9.5% 6.9% 0.5% 100.0%
M-H, Random, 95% CI
0.46 [0.34, 0.63] 0.06 [0.01, 0.53] 0.20 [0.10, 0.40] 0.23 [0.15, 0.36] 0.43 [0.27, 0.68] 0.55 [0.29, 1.07] 0.09 [0.00, 1.61] 0.22 [0.05, 1.02] 0.71 [0.59, 0.86] 0.50 [0.33, 0.75] 0.47 [0.36, 0.60] 0.61 [0.39, 0.96] 0.50 [0.26, 0.96] 0.11 [0.00, 2.69]
0.43 [0.34, 0.54]
M-H, Random, 95% CI
0.1 0.2 0.5 1 2 5 10
Favors treatment Favors control
Risk Ratio
Control Risk Ratio
Treatment
Figure 10 PUBs (POBs [perforation, obstruction or bleeding] or symptomatic ulcer) with COX-2s vs tNSAiDs.
Drug, Healthcare and Patient Safety downloaded from https://www.dovepress.com/ by 118.70.13.36 on 22-Aug-2020