c
�Owned by the authors, published by EDP Sciences, 2017
Basic features of proton-proton interactions at ultra-relativistic
energies and RFT-based quark-gluon string model
E. Zabrodin1,2,3,a, L. Bravina2,3, and J. Bleibel4,5
1Skobeltsyn Institute of Nuclear Physics, Moscow State University, RU-119991 Moscow, Russia 2Department of Physics, University of Oslo, PB 1048 Blindern, N-0316 Oslo, Norway
3National Research Nuclear University "MEPhI" (Moscow Engineering Physics Institute), Kashirskoe high-way 31, Moscow, RU-115409, Russia
4Max-Planck-Institut für Intelligente Systeme, Heisenbergstr. 3, D-70569 Stuttgart, Germany
5Institut für Augewandte Physik, Universität Tübingen, Auf der Morgenstelle 10, D-72076 Tübingen, Ger-many
Abstract. Proton-proton collisions at energies from √s=200 GeV up to√s=14 TeV are studied within the microscopic quark-gluon string model. The model is based on Gribov’s Reggeon Field Theory accomplished by string phenomenology. Comparison with experimental data shows that QGSM describes well particle yields, rapidity- and transverse momentum spectra, rise of mean�pT�and forward-backward multiplicity cor-relations. The latter arise in QGSM because of the addition of various processes with
different mean multiplicities. The model also indicates fulfillment of extended
longitu-dinal scaling and violation of Koba-Nielsen-Olesen scaling at LHC. The origin of both features is traced to short-range particle correlations in the strings. Predictions are made for √s=14 TeV.
1 Introduction
Despite the significant progress achieved in the last years,the theory of multiparticle production in elementary proton-proton collisions at ultrarelativistic energies is not completed yet. We all know, of course, that the processes with large momentum transferQ2are well described by the perturbative chromodynamics (pQCD). Unfortunately, even at very high energies the main contribution to multi-particle production in hadronic interactions comes from the processes with small momentum transfer. This means that the running coupling constantαs(Q2) is not small and, therefore, the perturbative series expansion is not very helpful. Other techniques, based on non-perturbative methods, should be utilized. The quark-gluon string model (QGSM) [1] and similar to it dual parton model (DPM) [2] is one of the possible approaches to solution of this very interesting and difficult problem. Both models
are based on the Reggeon Field theory (RFT) [3]. Basic principles of the QGSM are sketched below.
2 The QGSM model
The quark-gluon string model, formulated about 35 years ago [1], employs the 1/Nseries expansion of the amplitude of a process in QCD, whereNis either the number of colors [4] or the number of flavors [5]. This method is also calledtopological expansion, because of emergence of diagrams of various topologies. Although it is not possible to assign weights for the diagrams within the QCD, there is one-to-one mapping between the diagrams in 1/N-expansion and the processes with exchange of Regge singularities in thet-channel. For instance, exchange of quantum numbers via Reggeons corresponds toplanardiagrams, whereas thecylinderdiagrams are represented by the reactions with-out the quantum number exchange. The latter proceed via the exchange of Pomerons. Therefore, the perturbative Reggeon Field Theory (RFT) [3] is directly linked to quantum chromodynamics.
The Monte Carlo version of the QGSM [6] employs statistical weights, hadron structure functions and leading quark fragmentation functions obtained from the Regge approach in [1] to choose subpro-cesses of string production, to compute mass and momentum of strings and to simulate string decays, respectively. The hadron-hadron collision part of the model includes single and double diffraction
subprocesses, antibaryon-baryon annihilation and elastic scattering. The hadron inelastic interaction cross sectionσinel(s) = σtot(s)−σel(s) is split further into the cross section for single diffractive
interactionsσS D(s) and the cross section for non-diffractive reactionsσND(s), similar to analysis of experimental data. By means of the Abramovskii-Gribov-Kancheli (AGK) cutting rules [7] the inelas-tic non-diffractive interaction cross sectionσND(s) can be expressed via the sum of the cross sections for the production ofn=1,2, . . .pairs of quark-gluon strings, or cut Pomerons, and the cross section of double diffractive process
σND(s)=
∞
�
n=1
σn(s)+σDD(s). (1)
To findσn(s) one can utilize the quasi-eikonal model [8, 9] which states that
σtot(s) =
∞
�
n=0
σn(s)=σP f�z 2
�
, (2)
σn(s) = σP
nz
1−exp (−z)
n−1
�
k=0
zk k!
, k≥1 (3)
σ0 = σP �f�z 2
� −f(z)
�
, (4)
f(z) =
∞
�
ν=1
(−z)ν−1
νν! , (5)
Here
σP = 8πγPexp (∆ξ), (6)
z = 2CγP
(R2 P+α′Pξ)
exp (∆ξ). (7)
The cross sectionσ0corresponds to diffraction contribution. The parametersγPandRPare Pomeron-nucleon vertex parameters, quantity∆ ≡αP(0)−1, andαP(0) andα′
2 The QGSM model
The quark-gluon string model, formulated about 35 years ago [1], employs the 1/Nseries expansion of the amplitude of a process in QCD, whereN is either the number of colors [4] or the number of flavors [5]. This method is also calledtopological expansion, because of emergence of diagrams of various topologies. Although it is not possible to assign weights for the diagrams within the QCD, there is one-to-one mapping between the diagrams in 1/N-expansion and the processes with exchange of Regge singularities in thet-channel. For instance, exchange of quantum numbers via Reggeons corresponds toplanardiagrams, whereas thecylinderdiagrams are represented by the reactions with-out the quantum number exchange. The latter proceed via the exchange of Pomerons. Therefore, the perturbative Reggeon Field Theory (RFT) [3] is directly linked to quantum chromodynamics.
The Monte Carlo version of the QGSM [6] employs statistical weights, hadron structure functions and leading quark fragmentation functions obtained from the Regge approach in [1] to choose subpro-cesses of string production, to compute mass and momentum of strings and to simulate string decays, respectively. The hadron-hadron collision part of the model includes single and double diffraction
subprocesses, antibaryon-baryon annihilation and elastic scattering. The hadron inelastic interaction cross sectionσinel(s) = σtot(s)−σel(s) is split further into the cross section for single diffractive
interactionsσS D(s) and the cross section for non-diffractive reactionsσND(s), similar to analysis of experimental data. By means of the Abramovskii-Gribov-Kancheli (AGK) cutting rules [7] the inelas-tic non-diffractive interaction cross sectionσND(s) can be expressed via the sum of the cross sections for the production ofn=1,2, . . .pairs of quark-gluon strings, or cut Pomerons, and the cross section of double diffractive process
σND(s)=
∞
�
n=1
σn(s)+σDD(s). (1)
To findσn(s) one can utilize the quasi-eikonal model [8, 9] which states that
σtot(s) =
∞
�
n=0
σn(s)=σP f�z 2
�
, (2)
σn(s) = σP
nz
1−exp (−z)
n−1
�
k=0
zk k!
, k≥1 (3)
σ0 = σP �f�z 2
� −f(z)
�
, (4)
f(z) =
∞
�
ν=1
(−z)ν−1
νν! , (5)
Here
σP = 8πγPexp (∆ξ), (6)
z = 2CγP
(R2 P+α′Pξ)
exp (∆ξ). (7)
The cross sectionσ0corresponds to diffraction contribution. The parametersγPandRPare Pomeron-nucleon vertex parameters, quantity∆ ≡αP(0)−1, andαP(0) andα′
P is the intercept and the slope of the Pomeron trajectory, respectively. The quantityCtakes into account the deviation from the pure eikonal approximation (C=1) due to intermediate inelastic diffractive states,ξ=ln (s/s0) ands0is a scale parameter. Note that at very high energies the enhanced diagrams [10], describing the multiple
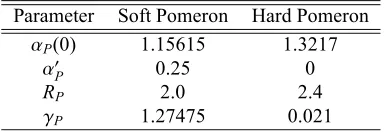
Table 1.Parameters of both soft and hard Pomeron used in the present calculations. Parameter Soft Pomeron Hard Pomeron
αP(0) 1.15615 1.3217
α′
P 0.25 0
RP 2.0 2.4
γP 1.27475 0.021
gluon production from Pomeron vertices, can violate [11] the AGK cutting rules. These diagrams, however, are not implemented in the MC version of QGSM employed for present calculations.
At ultrarelativistic energies the model includes the new processes which represent the hard (multi)Pomeron exchanges. - The concept of soft and (semi)hard Pomerons is attributed to a ma-jor part of Monte Carlo models based on RFT, see [2, 12–14]. - Parameters of the soft and hard Pomerons used in present calculations are listed in Table 2. We see that the intercept of hard Pomeron trajectory is significantly larger than that of the soft Pomeron, whereas its slope is zero.
The diagrams describing subprocesses in ultrarelativistic pp collisions are displayed in Fig. 1. Here diagram (a) shows the soft multi-Pomeron exchange, diagram (b) represents both hard and soft Pomeron exchange, diagrams (c) and (d) show the single diffractive (SD) process with small (c) and
large (d) mass excitation, and diagrams (e)-(g) display double diffractive (DD) processes with large (e)
and small (f) mass excitation, and central diffraction (g). The cross sections of SD and DD processes
inppcollisions were calculated within the QGSM in [15]. In our MC version, we utilize the following parametrization of these results proposed in [16]
σS D(s) = 0.68
1+36
s
ln (0.2s)+0.6, (8)
σDD(s) = 0.27 lns+1.65. (9)
Cross sections of both processes rise asσD∝lns, which satisfies the Froissart limitσtot ∝(lns)2.
Cross sectionsσtot, σel, σS DandσDDobtained by QGSM are compared in Fig. 2 with the pre-dictions of other RFT-based models [14, 17–20]. At Tevatron energy √s = 1.8 TeV all models agree within 5% accuracy limit for all cross sections except of the double-diffraction one, whereas
at √s = 14 TeV the model predictions start to deviate. Still, results for σtot andσS Dare close to each other. Two versions of the Durham model, KMR-1 and KMR-2, predict excess of about 50% of double-diffraction cross section compared to other models. QGSM results are quite close to the
cal-culations of the GLMM model [17]. QGSJET model [14], which also employs the scheme with soft and hard Pomerons, yields larger total and elastic cross sections at √s=14 TeV. Further discussion
of the differences and similarities between the models can be found in [18].
It is easy to see that the main contribution to particle production inppcollisions at ultrarelativistic energies comes from the multi-Pomeron exchanges. The amplitude of then-Pomeron exchange is suppressed by factorN12n, but it grows proportionally toss
0
n∆
. The last term dominates over the suppression factor at LHC energies.
conser-(a) (b)
(c) (d)
(e) (f) (g)
p
p
p
p
p
p
p
p
p
p
p
p
p
p
Figure 1. Diagrams taken into account in QGSM in the modeling ofppinteractions at ultrarelativistic en-ergies: (a) multi-Pomeron exchange, (b) (semi)hard gluon-gluon interaction and soft Pomeron exchange, (c)-(d) single diffraction with high-mass and low-mass excitation, (e)-(f) double diffraction with low-mass and high-mass excitation, (g) central diffraction.
1 10 102
1 10 102
10-1 1 10 10-1 1 10
σ
[mb]
σ
[mb]
√s [TeV] √s [TeV]
(a) (b)
(c) (d)
GLMM GLM QGSM
KMR_1 KMR_2 QGSJET_2
total elastic
SD DD
Figure 2.Model predictions for (a) total, (b) elastic, (c) single-diffractive and (d) double-diffractive cross sec-tions as funcsec-tions of √s. The models are as follows: GLMM (circles) [17], GLM (squares) [18], QGSM (crosses), KMR-1 (triangles) [19], KMR-2 (diamonds) [20], and QGSJET-2 (stars) [14]. Dashed lines between the QGSM points are drawn to guide the eye.
vation. The transverse momenta of the produced quarks and diquarks obey the power-law probability
f(p2
T)dp2T = 3D bπ2(s)(1+Dp2T)−4dp2T , (10) b2(s) = 0.325+0.016 lns, D=0.34 (GeV/c)−2 (11) QGSM was successfully extended to the description of hadron-nucleus and nucleus-nucleus col-lisions at energies spanning from several GeV up to energies available at RHIC and LHC, see, e.g., [22–30]. Our present study, however, deals merely with proton-proton collisions in the energy range 200 GeV≤ √s≤14 TeV.
3 Results
3.1 Transverse momentum and rapidity distributions
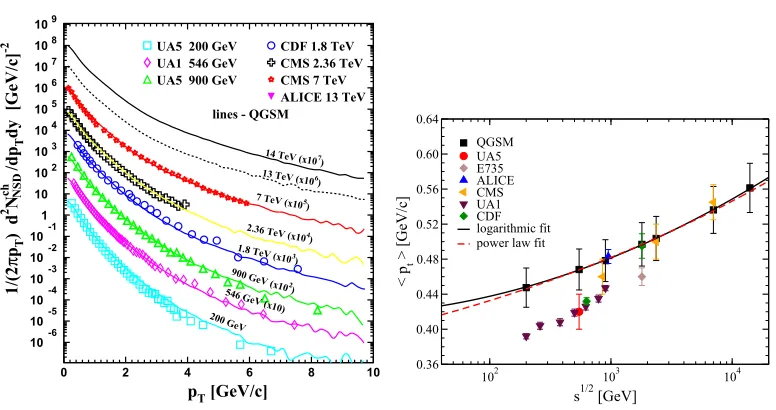
Here results for inelastic and non-single diffractive ppcollisions are presented. Figure 3 displays
dependence of the invariant cross sectionEddp3σ3 of charged hadrons on their transverse momentum pT in NSD events. Calculations are performed for c.m. energies varying from 200 GeV to 14 TeV. Experimental data used for the comparison are taken from [31–43]. One can see that the combination of soft and hard processes in the model describes fairly well thepT-spectra in the interval 0≤pT ≤
(a) (b)
(c) (d)
(e) (f) (g)
p p p p p p p p p p p p p p
Figure 1. Diagrams taken into account in QGSM in the modeling ofppinteractions at ultrarelativistic en-ergies: (a) multi-Pomeron exchange, (b) (semi)hard gluon-gluon interaction and soft Pomeron exchange, (c)-(d) single diffraction with high-mass and low-mass excitation, (e)-(f) double diffraction with low-mass and high-mass excitation, (g) central diffraction.
1 10 102 1 10 102
10-1 1 10 10-1 1 10
σ
[mb]
σ
[mb]
√s [TeV] √s [TeV]
(a) (b) (c) (d) GLMM GLM QGSM KMR_1 KMR_2 QGSJET_2 total elastic SD DD
Figure 2.Model predictions for (a) total, (b) elastic, (c) single-diffractive and (d) double-diffractive cross sec-tions as funcsec-tions of √s. The models are as follows: GLMM (circles) [17], GLM (squares) [18], QGSM (crosses), KMR-1 (triangles) [19], KMR-2 (diamonds) [20], and QGSJET-2 (stars) [14]. Dashed lines between the QGSM points are drawn to guide the eye.
vation. The transverse momenta of the produced quarks and diquarks obey the power-law probability
f(p2
T)dp2T = 3D bπ2(s)(1+Dp2T)−4dp2T, (10) b2(s) = 0.325+0.016 lns, D=0.34 (GeV/c)−2 (11) QGSM was successfully extended to the description of hadron-nucleus and nucleus-nucleus col-lisions at energies spanning from several GeV up to energies available at RHIC and LHC, see, e.g., [22–30]. Our present study, however, deals merely with proton-proton collisions in the energy range 200 GeV≤ √s≤14 TeV.
3 Results
3.1 Transverse momentum and rapidity distributions
Here results for inelastic and non-single diffractive ppcollisions are presented. Figure 3 displays
dependence of the invariant cross sectionEddp3σ3 of charged hadrons on their transverse momentum pT in NSD events. Calculations are performed for c.m. energies varying from 200 GeV to 14 TeV. Experimental data used for the comparison are taken from [31–43]. One can see that the combination of soft and hard processes in the model describes fairly well thepT-spectra in the interval 0≤ pT ≤
10 GeV/c for all energies. The slopes of the distributions become less steep with rising collision
10-6 10-5 10-4 10-3 10-2 10-1 1 10 102 103 104 105 106 107 108 109
0 2 4 6 8 10
UA5 200 GeV UA1 546 GeV UA5 900 GeV
CDF 1.8 TeV CMS 2.36 TeV CMS 7 TeV ALICE 13 TeV lines - QGSM
14 TeV (x107 ) 13 TeV (x106
) 7 TeV (x105
) 2.36 TeV (x104 ) 1.8 TeV (x10
3) 900 GeV (x10
2) 546 GeV (x10)
200 GeV
pT [GeV/c]
1/(2
π
pT
) d
2 N ch NSD /dp
T
dy [GeV/c]
-2
Figure 3. Transverse momentum distributions of the invariant cross section of charged particles in NSDpp
collisions obtained in QGSM at|y| ≤ 2.5 for energies
from 200 GeV up to 14 TeV. Data are taken from [31– 33, 39, 41].
102 103 104
s1/2 [GeV]
0.36 0.40 0.44 0.48 0.52 0.56 0.60 0.64
< pt
> [GeV/c] QGSM UA5 E735 ALICE CMS UA1 CDF logarithmic fit power law fit
Figure 4. �pT�vs. √s. Squares indicate the QGSM results; other symbols show the experimental data from
[31–34, 37, 41]. Solid and dashed lines present fit to
Eq. (12) and Eq. (13), respectively.
energy, i.e. the spectra become harder because of the increasing contribution of the hard processes. This leads to increase of the average transverse momentum of charged hadrons shown in Fig. 4. Here the model results are plotted onto the experimental data, obtained inppand ¯ppinteractions at
√s
≤7 TeV. The LHC data show clearly a faster rise of the meanpTcompared to linear extrapolation
�pT� = a+blnsof data below 900 GeV. Two parametrizations of�pT� were proposed. The first
one is purely phenomenological quadratic dependence on lns, and the second one is a power-law dependence onE = √s/2 obtained within the color glass condensate (CGC) approach [44, 45]. By fitting the QGSM results, we got the following parameters forboth approximations
�pT� = 0.417−0.0035 lns+0.00059 ln2s, (12)
�pT� = 0.243+0.12E0.1107. (13)
Both curves are shown in Fig. 4 also. We see that the curves almost coincide within the whole investigated energy range, and so it is impossible to discriminate between the two parametrizations. Note, however, that Eq. (13) contains one less parameter compared to Eq. (12) because the exponent 0.1107 is not a free parameter but equals to one half of the exponent of the power-law fit to c.m. energy dependence of magnitudes ofdNcharge/dηdistributions at midrapidity [44, 45].
To check this correspondence, thedN/dηdistributions of charged hadrons in inelastic and NSD events are displayed in Fig. 5(a) and Fig. 5(b), respectively. Comparison with experimental data shows that QGSM correctly reproduces the data in both central and fragmentation region. The charged particle density at midrapidity increases with rising √s, i.e., no Feynman scaling [46] is observed at LHC. The model indicates further rise of the central charged particle density at√s=14 TeV of about
20% compared to that at√s=7 TeV; the values at midrapidity aredNinel/dη=5.8 anddNNS D/dη=
0 2 4 6 8
0 5
(a) CMS 13 TeV
CMS+TOTEM 8 TeV CMS 7 TeV ALICE 2.36 TeV UA5 900 GeV UA5 546 GeV UA5 200 GeV
lines - QGSM 1
2 3
4
5
6 7 8
0 5
(b) (1) - 14 TeV
(2) - 13 TeV (3) - 8 TeV (4) - 7 TeV
(5) - 2.36 TeV (6) - 900 GeV (7) - 546 GeV (8) - 200 GeV 1
2
4
5 6
7 8
inel NSD
η η
dN
ch /d
η
Figure 5. Pseudorapidity spectra of charged hadrons in (a) inelastic and (b) NSDpp collisions at energies from 200 GeV up to 14 TeV. Lines show the QGSM calculations, symbols denote the data taken from [31, 33, 36, 39, 41, 43].
0 2 4 6
8 QGSMdata (a)
logarithmic fit
0 2 4 6 8
102 103 104
(b) QGSM
data
logarithmic fit power-law fit
s [GeV]1/2
dN
ch NSD /d
η
(
η
=0)
dN
ch inel /d
η
(
η
=0)
Figure 6.The density of charged particles at midrapid-ity as a function of√sfor (a) inelastic and (b) NSDpp
collisions. Dashed lines show the results of the fit to
quadratic dependence on lns, whereas dotted line (b)− to the power-law dependence∼ √sλ.
extrapolation of the data at lower energies. The extrapolation method relies on the proportionality to lnsof both the height and the width ofdN/dη-distributions, and the energy independence of the slopes ofη-spectra. This providesdNinel/dη(η=0)=4.6±0.4 anddNNS D/dη(η=0)=5.25±0.7 [47]. Both results are, obviously, significantly below the LHC experimental data.
The increase of midrapidity density as function of √sis presented in Fig. 6 for both inelastic and non-single diffractive interactions. One can see clearly the deviation from the linear rise, proportional
to lns, which is valid for energies below 2 TeV. Similarly topTspectra,dN/dηdistributions calculated by QGSM were also fitted to the quadratic logarithmic dependence and to the power-law dependence, respectively, in the energy interval 200 GeV≤ √s≤14 TeV. The results are as follows:
dNinel dη
η=0(s)
= 4.36−0.507 lns+0.03 ln2s, (14)
dNNS D dη
η=0(s)
= 5.015−0.60 lns+0.036 ln2s, (15)
dNNS D dη
η=0(s)
= 0.77E0.22. (16)
Both fitting curves are plotted onto the spectra in Fig. 6. Again, there is no visible difference
0 2 4 6 8 0 5 (a) CMS 13 TeV
CMS+TOTEM 8 TeV CMS 7 TeV ALICE 2.36 TeV UA5 900 GeV UA5 546 GeV UA5 200 GeV
lines - QGSM 1 2 3 4 5 6 7 8 0 5 (b) (1) - 14 TeV
(2) - 13 TeV (3) - 8 TeV (4) - 7 TeV
(5) - 2.36 TeV (6) - 900 GeV (7) - 546 GeV (8) - 200 GeV 1 2 4 5 6 7 8 inel NSD η η dN
ch /d
η
Figure 5. Pseudorapidity spectra of charged hadrons in (a) inelastic and (b) NSDpp collisions at energies from 200 GeV up to 14 TeV. Lines show the QGSM calculations, symbols denote the data taken from [31, 33, 36, 39, 41, 43].
0 2 4 6
8 QGSMdata (a)
logarithmic fit 0 2 4 6 8
102 103 104
(b) QGSM
data
logarithmic fit power-law fit
s [GeV]1/2
dN
ch NSD /d
η
(
η
=0)
dN
ch inel /d
η
(
η
=0)
Figure 6.The density of charged particles at midrapid-ity as a function of√sfor (a) inelastic and (b) NSDpp
collisions. Dashed lines show the results of the fit to
quadratic dependence on lns, whereas dotted line (b)− to the power-law dependence∼ √sλ.
extrapolation of the data at lower energies. The extrapolation method relies on the proportionality to lnsof both the height and the width ofdN/dη-distributions, and the energy independence of the slopes ofη-spectra. This providesdNinel/dη(η=0)=4.6±0.4 anddNNS D/dη(η=0)=5.25±0.7 [47]. Both results are, obviously, significantly below the LHC experimental data.
The increase of midrapidity density as function of √sis presented in Fig. 6 for both inelastic and non-single diffractive interactions. One can see clearly the deviation from the linear rise, proportional
to lns, which is valid for energies below 2 TeV. Similarly topTspectra,dN/dηdistributions calculated by QGSM were also fitted to the quadratic logarithmic dependence and to the power-law dependence, respectively, in the energy interval 200 GeV≤ √s≤14 TeV. The results are as follows:
dNinel dη η=0(s)
= 4.36−0.507 lns+0.03 ln2s, (14)
dNNS D dη
η=0(s)
= 5.015−0.60 lns+0.036 ln2s, (15)
dNNS D dη
η=0(s)
= 0.77E0.22. (16)
Both fitting curves are plotted onto the spectra in Fig. 6. Again, there is no visible difference
be-tween the two parametrizations. Note that the exponentλ = 0.22 is indeed twice larger than the corresponding exponent of the power-law fit to the mean-pTdata.
0 2 4 6 8
-10 -5 0
pp :
14 TeV 13 TeV 8 TeV 7 TeV 2.36 TeV 1.8 TeV 900 GeV 546 GeV 200 GeV
y - ymax
dN
ch NSD /dy
Figure 7. The distributions 1
σNS D
dσNS D
dy of charged
hadrons as functions of rapidity differencey−ymax ob-tained in QGSM for pp collisions at all energies in question. 10-4 10-3 10-2 10-1 100 101 102 P(N ch )
ALICE pp @ 900 GeV |η| < 0.5 ALICE pp @ 900 GeV |η| < 1.0 *20 ALICE pp @ 900 GeV |η| < 1.3 *400
0 10 20 30 40 50 60 70
Nch 10-4 10-3 10-2 10-1 100 101 102 P(N ch )
ALICE pp @ 2.36 TeV |η| < 0.5 ALICE pp @ 2.36 TeV |η| < 1.0 *20 ALICE pp @ 2.36 TeV |η| < 1.3 *400
Figure 8.Charged particle multiplicity distributions in |η|<0.5,|η|<1.0 and|η|<1.3 intervals, obtained in
QGSM forppcollisions at (a) √s =900 GeV and at (b) √s =2.36 TeV. Open symbols denote the ALICE
data [36].
3.2 Extended longitudinal scaling and KNO scaling
Extended longitudinal scaling (ELS) was observed first in Ref. [48] in the fragmentation region of dN/dy(ordN/dη) spectra. Here the particle rapidity spectra have the same slope independent on the c.m. energy √s. To demonstrate this distinctly, the dN/dy distributions at different energies
are shifted to the beam rapidity,ymax. The ELS was found to hold to 10% in a broad energy range 30.8 GeV≤ √s≤900 GeV [31]. Some time ago, in Ref. [49] the violation of the ELS inppcollisions was predicted at energies available at LHC. To obtain thedN/dyparticle spectrum at LHC the authors of [49] have fitted the rapidity spectra of hadrons at lower energies to the Gaussian, extracted the widthsσG, and extrapolated the obtainedσG(√s) dependence to the LHC energy range. The predicted dN/dyspectrum appeared to be quite narrow, thus indicating violation of the ELS.
QGSM does not support this prediction. We plot in Fig. 7 dNch
NS D/dy spectra as functions of y−ymax in pp interactions at energies from √s = 200 GeV to 14 TeV. It is easy to see that in
the fragmentation region all curves sit on the top of each other. The fulfillment of the extended longitudinal scaling in the model is due to short-range rapidity correlations of hadrons in a string [16]. The correlation function of any two particles has exponential dependence
C(y1, y2)∝exp
−λ(y1−y2), (17)
therefore, particles are uncorrelated provided∆y=y1−y2≫1. Then, thei-th particle inclusive cross section for the process 1+2−→i+Xis
fi=d
2σ(y1−yi, yi−y2,(p(i) T)2)
0 100 n 200 300 ch
10-5 10-4 10-3 10-2
dN/dn
ch
QGSM - soft only - 1 soft Pomeron - 2 soft Pomerons - 3 soft Pomerons - 4 soft Pomerons
Figure 9.QGSM calculations of charged particle multiplicity distribution for processes going via the exchange of soft Pomerons inppcollisions at √s=14 TeV. Partial contributions of the 1P, 2P, 3P, and 4P processes are shown by dash-dotted, double-dash–dotted, dashed, and dotted lines, respectively.
If particleiis produced in the fragmentation region of particle 1, this means thaty1−yi ≈ 1 and
yi−y2 ≈ y1−y2 ≫ 1, i.e., fi depends only on two variables,y1−yi and (p(Ti))2. Recalling that lnx(i)
F ∝yi−y1, the condition of the Feynman scaling for the particle inclusive densityni= fi/σinelis recovered:
ni=φ(x(Fi),(p(Ti))2). (19)
Another interesting form of the scaling dependence is the so-called Koba-Nielsen-Olesen (KNO) scaling suggested in Ref. [50]. According to it, the multiplicity distributionPn(s) = σn(s)/σtot(s), whereσn(s) is the partial cross section of the process withnparticles in the final state, depends on the c.m. energy√sonly through the normalized multiplicityn/�n�, i.e.,
Pn(s)= 1
�n�Ψ
n
�n�
. (20)
Here�n� is the averaged multiplicity andΨ(n/�n�) is an energy independent function. The KNO scaling was observed in pp and ¯pp collisions up to energies available at ISR accelerator, √s ≤
62 GeV. Its violation at higher energies was predicted by the RFT specialists, see, e.g., [1, 7, 51]. The mechanism of the KNO violation within the Reggeon Field Theory is as follows.
The multiplicity of the produced particles in ultrarelativistic hadronic interactions is determined mainly by the number of cut Pomerons. Each cut Pomeron produces two strings, and the short range correlations of particles within the strings provide a Poisson multiplicity distribution of secondaries. At not very high energies or in the central rapidity window|y| ≤1, the contributions of the processes with different number of cut Pomerons strongly overlap. Therefore, the KNO scaling approximately
holds. With rising c.m. energy, the number of strings and the energy deposited into a single string in-creases. As a result, we have an enhancement of the high multiplicity events. The particle distribution starts to deviate from the Poissonian, and violation of the KNO scaling takes place.
0 100 n 200 300 ch
10-5 10-4 10-3 10-2
dN/dn
ch
QGSM - soft only - 1 soft Pomeron - 2 soft Pomerons - 3 soft Pomerons - 4 soft Pomerons
Figure 9.QGSM calculations of charged particle multiplicity distribution for processes going via the exchange of soft Pomerons inppcollisions at √s=14 TeV. Partial contributions of the 1P, 2P, 3P, and 4P processes are shown by dash-dotted, double-dash–dotted, dashed, and dotted lines, respectively.
If particleiis produced in the fragmentation region of particle 1, this means thaty1 −yi ≈ 1 and
yi−y2 ≈ y1−y2 ≫ 1, i.e., fi depends only on two variables, y1−yi and (p(Ti))2. Recalling that lnx(i)
F ∝yi−y1, the condition of the Feynman scaling for the particle inclusive densityni= fi/σinelis recovered:
ni=φ(x(Fi),(p(Ti))2). (19)
Another interesting form of the scaling dependence is the so-called Koba-Nielsen-Olesen (KNO) scaling suggested in Ref. [50]. According to it, the multiplicity distributionPn(s) = σn(s)/σtot(s), whereσn(s) is the partial cross section of the process withnparticles in the final state, depends on the c.m. energy √sonly through the normalized multiplicityn/�n�, i.e.,
Pn(s)= 1
�n�Ψ
n
�n�
. (20)
Here�n� is the averaged multiplicity andΨ(n/�n�) is an energy independent function. The KNO scaling was observed in pp and ¯pp collisions up to energies available at ISR accelerator, √s ≤
62 GeV. Its violation at higher energies was predicted by the RFT specialists, see, e.g., [1, 7, 51]. The mechanism of the KNO violation within the Reggeon Field Theory is as follows.
The multiplicity of the produced particles in ultrarelativistic hadronic interactions is determined mainly by the number of cut Pomerons. Each cut Pomeron produces two strings, and the short range correlations of particles within the strings provide a Poisson multiplicity distribution of secondaries. At not very high energies or in the central rapidity window|y| ≤1, the contributions of the processes with different number of cut Pomerons strongly overlap. Therefore, the KNO scaling approximately
holds. With rising c.m. energy, the number of strings and the energy deposited into a single string in-creases. As a result, we have an enhancement of the high multiplicity events. The particle distribution starts to deviate from the Poissonian, and violation of the KNO scaling takes place.
The QGSM calculations of the charged particle multiplicity distributions in three midrapidity in-tervals forppinteractions at 900 GeV and 2.76 TeV are compared in Fig. 8 with the experimental data
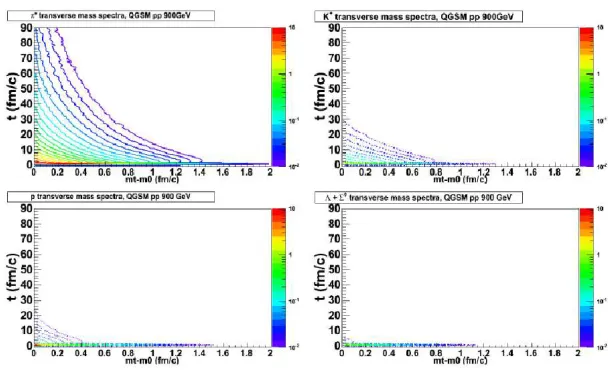
Figure 10.d2N/dzdtdistribution of positive pions (upper left), positive kaons (upper right), protons (bottom left) andΛ + Σ0(bottom right) in QGSM forppcollisions at√s=900 GeV.
of the ALICE Collaboration [36]. The model results agree well with the data. Investigation of these spectra in terms of the variablen/�n�, see Ref. [52], has confirmed the violation of the KNO scaling inppcollisions at LHC energies. Namely, (i) formation of the more pronounced peak at not very high multiplicities, and (ii) rise of the high multiplicity tail of the multiplicity distribution have been observed. Figure 9 reveals the underlying mechanisms of these phenomena. For the sake of simplic-ity, we consider here events with only soft Pomerons. The more Pomerons in the event, the larger the high multiplicity tail of its spectrum. The average multiplicities of the multi-Pomeron distributions do not coincide anymore, and the local peak corresponding to the single-Pomeron exchange becomes apparent.
3.3 Particle freeze-out
In this section we present the distributions of coordinates and momenta for four abundant particle species, namelyπ+,K+,pandΛ + Σ0. Recall that the distributions are averaged over the whole
en-semble of events. Therefore, the fluctuations on the event-by-event basis are disregarded. Apparently, particles can be produced in inelastic and elastic collisions, and in decays of resonances, but here we will not distinguish between the last interaction points.
The phase-space distribution of the particles on the mass shell depends on seven independent vari-ables: coordinates�x, momenta�p, and timet. In both hadron-hadron interactions and central collisions of symmetric nuclei, there are only ten different coordinate pairs [26]. Two of them which give a nice
Figure 11.The same as Fig. 10 but ford2N/mTdmTdtdistribution.
the first fermi-second. Particles demonstrate clear mass hierarchy: heavy particles freeze out earlier compared to the light ones, as heavy strings become less prevalent. Production of charged pions takes place up tot ≈18 fm/cin the central zone of the collision, whereas for charged kaons, protons and Λ’s these times reduce to 12 fm/c, 10 fm/c, and 7 fm/c, respectively.
The transverse mass distribution,md2N
TdmTdt, is shown in Fig. 11. It appears that particles produced at the very beginning of the collision carry larger transverse mass and, therefore, larger transverse momentum. This finding is in line with the results of femtoscopy analysis that hadrons with the largestpTindicate the smallest emission zone. A second peak seen in just a few fm/cafter the initial
collision comes from the decays of short-lived resonances. The continuous production of hadrons from the resonance decays takes place up to quite long times. The transverse mass of the created hadrons drops almost exponentially with increasing time.
3.4 Forward-backward multiplicity correlations
Forward-backward multiplicity correlations between charged hadrons emitted in forward and back-ward hemispheres were first observed in [53]. The strength of the correlations is defined as
b= �(nF− �nF�)(nB− �nB�)�
�(nF− �nF�)2��(nB− �nB�)2�1/2 , (21)
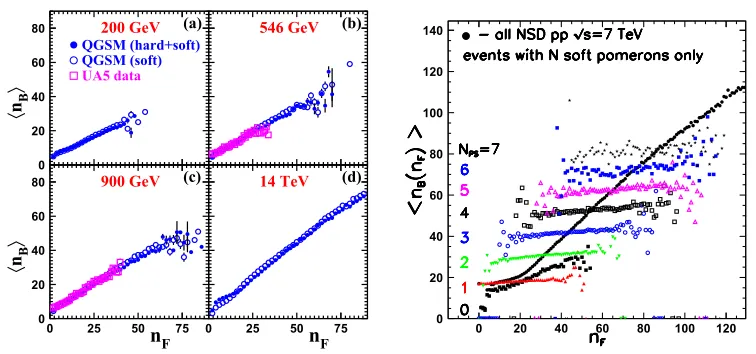
wherenB andnF represent multiplicities of charged particles in backward and forward hemispheres, respectively. Figure 12 depicts the dependence of the mean charged-particle multiplicity in the back-ward hemisphere�nB�, measured in the range−4 ≤ η ≤0, on the multiplicity in the forward hemi-spherenF for the symmetric range 0 ≤ η ≤ 4 at four c.m. energies, √s = 200 GeV, 546 GeV,
0 20 40 60 80
0 20 40 60 80
0 25 50 75 0 25 50 75
(a) (b)
(c) (d)
200 GeV 546 GeV
900 GeV 14 TeV
QGSM (hard+soft) QGSM (soft) UA5 data
nF nF
〈
nB
〉〈
nB
〉
Figure 12.Backward-forward multiplicity correlations �nB(nF)�for 0≤ |η| ≤4 in NSDppinteractions at √s= 200 GeV (a), 546 GeV (b), 900 GeV (c) and 14 TeV (d). Open circles denote contributions of soft processes, full symbols are for all processes. Data are from [31].
0 20 40 60 80 100 120 140
0 20 40 60 80 100 120
Figure 13.Backward-forward multiplicity correlations �nB(nF)� in QGSM calculations of NSD pp interac-tions at √s =7 TeV proceeding via the soft Pomeron exchanges. Also shown are correlations for the
colli-sions with fixed amount of soft Pomerons (from zero to
seven).
900 GeV, and 14 TeV. Comparison with the experimental data at √s=546 GeV and 900 GeV shows
a good agreement between the model results and the data. The dependence�nB(nF)� looks pretty
linear at all energies,
�nB(nF)�=a+b nF, (22)
revealing a sort of long-range correlations. The correlation strength is characterized by the slopeb, which increases with rising energy of the collisions. As shown in Fig. 12, the correlations between the�nB�andnF are mainly determined by the soft processes.
The linear profile of the forward-backward correlations canbe reproduced by the mixture of sev-eral emitting sources. Moreover, the multiplicity of the secondary hadrons should be described by the Poisson distribution, and all sources should possess different average multiplicities [31], see also
[54, 55] and references therein. Let us sketch briefly how this picture emerges in the QGSM.
It is worth noting that the model successfully reproduces the forward-backward multiplicity cor-relations inppand ¯ppcollisions not only at energies above hundred GeV, but also at energies about few GeV in the c.m. frame [56]. In this energy range the variety of subprocesses describing the ¯pp interactions is more copious compared to that describing theppcollisions, because of, e.g., annihi-lation processes, planar diagrams, and so forth. As a result, the correannihi-lation strength is stronger in ¯pp interactions. At ultrarelativistic energies the contribution of these diagrams to the total cross section rapidly drops to zero. The difference between thebcorrpp andbcorrpp¯ disappears, but the slopes of the
shown for the subprocesses withN soft Pomerons, whereNvaries from zero to seven. Despite the significant event-by-event multiplicity fluctuations, theslopes of the partial distributions are absent. But when we are combining the subevents with different mean multiplicities together, a nice picture of
positive correlations�nB(nF)�arises. This circumstance explains also the nonzero slope of the
distri-bution for events with just one soft Pomeron. Here we are mixing up several diagrams corresponding to the double diffraction displayed in Fig. 1. Detailed study of the forward-backward multiplicity
correlations within the QGSM and comparison with the available experimental data can be found in [55].
4 Conclusions
The Monte Carlo version of the quark-gluon string model is applied for the description of proton-proton collisions at energies from√s=200 GeV to 14 TeV. The model is based on Gribov’s Reggeon
Field Theory and employs theoretical estimates for the total cross sections, as well as for the cross sections of single diffraction and double diffraction processes. Parameters of soft and hard Pomerons
are tuned to provide the best fit to the data at LHC energies. Itis shown that QGSM reproduces well the bulk observables, such as yields, rapidity- and transverse momentum spectra of charged particles at all energies in question.
Several scaling hypothesis have been examined.The model indicates fulfillment of the extended longitudinal scaling accompanied by the violation of both Feynman scaling and KNO scaling. The origin of these phenomena is traced to short range momentum correlations of particles in strings and copious production of hadrons in multi-Pomeron processes. The latter leads to the formation of distinct peak in the multiplicity distribution at lower multiplicities and rise of the high-multiplicity tail of the distribution.
Although the main part of the most abundant particle species is produced at the very beginning of the collision, there is no sharp freeze-out of hadrons inppinteractions. Hadron emissivity rapidly drops with timet. However, the production of pions in the central zone of ppcollisions at √s =
900 GeV, for instance, takes place up tot∼18 fm/c. For other hadron species this time is shortened,
thus revealing the mass hierarchy: the heavier the particle, the faster the freeze-out proceeds. Hadrons with large transverse momentum are produced at the first fm/c, whereas soft hadrons are emitted
during the whole time of evolution. Secondary peak in thed2N/mTdmTdtdistribution appears because of decays of short-lived resonances.
Finally, the model was employed to study forward-backward multiplicity correlations. Note that no extra tuning of the model parameters was performed. Because of the rich set of various subpro-cesses at partonic level, QGSM reproduces nicely almost linear positive FB correlations inppand ¯pp interactions in a very broad energy range. We show that for each particular subprocess the FB mul-tiplicity correlations are absent despite of the significant mulmul-tiplicity fluctuations on event-by-event basis. But when we add up all these events with different average multiplicities, the picture of strong
positive FB correlations emerges.
Acknowledgements
We would like to thank B. Kopeliovich, V. Khose, E. Levin, L. Lipatov, J. Nyiri, and V. Fadin for the fruit-ful discussions and valuable comments. J.B. thanks the German Research Foundation (DFG) for the financial
shown for the subprocesses withN soft Pomerons, whereNvaries from zero to seven. Despite the significant event-by-event multiplicity fluctuations, theslopes of the partial distributions are absent. But when we are combining the subevents with different mean multiplicities together, a nice picture of
positive correlations�nB(nF)�arises. This circumstance explains also the nonzero slope of the
distri-bution for events with just one soft Pomeron. Here we are mixing up several diagrams corresponding to the double diffraction displayed in Fig. 1. Detailed study of the forward-backward multiplicity
correlations within the QGSM and comparison with the available experimental data can be found in [55].
4 Conclusions
The Monte Carlo version of the quark-gluon string model is applied for the description of proton-proton collisions at energies from √s=200 GeV to 14 TeV. The model is based on Gribov’s Reggeon
Field Theory and employs theoretical estimates for the total cross sections, as well as for the cross sections of single diffraction and double diffraction processes. Parameters of soft and hard Pomerons
are tuned to provide the best fit to the data at LHC energies. Itis shown that QGSM reproduces well the bulk observables, such as yields, rapidity- and transverse momentum spectra of charged particles at all energies in question.
Several scaling hypothesis have been examined.The model indicates fulfillment of the extended longitudinal scaling accompanied by the violation of both Feynman scaling and KNO scaling. The origin of these phenomena is traced to short range momentum correlations of particles in strings and copious production of hadrons in multi-Pomeron processes. The latter leads to the formation of distinct peak in the multiplicity distribution at lower multiplicities and rise of the high-multiplicity tail of the distribution.
Although the main part of the most abundant particle species is produced at the very beginning of the collision, there is no sharp freeze-out of hadrons inppinteractions. Hadron emissivity rapidly drops with timet. However, the production of pions in the central zone of ppcollisions at √s =
900 GeV, for instance, takes place up tot∼18 fm/c. For other hadron species this time is shortened,
thus revealing the mass hierarchy: the heavier the particle, the faster the freeze-out proceeds. Hadrons with large transverse momentum are produced at the first fm/c, whereas soft hadrons are emitted
during the whole time of evolution. Secondary peak in thed2N/mTdmTdtdistribution appears because of decays of short-lived resonances.
Finally, the model was employed to study forward-backward multiplicity correlations. Note that no extra tuning of the model parameters was performed. Because of the rich set of various subpro-cesses at partonic level, QGSM reproduces nicely almost linear positive FB correlations inppand ¯pp interactions in a very broad energy range. We show that for each particular subprocess the FB mul-tiplicity correlations are absent despite of the significant mulmul-tiplicity fluctuations on event-by-event basis. But when we add up all these events with different average multiplicities, the picture of strong
positive FB correlations emerges.
Acknowledgements
We would like to thank B. Kopeliovich, V. Khose, E. Levin, L. Lipatov, J. Nyiri, and V. Fadin for the fruit-ful discussions and valuable comments. J.B. thanks the German Research Foundation (DFG) for the financial
support through the Project BL 1286/2-1. L.B. acknowledges financial support of the Alexander von Humboldt Foundation.
References
[1] A.B. Kaidalov, Phys. Lett. B116, 459 (1982);
A.B. Kaidalov and K.A. Ter-Martirosyan, Phys. Lett. B117, 247 (1982).
[2] A. Capella, U. Sukhatme, C.-I. Tan, and J. Tran Thanh Van, Phys. Rep.236, 225 (1994). [3] V.N. Gribov, Sov. Phys. JETP26, 414 (1968).
[4] G. t’Hooft, Nucl. Phys. B72, 461 (1974). [5] G. Veneziano, Phys. Lett. B52, 220 (1974).
[6] N.S. Amelin and L.V. Bravina, Sov. J. Nucl. Phys.51, 133 (1990) .
[7] V. Abramovskii, V. Gribov, O. Kancheli, Sov. J. Nucl. Phys.18, 308 (1974). [8] A. B. Kaidalov, Surveys in High Energy Phys.13, 265 (1999).
[9] M. Baker, K. A. Ter-Martirosyan, Phys. Rep.28C, 1 (1976). [10] O.V. Kancheli, JETP Lett.11, 267 (1970);
A.H. Mueller, Phys. Rev. D2, 2963 (1970).
[11] Y. V. Kovchegov and K. Tuchin, Phys. Rev. D65, 074026 (2002); E. Levin and A. Prygarin, Phys. Rev. C78, 065202 (2008).
[12] K. Werner, F.-M. Liu, and T. Pierog, Phys. Rev. C74, 044902 (2006). [13] R. Engel, J. Ranft, and S. Roesler, Phys. Rev. D52, 1459 (1995).
[14] S. Ostapchenko, Nucl. Phys., Proc. Suppl.151, 143 (2006); Phys. Rev. D83, 014018 (2011). [15] A.B. Kaidalov and M.G. Poghosyan, Eur. Phys. J. C67, 397 (2010).
[16] J. Bleibel, L.iV. Bravina, and E.E. Zabrodin, Phys. Rev. D93, 114012 (2016). [17] E. Gotsman, E. Levin, U. Maor, and J. S. Miller, Eur. Phys. J. C57, 689 (2008). [18] E. Gotsman, E. Levin, and U. Maor, Eur. Phys. J. C71, 1553 (2011).
[19] M. G. Ryskin, A. D. Martin, and V. A. Khoze, Eur. Phys. J. C54, 199 (2008).
[20] M. G. Ryskin, A. D. Martin, V. A. Khoze, and A. G. Shuvaev, J. Phys. G36, 093001 (2009). [21] R. D. Field, R. P. Feynman, Nucl. Phys. B136, 1 (1978).
[22] N.S. Amelin, E.F. Staubo, and L.P. Csernai, Phys. Rev. D46, 4873 (1992). [23] N.S. Amelinet al., Phys. Rev. C47, 2299 (1993).
[24] L. Bravina, L.P. Csernai, P. Levai, D. Strottman, Phys. Rev. C50, 2161 (1994). [25] L.V. Bravina, Phys. Lett. B344, 49 (1995).
[26] L.V. Bravinaet al., Phys. Rev. C60, 044905 (1999). [27] E.E. Zabrodinet al., Phys. Lett. B508, 184 (2001). [28] E.E. Zabrodinet al., Phys. Rev. C63, 034902 (2001). [29] L.V. Bravinaet al., Phys. Rev. C78, 014907 (2008). [30] G. Burauet al., Phys. Rev. C71, 054905 (2005).
[31] G. J. Alneret al.(UA5 Collab.), Phys. Rep.154, 247 (1987). [32] G. Arnisonet al.(UA1 Collab.), Phys. Lett. B118, 167 (1982);
C. Albajaret al.(UA1 Collab.), Nucl. Phys. B335, 261 (1990).
[33] F. Abeet al.(CDF Collab.), Phys. Rev. Lett.61, 1819 (1988); Phys. Rev. D41, R2330 (1990). [34] T. Alexopouloset al.(E735 Collab.), Phys. Rev. D48, 984 (1993).
[35] ALICE Collaboration (K. Aamodtet al.), Eur. Phys. J. C68, 89 (2010). [36] ALICE Collaboration (K. Aamodtet al.), Eur. Phys. J. C68, 345 (2010). [37] ALICE Collaboration (K. Aamodtet al.), Phys. Lett. B693, 53 (2010).
[40] CMS Collaboration (K. Khachatryanet al.), J. High Energy Phys. 02, 041 (2010). [41] CMS Collaboration (K. Khachatryanet al.), Phys. Rev. Lett.105, 022002 (2010). [42] CMS Collaboration (K. Khachatryanet al.), Phys. Lett. B751, 143 (2015).
[43] CMS and TOTEM Collaborations (S. Chatrchyanet al.), Eur. Phys. J. C74, 3053 (2014). [44] L. McLerran and M. Praszalowicz, Acta Phys. Polon. B41, 1917 (2010).
[45] E. Levin and A.H. Rezaeian, Phys. Rev. D82, 014022 (2010). [46] R. Feynman, Phys. Rev. Lett.23, 1415 (1969);
R. Feynman,Photon-hadron interactions(Benjamin, NY, 1972). [47] W. Busza, J. Phys. G35, 044040 (2008).
[48] G.J. Alneret al.(UA5 Collab.), Z. Phys. C33, 1 (1986).
[49] J. Cleymans, J. Strümpfer, and L. Turko, Phys. Rev. C78, 017901 (2008). [50] Z. Koba, H.B. Nielsen, and P. Olesen, Nucl. Phys. B40, 317 (1972). [51] E.M. Levin and M.G. Ryskin, Yad. Fiz.19, 389 (1974).
[52] V. Zaccoloet al.(ALICE Collab.), Nucl. Phys. A956, 529 (2016). [53] C.J. Alneret al.(UA5 Collab.), Nucl. Phys. B291, 445 (1987). [54] V.V. Vechernin,these Proceedings.
![Figure 1.. The models are as follows:GLMM (circles) [17], GLM (squares) [18], QGSM(crosses), KMR-1 (triangles) [19], KMR-2 (diamonds)[20], and QGSJET-2 (stars) [14]](https://thumb-us.123doks.com/thumbv2/123dok_us/8068466.1345453/4.482.52.421.98.274/figure-follows-circles-squares-crosses-triangles-diamonds-qgsjet.webp)