Computational study of radiation doses at UNLV accelerator
facility
Matthew Hodges1,*, Alexander Barzilov1, Yi-Tung Chen1,and Daniel Lowe1
1
Department of Mechanical Engineering, University of Nevada, Las Vegas, 4505 S. Maryland Parkway, Las Vegas, NV, 89154, USA
Abstract. A Varian K15 electron linear accelerator (linac) has been considered for installation at University of Nevada, Las Vegas (UNLV). Before experiments can be performed, it is necessary to evaluate the photon and neutron spectra as generated by the linac, as well as the resulting dose rates within the accelerator facility. A computational study using MCNPX was performed to characterize the source terms for the bremsstrahlung converter. The 15 MeV electron beam available in the linac is above the photoneutron threshold energy for several materials in the linac assembly, and as a result, neutrons must be accounted for. The angular and energy distributions for bremsstrahlung flux generated by the interaction of the 15 MeV electron beam with the linac target were determined. This source term was used in conjunction with the K15 collimators to determine the dose rates within the facility.
1 Introduction
High energy (greater than 10 MeV) linear electron accelerators (linacs) often produce photoneutrons due to the energies of the generated bremsstrahlung photons being greater than that of the neutron binding energies of the materials they are likely to interact with [1]. These materials include the components of the linac itself in addition to the nearby structures within a shielded vault where the linac is housed. As an undesired secondary radiation, these photoneutrons contaminate the photon beam and increase the overall dose rates within the immediate surroundings. In order to accurately represent the radiation environment and understand the total dose rate due to the linac operation, it is necessary to not only determine the photon contribution but also that produced by neutrons.
The accelerator facility at UNLV was commissioned in 2015 and houses a Varian M6 linac. Previous research projects at UNLV include the radiation characterization of the facility due to the M6 operation [2]. A Varian K15 was considered for installation at the accelerator facility and as such, a radiation characterization of the vault must be performed. The K15 runs can be carried out in two modes: high energy and low energy. The high energy mode is capable of producing photons up to 15 MeV and the low energy mode is capable of producing photons up to 9 MeV. The K15 system uses a cone collimator in order to shape the emitted photons into a 30 degree cone. Other collimator shapes are possible, but only the conical collimator was studied in this research. This study was concerned with the development of computational model to determine the dose rate footprint throughout the UNLV facility for the K15 operation.
Fig. 1. Varian K15 linac [3].
2 Background
2.1 Photoneutron production
When the energy of the bremsstrahlung photons is greater than that of the neutron binding energy of the nuclei they interact with, a neutron is produced in the (J,n) reaction. The neutron binding energy of a specific isotope is determined from the Q-value (difference in mass energies of the products and reactants). When the Q-value is negative, the target atom requires this input of energy from the projectile in order for the reaction to proceed. For a photonuclear reaction, this corresponds to the minimum threshold energy of the photon needed to induce the (J,n) reaction. Values for (J,n) threshold energies for materials commonly found in the linac and surrounding environment are shown in Table 1.
Table 1. Threshold energies of (J,n) reaction.
Z Isotope Threshold energy (MeV)
1 2H 2.2
5 11B 11.5
6 12C 18.7
7 14N 10.6
8 16O 15.7
11 23Na 12.4
12 24Mg 16.5
13 27Al 13.1
25 55Mn 10.2
26 56Fe 11.2
27 59Co 10.5
28 58Ni 12.2
29 63Cu 10.9
30 64Zn 11.9
3 Computational model
The MCNPX code [4] was used in the computational study to determine the radiation dose rates within the UNLV accelerator facility. An MCNPX input deck requires several components in order to represent the model of the facility and the linac. The 3D geometry domain of the model (created through cell and surface cards) must be carefully defined in order to accurately represent the radiation transport processes.
The radiation source is the starting point of the model. If the source is incorrectly defined, this misrepresentation will propagate throughout the model resulting in unreliable results.
Tallies were used in order to calculate values of interest (i.e. radiation flux, dose, energy deposition). A tally must be specified within the computational model at specific geometric locations where these values are
model and must be properly represented. Physics models (i.e., electron, photon, and neutron interactions) must be properly defined for accurate solution to the problem.
3.1 Accelerator facility
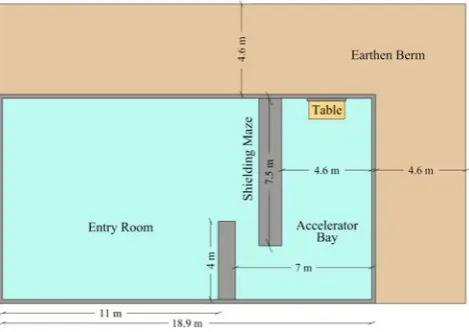
The UNLV accelerator facility is built into a large mound of earth that stretches for about 20 meters north and 10 meters east of the building. The enveloping earthen berm acts as natural shielding to the environment from radiation produced by the linac.
An exclusion area on the top of the building is protected by fencing in order to keep out any animal life or people. The linacs in the accelerator facility are operated from a separate control room that is placed to the south of the facility building. The control room was not modeled in this study.
Fig. 2.UNLV accelerator facility.
The facility building consists of an entry room, a shielding maze, and an accelerator bay. There is a sample table at the northern end of the accelerator bay where samples may be placed for experiment. The geometry model of the facility was created within the MCNPX input deck according to on-site measurements [2]. Figure 3 details the layout and dimensions of the accelerator facility and room structures.
3.2 MCNPX model
The linac’s target head and shielding components were defined in the computational model according to proprietary design provided by Varian. Material data used to define the room structure components (i.e. concrete, earth, air, etc.) were taken from the Compendium of material composition data for radiation transport modeling [5]. To account for photonuclear interactions, the .70u(LA150) cross section library was used.
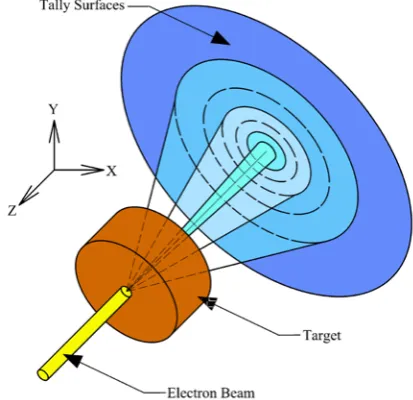
Firstly, the simulation of an electron pencil beam (Gaussian in both energy and radial impact target location) impinging on the linac’s target was carried out. The angular and energy distributions of the bremsstrahlung photon flux produced by this interaction were determined by placing F4 tallies on a series of conic segments 1 cm behind the linac’s target head (see Fig .4). 100 equally spaced energy bins were used to determine the energy distribution of the photon flux. These tallies allowed for the determination of photon flux values at intervals of 10 degrees off the beam centerline.
Fig. 4.Tallying the angular distribution of photons.
Using the bremsstrahlung source data, MCNPX was used to simulate the radiation transport throughout the facility. The RMESH card was used to determine the spatially-dependent radiation fluxes within the facility. A 2D mesh was placed at a height of 111 cm above the floor (positioned at the center of the photon conical beam) in order to determine the photon and neutron fluxes in 7.6-cm intervals (in both the x- and y-directions).
These fluxes were converted to the biological dose rates through the ANSI/ANS 6.1.1-1977 flux-to-dose rate factors [6] for both neutrons and photons. In the MCNPX model, this conversion was performed by specifying the dose conversion coefficient (ic=20) within the RMESH card.
A vertical profile of the photon dose rates at 1 meter north of the linac target head was determined through use of an F5 tally spaced 5 cm apart. The error associated with each tally was below 5% value. The neutron spectrum at 1 meter north of the linac’s target head at a height of 1.11 m was also determined using an F5 tally. The MCNPX models were run for 500 million particle histories. This ensures that the statistical error associated with the respective F4 tallies was below the MCNPX recommendation of 10%. Once the calculations were completed, the MCNPX mesh output files were converted to Tecplot ready ASCII files through the use of the MCNPX command GRIDCONV. These files were then directly input into Tecplot for post processing of computational results.
4 Results
4.1 Bremsstrahlung photon spectra
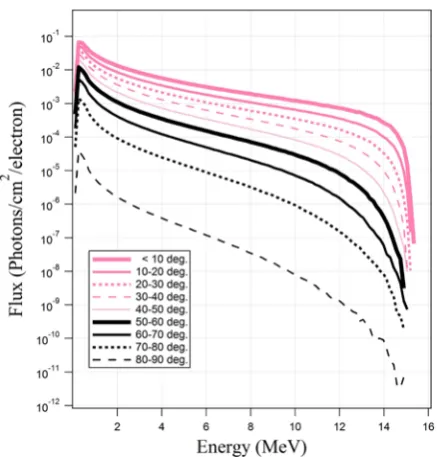
The F4 tally results on the conic segments were used to create the spectral distributions of bremsstrahlung photons. The photon spectra at the respective energy modes are shown in Fig. 5 and Fig. 6. In each mode, the greatest fluxes of photons occur at the lowest energies. Additionally, the greatest photon fluxes occur within a conical angle of 10 degrees from the linac’s target. As the angle increases and the cone widens, the photon flux decreases.
The spectra show similar trends between the two K15 energy modes. \For both energy modes, at 1 MeV, the photon fluxes occurring below 10 degrees are approximately 3 orders of magnitude greater than the photon fluxes at angles greater than 80 degrees. At 8 MeV, the differences between the two angles are 5 orders of magnitude.
Fig. 6.Bremsstrahlung photon spectra, high energy mode.
4.2 Dose rates
Contour maps for photon and neutron dose rates were created in order to determine the radiation footprint within the building for the K15 operation in high and low energy modes. These maps were created for two different linac’s operating conditions. The first was for operation of the K15 under normal conditions while the second was to determine the maximum dose rates within the facility if the K15 was operating in high energy mode without shielding and collimators. Comparison between the two scenarios results allowed for the determination of the effectiveness of the radiation shielding design in the reduction of dose rates outside the facility.
4.2.1 Normal operation dose rates
The photon dose rate contour maps for normal operation of the K15 system in high and low energy modes are shown in Fig. 7 and Fig. 8, respectively. The results show that photon fluxes and dose rates for both high and low energy modes are contained within the accelerator bay equipped with the concrete shielding maze.
Fig. 7.Photon dose rate, normal operation in the high energy
Fig. 8.Photon dose rate, normal operation in the low energy mode.
Dose rates in the entry way and shielding maze were determined to be 3 - 4 orders of magnitude lower than those in front of the linac assembly. The earthen berm to the north of the facility attenuates the photon fluxes behind the sample table within a few meters. The earthen berm to the east of the linac also minimizes the photon fluxes in less than a meter. In both instances, the dose rate was reduced to the limit set for the general public. The vertical profile of the photon dose rates at 1 meter north of the linac’s target head is shown in Fig. 9.
Fig. 9.Vertical profile of the photon dose rate, normal operation.
for high energy operation is seen in Fig. 10. When operating in the low energy mode, the endpoint energy of the bremsstrahlung spectra is below the (J,n) reaction thresholds of the materials used in the simulation and no photoneutrons were generated.
Fig. 10.Neutron dose rate, normal operation in the high energy mode.
The computed dose rates show that neutrons were primarily contained within the accelerator bay. The neutron dose rates to the north of the linac are largest due to the lack of polyethylene shielding directly behind the linac’s target head, while the dose rates to the rear of the linac were minimized by the presence of neutron shielding.
These results also show that the neutron dose rates within the facility are several orders of magnitude lower than the photon dose rates. While the photon dose profile north of the linac’s target head exhibits the shape created by the cone collimators, the neutron rate does not. This is best understood as the high-Zmaterial in the collimators do not attenuate the neutron flux as they have low neutron scattering cross sections. The neutron spectrum at 1 m from the linac’s target head is shown in Fig. 11. The results show that the largest flux of neutrons is in the 0.1 to 1 MeV energy range.
Fig. 11.Neutron spectrum.
4.2.2 Maximum dose rates
When the shielding and collimators were removed from the MCNPX model of the K15 system during the high energy mode operation, the dose rates within the accelerator facility increased. The results from this calculation help to understand the maximum dose rates present within the facility due to operation of the K15. Fig. 13 and Fig. 14 show the maximum dose rates within the building due to photons and neutrons, respectively.
Fig. 12.Maximum photon dose rates, high energy mode.
Fig. 13.Maximum neutron dose rate, high energy mode.
5 Conclusions
The purpose of this study was to computationally characterize the dose rate footprint of the UNLV accelerator facility due to the operation of a Varian K15 linac. It was determined that when the K15 system is operated in the high energy mode, there is greater flux of bremsstrahlung photons than when it is operated in the low energy mode. Furthermore, when the linac is operated in the high energy mode, photoneutrons are produced whose contribution to dose rate cannot be ignored.
The linac’s and facility’s shielding components greatly reduce photon and neutron fluxes and dose rates outside of the facility, making it possible to comply with the regulatory limits (2 mrem/hr).
References
1. K. Kosako, K. Oishi, T. Nakamura, Angular Journal of Nuclear Science and Technology, 48, 227-236 (2011)
2. M. Hodges, A. Barzilov, Y. Chen, D. Lowe, Radiation Physics and Chemistry,127, 72-77 (2016) 3. Varian Medical Systems. Linatron K15. Web. 10
Oct 2016. https://www.varian.com/x-ray-imaging-
components/products/security-industrial-imaging/linear-accelerators/linatron-k15 4. D. Pelowitz (ed), LA-CP-11-00438 (2011)
5. R. McConn, C. Gesh, R. Pagh, R. Rucker, R. Williams PNNL-15780 (2011)
![Fig. 1. Varian K15 linac [3].](https://thumb-us.123doks.com/thumbv2/123dok_us/8132464.1355301/1.595.313.531.408.555/fig-varian-k-linac.webp)