J. Alvarez-Muñiz1, M. Blanco2, M. Boháˇcová3, B. Buonomo4, G. Cataldi5, M.R. Coluccia5,6,
P. Creti5, I. De Mitri5,6, C. Di Giulio7,8,a, P. Facal San Luis9, L. Foggetta4, R. Gaïor2,
D. Garcia-Fernandez1, M. Iarlori6, S. Le Coz11, A. Letessier-Selvon2, K. Louedec11,
I.C. Maris12, D. Martello5,6, G. Mazzitelli4, M. Monasor13, L. Perrone5,6, S. Petrera10,
P. Privitera13
, V. Rizi10
, G. Rodriguez Fernandez7,8
, F. Salamida14
, G. Salina8
, M. Settimo2
, P. Valente4
, J. R. Vazquez15
, V. Verzi8
, and C. Williams13
1 Depto. de Fisica de Particulas, Universidad de Santiago de Compostela, Santiago de Compostela,
Spain
2Laboratoire de Physique Nucléaire et de Hautes Energies (LPNHE), Universités Paris 6 et Paris 7,
CNRS-IN2P3, Paris, France
3Institute of Physics, Academy of Sciences of the Czech Republic, Prague, Czech Republic 4Istituto Nazionale di Fisica Nucleare, Laboratori Nazionali di Frascati, via E. Fermi, 40, 00044
Frascati, Italy
5Sezione INFN, Lecce, Italy
6Dipartimento di Matematica e Fisica Ennio De Giorgi, Università del Salento, Lecce, Italy 7Dipartimento di Fisica, Università di Roma Tor Vergata , Roma, Italy
8Sezione INFN, Roma Tor Vergata, Italy
9University of Chicago, Enrico Fermi Institute Kavli Institute for Cosmological Physics, Chicago,
USA
10Dipartimento di Fisica, Università dell’Aquila and sezione INFN, l’Aquila, Italy 11Laboratoire de Physique Subatomique et de Cosmologie (LPSC), Université J. Fourier
Grenoble, CNRS-IN2P3, Grenoble, France
12Universidad de Granada and C.A.F.P.E., Granada, Spain
13University of Chicago, Enrico Fermi Institute Kavli Institute for Cosmological Physics,
Chicago, USA
14Institut de Physique Nucléaire d’Orsay (IPNO), Université Paris 11, CNRS-IN2P3, France 15Universidad Complutense de Madrid, Madrid, Spain
Abstract. You The Air Microwave Yield (AMY) experiment investigate the molecular bremsstrahlung radiation emitted in the GHz frequency range from an electron beam induced air-shower. The measurements have been performed at the Beam Test Facility (BTF) of Frascati INFN National Laboratories with a 510 MeV electron beam in a wide frequency range between 1 and 20 GHz. We present the apparatus and the results of the tests performed.
1. Introduction
The cosmic rays at energies above 1018eV could be detected using the Earth atmosphere as a calorimeter. This method called fluorescence technique provides a calorimetric measurement of the primary energy of the cosmic ray from the detection of the radiation produced by the
Figure 1. Left panel: sketch of the AMY experiment. Right panel: the AMY anechoic Faraday chamber mounted at the BTF, on the bottom right the inside view of the chamber.
de-excitation of the atmospheric nitrogen. The collection of this fluorescence light by the telescopes are used by the Pierre Auger Observatory [2] and Telescope Array [3], which are the largest detectors of cosmic rays that were ever built. In those detectors the fluorescence measurements are used to determine the energy scale [4] of the surface array detector only in small fraction of events detected by the surface array since the fluorescence light could be collected only during moonless nights with an overall duty cycle of about 10%.
An unconventional technique has been suggested after the first statement of the GHz radiation from air shower plasmas [1] in which the Molecular Bremsstrahlung Radiation (MBR) is predictable that to be emitted by low energy electrons throughout their interaction with the field of the neutral molecules. Similar the fluorescence emission, MBR should be isotropic and un-polarized but this radiation is released at frequencies in the GHz range respect to the UV range of the fluorescence. The major advantage of a telescope in the GHz frequency is that it would be comparable to the fluorescence one, but with a 100% of duty cycle.
This procedure was first developed at the Stanford Linear Accelerator Center (SLAC) using a 28 GeV electron beam. The measurements have been achieved in a 1 m3 copper anechoic Faraday chamber in the frequency band 1.5−6.0 GHz. Afore enter into the chamber, the beam was collided with a 90% Al2O3–10% SiO2 target. The signal was found to decay exponentially with =10 ns and to be proportional with the square of the beam energy, demonstrating that the emission is fully coherent. The density flux of the radiation was estimated to be 4×10⁻¹⁶W/m2/Hz.
Based on those results the potentiality of a MBR technique telescope was investigated by prototypes of GHz telescopes as AMBER [1,5], MIDAS [5,6] and EASIER [5] at the Pierre Auger Observatory and CROME detector that has been setup within the KASCADE-Grande array [7]. Several shower candidates have been detected, but the measurements disfavors the hypothesis of coherent emission, which is in contrast to what has been reported in [1].
Other experiments using electron beam have been performed [8,9] that suggests a linear scaling of the radiation intensity with the beam energy, which means that the emission is not radiated coherently; this could be due to the fact that MBR radiation emission depends strongly by the plasma density that is related to the source of electrons.
In the next sections we present the AMY experiment arrangement and the first outcomes of the analysis of the data.
2. Equipment and experimental method
The BTF [11] is a part of the DANE complex. The LINAC provide electron bunches with a charge up to 1010electrons for pulse, in an energy range between 25 and 750 MeV, with a
bunch size between 1–10 ns and a maximum repetition rate of 50 Hz. The bunch is made of micro-bunches with a FWHM of 14 ps, separated by 0.35 ns, which matches to the inverse of the LINAC frequency 2.856 GHz.
The interaction target contains six modules of 95% pure Al2O3 distantly managed by a
pneumatic system. The maximum thickness is 45 cm that corresponds to about 7 radiation lengths (X0). At the shower maximum, our energy deposit is almost a factor 6 larger than the
energy deposit in [1].
The AMY collaboration has completed four measurement campaigns, one in 2011, two in 2012 and one in 2014. Following the first two tests we had improved the operation conditions and the experimental apparatus. The bunch length was 10 ns, 3 ns and the 1.5 ns only in the test of 2012.
2.2 The anechoic Faraday chamber and the data acquisition system
The anechoic Faraday chamber was manufactured at the mechanical shop of the physics department of the Roma Tor Vergata University. The sizes of the chamber (2 m width × 4 m long) are mainly constrained by the space accessible in the BTF hall. To enable its transportation to the BTF, the chamber has been built in 3 sections: two have a length of 1.5 m and one is 1 m long.
The left panel of Fig.1 shows the chamber installed at the BTF. The outer surface is covered by copper and connected to ground. The internal side of the chamber (see in the bottom of the right panel of Fig.1) has a cover of pyramidal RF absorbers (AEP-12 model). The shielding of the chamber from external radiation it is superior than 80 dB above 2 GHz and it falls quickly at lower frequencies (at 1 GHz it is∼50 dB). The chamber can host the radio receivers in 5 different locations (matching to the aluminum boxes visible in Fig.1). The radio receiver sustain allows the variation of the distance of the antennas from the beam axis and to exchange their polarization plane.
The receivers are two Rohde&Schwarz (R&S) HL050 log-periodic antennas and two RF Spin Double Ridged Waveguide Horn DRH20. Both types of antennas are linearly polarized and operate in a broadband range of input frequencies, from about 1 to 20 GHz. The antennas have been calibrated at the SATIMO StarLab calibration system [12] as shown in the left panel of Fig.2for the horn.
Figure 2. Left panel: gain of the horn as a function of the frequency. Right panel: calibration factor that includes the amplifier and the loss in the cables.
Figure 3. Left panel: gain of the horn as a function of the frequency. Right panel: calibration factor that includes the amplifier and the loss in the cables.
3. AMY data analysis
The significant argument of the measurement is the understanding of the enormous background result from the Cherenkov and transition radiation emitted by the relativistic electrons.
This radiation is linearly polarized in the plane including the beam axis and the direction of the radiation. While the antenna polarization plane is parallel to the beam axis (co-pol arrangement) the antenna signal is very elevated and dominated by the Cherenkov part as exposed in the left panel of Fig.3. When the polarization plane is perpendicular to the beam axis (cross-pol arrangement) the signal is much lower as shown in the right panel of Fig.3.
The signal in the cross-pol arrangement has a double peak structure and several tests performed do not support the reflections in the electronic chain and in the chamber as the source. In the central panel of Fig.3 the co-pol signal of the left panel was acquired with the oscilloscope scale saturated and the second peak is shown. Contrary to the first peak, the second one is un-polarized which is the experimental signature of the MBR that distinguishes it from the Cherenkov radiation. Moreover it is delayed and this is consistent with MBR and Cherenkov signals respectively dominated by the emission at the center and the beginning of the chamber.
Figure 4. Left panel: power of the cross-pol signal as a function of the beam intensity. Right panel: frequency spectrum of the oscilloscope trace.
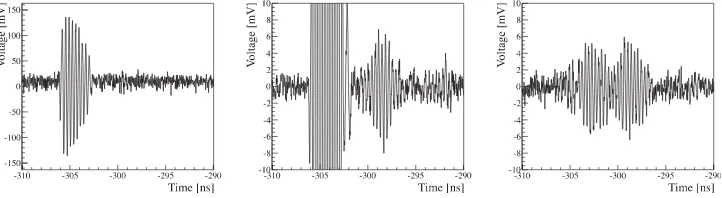
Figure 5. Left panel: cross-pol signal for different thicknesses of the interaction target. The number of particlesNe=2.3×10⁹and the bunch length duration is 1.5 ns for all signals.
The right panel of Fig.4shows the spectrum of the signal (black) by Fourier Transform of the oscilloscope traces and averaging over many events. The contribution from the background is shown in red and is dominated by the LINAC frequency (fL=2.856 GHz).
This is estimated by the cross-pol signal with a target of 2.3 X0. Repeating the analysis to the
co-pol signal confirm the same feature.
We have developed a detailed simulation of the Cherenkov contribution according to the model developed in [13] and qualitatively reproduce the experimental spectrum. The peaks are due to the constructive interference of the emission of the micro-bunches and the power of the signal scales quadratically with the beam intensity. Consequently we comprehend that the coherence in the cross-pol arrangement is produced by the LINAC so we cannot exclude the Cherenkov as the origin.
Additional important item of the cross-pol signal is the dependence between its intensity and the thickness of the interaction target. Figure 5shows the raw oscilloscope traces for Ne=2.3×10⁹ when there is no target and for 2.3 and 4.7 X0. The signal decreases from ∼100 mV to∼1 mV which corresponds to a factor 104in power. This fall of the power can
not be explained by the change of the energy deposit, which is only a factor 5. A similar trend has been observed for the co-pol signal. This behavior is interpreted as the result of a loss of coherence, which is caused by a larger average distance between the electrons after their collision with the target.
4. Conclusions
seems to be very prompt like the Cherenkov emission and the coherence is surely produced by the particular time structure of the bunch. Using the AMY data is possible to put an upper limit on the intensity of the MBR process. A preliminary limit can be found with the analysis of the data with the largest target thickness. We find a density flux<10−16 W/m2/Hz using the signals with 4.7 X0, the calibration of the detector and considering that the signal is mostly
intense in a narrow bandwidth of 1 GHz around fL.
References
[1] P. W. Gorham et al., Phys. Rev. D 78 (2008) 032007
[2] The Pierre Auger Collaboration, Nucl. Instrum. Meth. A 523 (2004) 50
[3] H. Sagawa, TA Collaboration, Proc. 33rd ICRC 2013, Rio de Janeiro, Brazil, icrc2013-0128
[4] V. Verzi, Pierre Auger Collaboration, Proc. 33rd ICRC 2013, Rio de Janeiro, Brazil, icrc2013-0928, arXiv:1307.5059 [astro-ph]
[5] I. Al Samarai, “Radio detection of Cosmic Rays in the GHz band at the Pierre Auger Observatory”, ARENA 2014
[6] J. Alvarez-Muñiz et al., Phys. Rev. D 86 (2012) 051104(R) [7] R. Smida et al., arXiv:1108.0588v2 [hep-ex]
[8] M. Monasor et al., arXiv:1108.6321 [9] E. Conti et al., arXiv:1408.5886 [astro-ph]
[10] I. Al Samarai, “An estimate of the spectral intensity expected from the molecular Bremsstrahlung radiation in extensive air showers”, ARENA 2014 and I. Al Samarai et al., arXiv:1409.5051 [astro-ph]