a
Corresponding author: [email protected]
The feasible study of the water flow in the micro channel with the
Y-junction and narrow structure for various flow rates
D. Jasikova1,a, M. Kotek and V. Kopecky
1
Institute for Nanomaterials, Advanced Technologies and Innovation, Technical university of Liberec, Studentska 2, Liberec, Czech Republic
Abstract. Here we present the results of measurement in micro-channel with the Y-junction and narrow structure for various flow rates. There was used BSG micro-channel with trapezoidal cross-section. The parameters of the channel are described in the paper. The flow in the channel was invested with micro-PIV technique and various flow rates were set on each inlet. The resulting flow rate in the steady area follows the laminar flow with very low Re 30. Here we are focused on the flow characteristic in the Y-junction and in selected narrow structure. The fluid flow is evaluated with vector and scalar maps and the profile plots that were taken in the point of interest.
1 Introduction
Nowadays, the microfluidic application are founding their place in many advanced advices, such as supersonic nozzles designed for JPL/NASA, computer industry for chip cooling, inkjet printers, but also biomedical industry for patient diagnosis, monitoring and drug delivery. The importance of the flow detection is major in the micro scale flow cytometer for cancer cell detection or Lab-On-Chip devices. [1]
The measurement method that gives us complex information about the flow is offered as on macro scale i.e. Particle Image Velocimetry (PIV). Because here we dealing with micro and nano scales the tradition PIV fitted with magnifying lens system constitutes sufficient background for the measurement setup. [3-6]
2 Micro-channel setup
The fabrication of the micro-channel is one of the areas of the microfluidic research. Nowadays there exists a traditional method based on the negative resist using lithography, plasmatic etching, or streaking.
For the purpose of our study, the micro-channel of set parameters was fabricated in the cooperation with Wroclaw University of Technology. The process of fabrication included borosilicate glass (BSG) deposition by plasma-enhanced chemical vapour deposition (PECVD) over templates patterned and etched using standard photolithographic methods and reactive ion etching and plasmatic bonding. The trapezoidal micro-channel was designed with the depth d 75 μm, width Wa 290 μm and Wb 190 μm. The cross-section geometry is seen in figure 1.
The micro-channel contains 10 segments of narrow section. The structure of narrow section is seen in figure 2. The inner breadth of the narrow ba was 190 μm and bb is equal to the Wa.
Figure 1. Cross-section of micro-channel.
Figure 2. The detailed image of the narrow segment of the micro-channel.
The complete geometrical parameters can be seen in figure 3. The micro-channel is bonded to the BSG with the wholes for the connectors to join the inner cavity to
l
b
bb
aC
Owned by the authors, published by EDP Sciences, 2015
!"
the tube system and feeding. This mounts fit with ordinary Luer-lock system.
The fluid flow was generated with two separate laboratory syringe pump. The linear pumps were joined to the inlet A and inlet B. The fluid flow outlet resulted into open space.
Here we used distilled water that was driven through the micro-channel.
Figure 3. Top view of the micro-channel structure on the base plate.
Figure 4. The photography of real micro-channel with signed fluid flow inlets and outlets.
Here we set the flow velocity according to the knowledge of the laminar flow and the Reynolds number range in micro fluidic. Due the friction factor the transition area in Re starts at 240.
ܦ ൌସ ൌଶሺௐೌାௐ್ሻௗ
ௐೌାଶାௐ್ (1)
ܴ݁ ൌ௨ഥQ (2)
, where u is the mean channel velocity, D is the hydraulic parameter and ν is the kinematic viscosity of water (1,004.10-6 for 20° C)
The hydraulic parameter for the micro-channel is 109 μm and in the narrow section 95 μm. The Reynolds number in micro-channels with similar hydraulic parameter for laminar flow was experimentally set as 200. Above this edge the flow shows irregular directions
and for Re round 470 is set to be turbulent. The transient area was established 240 < Re < 470. [2]
Here we worked with the 11 < Re < 26 to keep the laminar behaviour of the flow.
3 Micro-PIV measurement setup
The micro-PIV measurement setup is based on the magnifying optical system. He we used Leica DM IL inverted laboratory microscope set with standard objective, for our measurement we used 10x.
The micro-PIV consists of NewWave Gemini Nd:YAG pulsed laser of energy in each pulse 120 mJ. The duration of one pulse was 10ns and the wavelength of the laser 532 nm.
The images were captured using Neo CMOS camera with 5.5 MPixel resolutions and pixel size 6.5 μm, Pixel well depth (typical) 30,000 e- and cooling system for noise reduction.
The laser light and the camera were synchronized via timer box.
In standard PIV method the depth of field is influence of the distance from the measured object, selected lens system and f number. In micro-PIV the depth of field depends on the microscope objective and its parameters, refractive index n of the fluid in the microfluidic channel,
λ the wavelength of used light. The other parameters that relate to the micro lens system: NA – numerical aperture of objective lens, M – total magnification of the system. The last parameter influencing the depth of field is the spacing between pixels in CCD chip of the camera e.
ߜ ൌேఒమேǤெǤ
(3)
For our measurement setup according this quotation the depth of field is 4 μm. This factor has to be taken into account while choosing the seeding media and also focusing over the channel depth.
There exist special rules for seeding medium in micro-PIV. The first condition is the particle visibility. The quality of captured images strongly depends on the contrast of the particles against background.
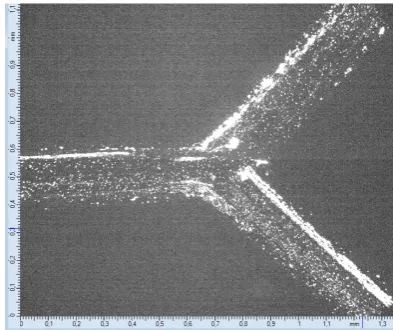
Figure 5. The Y-junction in the microscope view illuminated by the laser light, the fluid flow seeded with fluorescent particles.
Inlet A
There are visible only those particles that merge the depth of field and are illuminated. The background reflects the scattered light from the particles. This disadvantage of the lighting is partly reduced using fluorescent technique. Here we used the Rhodamine B particles that emit light on 570 nm. The background noise is mostly caused by unfocused moving particles and this is difficult to remove as it is seen in figure 6.
Figure 6. The narrow structure in the microscope view illuminated by the laser light, the fluid flow seeded with fluorescent particles.
The next parameter of the seeding medium is its size. There exists the limit when the size of particles is small and the collective effect of collisions and fluid molecules is unbalanced. [1] This behaviour is called as Brownian motion. The suitable size of particles can be chosen considering to flow dynamics. Here we evaluate the ability of single particle follow the flow. This parameter is set by the response timeτ.
߬ ൌௗଵ଼ఓమఘ (4)
, where d is the particle diameter, ρ the particle density and μ the dynamic viscosity of fluid.
According to the quotation (4) we seeded the fluid with 1 μm PS Rhodamine B labelled particles. The response time of the particle is 10-6 s. According to the fluid speed (units’ mm s-1) the response time is small enough for particles to follow the flow sufficiently.
The last error that should be mentioned here in the relation to the seeding is the particle position error. This error corresponds to the Brownian motion, displacement and the time of exposure time of the laser light. This error can be neglected, when the Brownian motion is small according to the size of particle.
The captured images were pre-processed with masking function. The images were processed with adaptive correlation. This kind of correlation is the approach in cross-correlation. This method is optimized to the local displacements. The sizes of interrogation areas are locally adjusted to the maximal velocity of the fluid flow. This method is crucial to micro fluidics because it can describe big local velocity changes in a small spatial scale, where is impossible to adapt the dynamic range via time between pulses. Here we used the
adaptive correlation algorithm setup with minimum size of interrogation area (32x32) pixel and maximum size (64x64) pixel in 8 iteration steps.
The calculated raw vector maps were also validated while adaptive correlated. The validated vector maps were statistically processed and the dataset were interpreted via Tecplot software.
4 Results and discussion
In this study we examined the fluid flow under various flow rates in two sections. The first section was the Y-junction and the second was the narrow section. Here we present the results from only one narrow section, because the rest of them followed the same behaviour.
4.1 Y-junction section
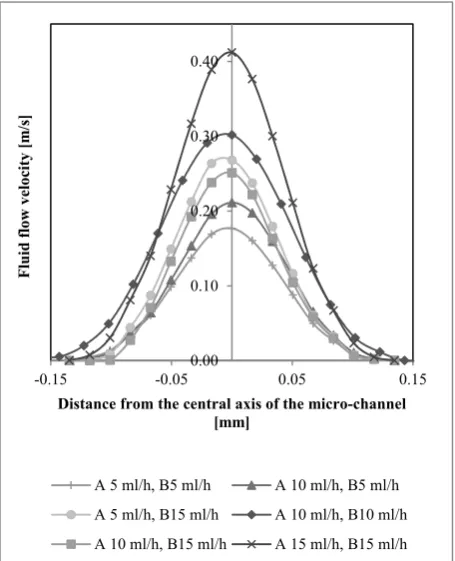
In Y-junction section we investigated the mixing of flow from two separate branches. There was developed accelerated stream of fluid in the middle of the channel. This stream was stabilized after 0.4 mm to the straight channel part. The straight stabilization part was 7 mm long. This distance should be enough for the fully developed laminar flow. Figure 7 shows the velocity profile taken in the position 0.5 mm (Fig. 5).
Figure 7. The chart of the velocity profile that was taken in the position 0.5mm, where the flow was accelerated.
0.00 0.10 0.20 0.30 0.40
-0.15 -0.05 0.05 0.15
Fluid flow
velocity
[m
/s]
Distance from the central axis of the micro-channel [mm]
A 5 ml/h, B5 ml/h A 10 ml/h, B5 ml/h A 5 ml/h, B15 ml/h A 10 ml/h, B10 ml/h A 10 ml/h, B15 ml/h A 15 ml/h, B15 ml/h
a
Figure 8. The chart of the velocity profile that was taken in the position 8mm from the Y-junction, where the flow was stable.
In figure 8 it is seen the fully developed laminar profile in the distance 8 mm from the central point of Y-junction. This steady flow enters the narrow structure.
There was also studied the effect of commutation for the inlet A and B on the acceleration of the fluid flow. The profile taken on point 0.5 mm was not totally axis-symmetrical, but there was not found any significant changes so it was said the inlets could be commutative without any effect on the stead fluid flow in the following structures.
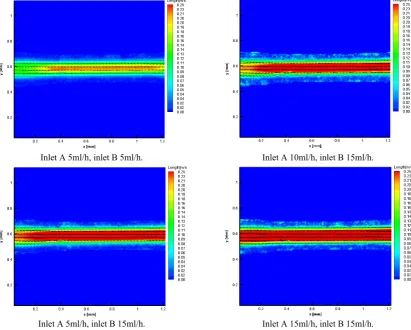
The figure 9 shows the vector maps and the scalar velocity distribution in the Y-junction of the micro-channel. There is seen the changes in the flow rates between inlet A and B, if there are any. This figure also shows the development of the accelerated stream of flow and it dependence on set flow rates.
4.2 Narrow section
The narrow structure is mostly used in chemical lab-on-chip and medical application, where is need for the flow acceleration. The most interesting rate of acceleration is for the low feed rates, i.e. 5 ml / h. For low feed rates there is not critical pressure rise that can cause damage of the micro-fluidic system, connections and the standard plastic syringe.
0.00 0.05 0.10 0.15 0.20 0.25 0.30 0.35 0.40
-0.15 -0.05 0.05 0.15
Fluid flow
velocity
[m
/s]
Distance from the central axis of the micro-channel [mm]
A 5 ml/h, B 5 ml/h A 5 ml/h, B 15 ml/h A 10 ml/h, B 15 ml/h A 15 ml/h, B 15 ml/h
Inlet A 5ml/h, inlet B 5ml/h. Inlet A 10ml/h, inlet B 5ml/h.
Inlet A 15ml/h, inlet B 15ml/h. Inlet A 10ml/h, inlet B 15ml/h.
Figure 10. The velocity profile taken in the second segment of narrow section.
The narrow section is characterized with the inclination of the breadth bb that was 290 μm to of 190
μm and the change of ba in the same ratio with constant high. The velocity profile taken in the middle of the narrow section, where the fluid flow is maximally
accelerated takes the different shape. In this area the fluid flow is more accelerated among the wall and here has to be taken in account Darcy friction coefficient and the surface roughness and the pressure difference. The profile in this section is wider distributed towards the micro-channel walls. The flow here is accelerated and suitably designed cascade of these elements can control the fluid flow. For the total fluid flow it is accelerated in 25%.
5 Conclusions
This study presented the results of micro-PIV measurement in the micro-channel with Y-junction and narrow structure. The micro-channel was designed with two separate inlets and here various flow rates were set to determine the influence on the resulting steady fluid flow. It was proved the interchangeability of the feed rates in the inlets and the presumption of the flow adhesion to one of the walls was eliminated. There was analysed the flow characteristics in the narrow structure and defined the degree of acceleration.
The next steps in solving this problematic are in focusing on the narrow structure and perform “the close to wall study” that could uncover the fluctuation behind the structure in the flow direction.
The micro-PIV technique is suitable for study of the interactions in the micro structures and cavities with optical access.
0 0.05 0.1 0.15 0.2 0.25 0.3 0.35 0.4 0.45 0.5
-0.1000 -0.0500 0.0000 0.0500 0.1000
Fluid flow
velocity
[m
/s]
Distance from the central axis of the micro-channel [mm]
A 5 ml/h, B 5 ml/h A 5 ml/h, B 15 ml/h A 10 ml/h, B 15 ml/h A 15 ml/h, B 15 ml/h
Inlet A 5ml/h, inlet B 5ml/h. Inlet A 10ml/h, inlet B 15ml/h.
Inlet A 5ml/h, inlet B 15ml/h. Inlet A 15ml/h, inlet B 15ml/h.
Figure 11. The vector maps of the fluid flow in the narrow section of the micro-channel and the scalar map of the local velocities for various inlets flow rates.
Acknowledgement
The results of this project LO1201 were obtained through the financial support of the Ministry of Education, Youth and Sports in the framework of the targeted support of the “National Programme for Sustainability I” and the support of the Czech Science Foundation GA13-20031S and TA03010950 - The use of hydrophobic and oleophobic surfaces during their interaction with liquids.
References
1. M. Raffel, et. Al., Particle Image Velocimetry - A Practical Guide (Springer Berlin Heidelberg, 2007) 2. S.-S. Hsieh, et. Al., Journal of Micromechanics and
Microengineering, 14, 4, 2004
3. P.-F. Hao, et. Al., Journal of Micromechanics and Microengineering, 16,7, 2006
4. P.-F. Hao, et. Al., Journal of Micromechanics and Microengineering, 15, 6, 2005
5. S.-S. Hsieh and Y.-C. Huang, Journal of
Micromechanics and Microengineering, 18, 6, 2008 6. M. Mielnik and L. Saetran, Experiments in Fluids,