University of Windsor University of Windsor
Scholarship at UWindsor
Scholarship at UWindsor
Electronic Theses and Dissertations Theses, Dissertations, and Major Papers
2016
Investigation of the Effectiveness of Applying Information
Investigation of the Effectiveness of Applying Information
Retrieval Techniques to Text-based Image Retrieval Methods
Retrieval Techniques to Text-based Image Retrieval Methods
Shaochen Zheng
University of Windsor
Follow this and additional works at: https://scholar.uwindsor.ca/etd
Recommended Citation Recommended Citation
Zheng, Shaochen, "Investigation of the Effectiveness of Applying Information Retrieval Techniques to Text-based Image Retrieval Methods" (2016). Electronic Theses and Dissertations. 5924.
https://scholar.uwindsor.ca/etd/5924
This online database contains the full-text of PhD dissertations and Masters’ theses of University of Windsor students from 1954 forward. These documents are made available for personal study and research purposes only, in accordance with the Canadian Copyright Act and the Creative Commons license—CC BY-NC-ND (Attribution, Non-Commercial, No Derivative Works). Under this license, works must always be attributed to the copyright holder (original author), cannot be used for any commercial purposes, and may not be altered. Any other use would require the permission of the copyright holder. Students may inquire about withdrawing their dissertation and/or thesis from this database. For additional inquiries, please contact the repository administrator via email
Investigation of the Effectiveness of
Applying Information Retrieval
Techniques to Text-based Image Retrieval
Methods
By
Shaochen Zheng
A Thesis
Submitted to the Faculty of Graduate Studies through the School of Computer Science in Partial Fulfillment of the Requirements for
the Degree of Master of Science at the University of Windsor
Windsor, Ontario, Canada
2016
c
Investigation of the Effectiveness of Applying Information Retrieval Techniques to Text-based Image Retrieval Methods
by
Shaochen Zheng
APPROVED BY:
G.Zhang
Department of Mechanical Automotive & Materials Engineering
I. Ahmad
School ofComputer Science
D.Wu, Advisor School ofComputer Science
DECLARATION OF ORIGINALITY
I hereby certify that I am the sole author of this thesis and that no part of this thesis has been published or submitted for publication.
I certify that, to the best of my knowledge, my thesis does not infringe upon any-ones copyright nor violate any proprietary rights and that any ideas, techniques, quotations, or any other material from the work of other people included in my the-sis, published or otherwise, are fully acknowledged in accordance with the standard referencing practices. Furthermore, to the extent that I have included copyrighted material that surpasses the bounds of fair dealing within the meaning of the Canada Copyright Act, I certify that I have obtained a written permission from the copyright owner(s) to include such material(s) in my thesis and have included copies of such copyright clearances to my appendix.
ABSTRACT
With advances in computer technology, there has been an explosion in the amount of digital images being generated. It is of importance to retrieve images accurately and efficiently. Text-based Image Retrieval (TBIR) methods are popular and practical in extensive applications and have been developed in the past decades. Since the process of TBIR is similar to Information Retrieval (IR), different techniques were adopted from IR and utilized to improve the performance of TBIR methods.
In this thesis, we focus on three IR techniques which are Term Frequency - Inverse Document Frequency (TF-IDF), Vector Space Model (VSM) and Cosine Coefficient Similarity (CCS) measure. These three techniques have been utilized in TBIR meth-ods together and separately and can effectively improve the performance of TBIR methods. However, to the best of our knowledge, the TBIR methods that utilized the three techniques together are hybrid approaches, only the performance of Content-based Image Retrieval (CBIR) and TBIR hybrid methods are evaluated by the au-thors. Consequently, the effectiveness of applying these three IR techniques to TBIR methods is investigated by comparing the retrieval results of an experimental TBIR system in 2 different modes: one is the system implemented with only TF-IDF tech-nique (Mode 2) and the other one with all three techtech-niques (Mode 1). Based on the experiment results, the performance of the experimental TBIR system implemented with the three IR techniques is relatively ideal. In most cases, the average precision is above 80% on the IAPR TC-12 image database.
DEDICATION
AKNOWLEDGEMENTS
First of all, I would like to express thanks to my supervisor Dr. Dan Wu. I really very much appreciate your guidance and help. Also I want to thank internal reader Dr. Imran Ahmad. Thank you for the detailed comments for my thesis.
Moreover, I’m grateful to external reader Dr. Guoqing Zhang. Thank you for the comments to my research.
In addition, I would like to thank my former supervisor Dr. Joan Morrissey who introduced me the topic of this thesis.
TABLE OF CONTENTS
DECLARATION OF ORIGINALITY III
ABSTRACT IV
DEDICATION V
AKNOWLEDGEMENTS VI
LIST OF TABLES IX
LIST OF FIGURES XI
I Introduction 1
1 Overview . . . 1
2 Motivation and Problem Statement . . . 3
3 Solution Outline . . . 6
4 Organization of Thesis . . . 7
II Review of Related Works 8 1 Apply TF-IDF, VSM and CCS measure together to TBIR Methods . 8 2 Apply VSM and CCS measure together to TBIR Methods . . . 9
3 Apply TF-IDF and VSM technique together to TBIR Methods . . . . 10
4 Apply TF-IDF technique to TBIR Methods . . . 10
5 Apply VSM technique to TBIR Methods . . . 11
6 Summary . . . 13
III Applying TF-IDF, VSM and CCS to TBIR methods 15 1 Methodology and Techniques . . . 15
1.1 TF-IDF . . . 15
1.2 The Vector Space Model (VSM) . . . 19
1.3 Cosine Coefficient Similarity (CCS) Measure . . . 21
2 Two Modes of the experimental TBIR System and Image Ranking . . 22
3 System Diagram and Algorithms . . . 22
4 Complexity Analysis . . . 29
IV Experiment 31 1 Database Preparation . . . 32
2 Precision Experiment . . . 34
3 Repeated Index Terms and TBIR Performance . . . 45
3.1 Experiment on the Ground Truth Database . . . 45
3.2 Experiment on Car Database . . . 47
3.4 Experiment on IAPR TC-12 Database . . . 55 4 Discussion . . . 58
V Conclusion and Future Work 60
Appendices 62
A The Extended “Car database” 63
B Experiment Results 1 68
C Experiment Results 2 71
D Experiment Results 3 75
1 Queries . . . 75 2 Ranking Comparisons . . . 76
REFERENCES 92
LIST OF TABLES
1 Images with Annotation. . . 2
2 The summary of techniques utilized. . . 14
3 The summary ofdf, idf value of index termt. . . 17
4 The summary oftf, df, idf,tf-idf value of index termt in document d. 19 5 The summary oftf, df, idf,tf-idf value of query Q. . . 20
6 System Modes. . . 22
7 Queries submitted to the experimental TBIR system. . . 34
8 Summary of ranking of the 1st image. . . 46
9 Summary of ranking of the 2nd image. . . 46
10 The structure of “Car Database”. . . 48
11 Ranking Comparison between Mode 1 (left table) and 2 (right table). 50 12 Queries submitted to the experimental system. . . 52
13 Summary of experiment results. . . 54
14 Extended“Car Database” detail. . . 67
15 Ranking Comparison for query 1. . . 68
16 Ranking Comparison for query 2. . . 68
17 Ranking Comparison for query 3. . . 69
18 Ranking Comparison for query 4. . . 69
19 Ranking Comparison for query 5. . . 69
20 Ranking Comparison for query 6. . . 69
21 Ranking Comparison for query 7. . . 70
22 Ranking Comparison for query 8. . . 70
23 Ranking Comparison for query 9. . . 70
LIST OF FIGURES
1 An image of the A380 plane . . . 3
2 The overview of the experimental TBIR system. . . 23
3 The user interface of the experimental TBIR system . . . 24
4 Structure of the Ground Truth Database. . . 32
5 Structure of the IAPR TC-12 database. . . 33
6 Experiment result of precision for Query 1. . . 36
7 Experiment result of precision for Query 2. . . 37
8 Experiment result of precision for Query 3. . . 37
9 Experiment result of precision for Query 4. . . 38
10 Experiment results of top 1 and 2 retrieved images for Query 4. . . . 38
11 Experiment result of precision for Query 5. . . 39
12 Experiment result of precision for Query 6. . . 39
13 Experiment result of precision for Query 7. . . 40
14 Experiment results of top 1 to 3 retrieved images for Query 6. . . 40
15 Experiment result of precision for Query 8. . . 41
16 Experiment result of precision for Query 9. . . 41
17 Experiment results of top 1 and 5 retrieved images for Query 9. . . . 42
18 Experiment result of precision for Query 10. . . 42
19 Average Precision . . . 43
20 Example of a noisy image . . . 44
21 Example of an image contains repeated index terms. . . 45
22 The retrieval result of the experimental TBIR system in Mode 1. . . . 49
23 The retrieval result of the experimental TBIR system in Mode 2. . . . 50
24 Image 1 in the “car database”. . . 51
25 Retrieval result for Query 1: audi sedan. . . 53
27 Experiment summaries of the 30 groups of queries. . . 57
28 Retrieval result for Query 1: audi sedan. . . 71
29 Retrieval result for Query 2: infiniti convertible. . . 71
30 Retrieval result for Query 3: toyota sedan. . . 72
31 Retrieval result for Query 4: sedan. . . 72
32 Retrieval result for Query 5: mitsubishi sedan. . . 72
33 Retrieval result for Query 6: toyota truck. . . 73
34 Retrieval result for Query 7: benz sedan. . . 73
35 Retrieval result for Query 8: audi a4 sedan 2005. . . 73
36 Retrieval result for Query 9: toyota camry. . . 73
37 Retrieval result for Query 10: wagon. . . 74
38 Top 5 Images Comparison of Group 1. . . 77
39 Top 5 Images Comparison of Group 2. . . 77
40 Top 5 Images Comparison of Group 3. . . 78
41 Top 5 Images Comparison of Group 4. . . 78
42 Top 5 Images Comparison of Group 5. . . 79
43 Top 5 Images Comparison of Group 6. . . 79
44 Top 5 Images Comparison of Group 7. . . 80
45 Top 5 Images Comparison of Group 8. . . 80
46 Top 5 Images Comparison of Group 9. . . 81
47 Top 5 Images Comparison of Group 10. . . 81
48 Top 5 Images Comparison of Group 11. . . 82
49 Top 5 Images Comparison of Group 12. . . 82
50 Top 5 Images Comparison of Group 13. . . 83
51 Top 5 Images Comparison of Group 14. . . 83
52 Top 5 Images Comparison of Group 15. . . 84
53 Top 5 Images Comparison of Group 16. . . 84
54 Top 5 Images Comparison of Group 17. . . 85
56 Top 5 Images Comparison of Group 19. . . 86
57 Top 5 Images Comparison of Group 20. . . 86
58 Top 5 Images Comparison of Group 21. . . 87
59 Top 5 Images Comparison of Group 22. . . 87
60 Top 5 Images Comparison of Group 23. . . 88
61 Top 5 Images Comparison of Group 24. . . 88
62 Top 5 Images Comparison of Group 25. . . 89
63 Top 5 Images Comparison of Group 26. . . 89
64 Top 5 Images Comparison of Group 27. . . 90
65 Top 5 Images Comparison of Group 28. . . 90
66 Top 5 Images Comparison of Group 29. . . 91
CHAPTER I
Introduction
1
Overview
In recent years, the size of digital image collections has been increasing rapidly. Every day, a large collection of digital images are generated in many areas of commerce, government, academia, hospitals, etc. Moreover, the rapid development of science and technology as well as information explosion have given us a new question of how to find the desired images accurately and efficiently. In order to solve this issue, in recent years, a variety of image retrieval methods thusly have been proposed, which include Content-based Image Retrieval (CBIR)[6], Hashing-Based Image Retrieval[51], Text-based Image Retrieval (TBIR)[39], etc. Among all these methods, TBIR is more practical when dealing with conceptually higher levels of content[39]. For example, Flickr1 and Piscasa2 are very popular TBIR based photo sharing websites. TBIR was firstly carried out in the early 1970s[37]. It started with the method called Boolean Search[33] which integrates with “AND”, “OR”, “NOT” to perform image retrieval. For example, suppose there is a query “famous AND bridges NOT Windsor”, with this query, retrieved images should relate to famous bridges which are not located in Windsor. It can be seen that Boolean Search is a simple method to retrieve images. However, the critical weakness of this method is that ranking cannot be carried out when retrieving images using this method[11].
1https://www.flickr.com/ 2
I. INTRODUCTION
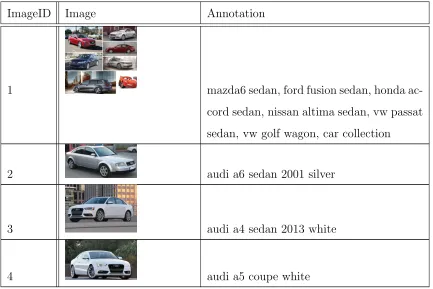
It is evident to tell from the literal meaning of TBIR, its key feature is text. TBIR is the process of matching the image annotations with queries. Below, Table 1 shows an example of images with annotations in TBIR.
ImageID Image Annotation
1 mazda6 sedan, ford fusion sedan, honda ac-cord sedan, nissan altima sedan, vw passat sedan, vw golf wagon, car collection
2 audi a6 sedan 2001 silver
3 audi a4 sedan 2013 white
4 audi a5 coupe white
TABLE 1: Images with Annotation.
In Table 1, the annotation column is the description of an image. An image’s annota-tion consists of a number of words. Each word is considered an index term. Moreover, the words in a query are index terms as well. For example, the word “silver” in the annotation of the 2nd image in Table 1 is an index term. In Table 1, the index term “sedan” appeared five times in the annotation of the 1st image, which makes it a re-peated index term. A rere-peated index term in an image’s annotation could be useless to the image and may affect the performance of TBIR methods. This issue will be further investigated in Chapter 4.
I. INTRODUCTION
image of an airplane. The annotation of this image is “Airplane British Airways A380 Landing Airport”. Suppose a user’s query is: “Airplane British Airways A320”. This image may be retrieved, because most of the index terms in the image’s annotation match the user’s query. However, the user wants images of the airplane A320, which means this image is irrelevant to the user’s query.
FIGURE 1: An image of the A380 plane3.
Information retrieval (IR)[44] is generally described as the problem of selecting texts from a database according to a specified query[2]. In order to improve the perfor-mance of TBIR methods, since the image retrieval process of TBIR is matching the annotations of images and the user’s query, which is similar to the process of IR, techniques were adopted from IR field and applied to TBIR.
2
Motivation and Problem Statement
To improve the performance of TBIR methods, IR techniques are implemented in TBIR methods. Below is a variety of IR techniques that have been utilized in TBIR methods.
3Digital Image.
http://www.businesstraveller.com/. October 11, 2015. Web. April 16, 2016.
I. INTRODUCTION
• Vector Space Model [24]
• Inference Network Model[31]
• Probabilistic Mode[50]
• Boolean Model[18]
• Euclidean Similarity measure[15]
• Cosine Coefficient Similarity mea-sure [13]
• Constrained Similarity measure [15]
• Jaccard Similarity measure[3]
• Relevance Feedback[42]
• Term Frequency - Inverse Docu-ment Frequency (TF-IDF) [43]
• Inverted Index technique[54]
• Min-Hash[4]
• Manhattan distance[21]
It can be seen that a number of IR techniques have been utilized in TBIR methods. Above listed techniques are just a part of them. In this thesis, we investigate the effectiveness of applying three IR techniques (TF-IDF, VSM and CCS measure) to TBIR methods. In the following, the reason why TF-IDF, VSM and CCS measure are selected is explained respectively:
• TF-IDF
TF-IDF4 stands for Term Frequency - Inverse Document Frequency. It is used to calculate the importance of index terms. TF-IDF is one of the most commonly used term weighting schemes in today’s IR systems[52]. Also, it is easy to compute and costs less computational resource. The second reason is that it considers both local and global information of an index term, which means it not only weights the index term in one document but also takes the whole document collection into account. Another reason is that it is easy to compute the similarity between two documents by using the TF-IDF weight.
I. INTRODUCTION
• VSM
In terms of VSM technique5, VSM stands for Vector Space Model. It is an algebraic model for representing text documents. Also, this technique is the most popular model in IR field for representing text documents algebraically[30]. In this model, documents and queries are represented by vectors in an-dimensional space. In then -dimensional space,n is the number of distinct index terms and each axis corresponds to one index term. Also, it is fundamental to document classification and document clustering[30][29].
• CCS measure
With respect to CCS measure6, CCS measure stands for Cosine Coefficient Similarity measure. it is a function that calculates the similarity between two objects. The advantage of this techniques is that it abstracts out the magnitude of the vectors. This is due to it taking out the influence of the document length. Therefore no matter how large the document is, only the relevant index terms in the document and the document collection are being processed. Moreover, there are a number of similarity measures that have been developed in the past decades. In the study of Choi et al.[3], the author summarized 76 similarity measures in IR field. Among these similarity measures, we found that CCS measure is easy to implement and often utilized in IR field[32][12][28].
Previously, there were image retrieval systems7[32][17] implemented with TF-IDF, VSM and CCS measure together. However, these systems are not pure TBIR. They are hybrid image retrieval systems which consist of CBIR and TBIR methods to-gether. Moreover, the authors only evaluated the performance of the hybrid systems, which means the performance of the TBIR method implemented with TF-IDF, VSM and CCS measure together was not evaluated separately. In addition, there are TBIR systems8 implemented with TF-IDF and other techniques. For example, in the study
5VSM will be further discussed in Chapter 3.
I. INTRODUCTION
of Li et al.[26], TF-IDF and Neighbor Voting scheme are utilized in a TBIR sys-tem. However, the performance of the TBIR method implemented with only TF-IDF technique is not evaluated as well.
Accordingly, in this thesis, we investigate the effectiveness of applying TF-IDF, VSM and CCS measure to TBIR methods by comparing the retrieval results of an exper-imental TBIR system in two different modes: one is the TBIR system implemented with only TF-IDF technique and the other one with all three techniques. To the best of our knowledge, there have been no such investigations done before.
In addition, as the “repeated index term” issue introduced in the last section, we found that in the experiment database, there are some images’ annotations contain repeated index terms. This situation drew our attention and inspired us to investigate how the repeated index terms in the annotations of images affect the performance of TBIR methods.
3
Solution Outline
In this thesis, we implement three IR techniques in TBIR methods. The main con-tribution of this work is summarized in the following:
1. The effectiveness of applying three IR techniques (TF-IDF, VSM and CCS measure) to TBIR methods is investigated by comparing the retrieval results of an experimental TBIR system in two different modes: one is the experimental TBIR system implemented with only TF-IDF technique and the other one with all three techniques.
I. INTRODUCTION
4
Organization of Thesis
CHAPTER II
Review of Related Works
For TBIR methods, the process of retrieving images is matching the annotations of images and the user’s query, which is similar to the process of IR. Thus, there are many pieces of research of applying IR techniques to TBIR methods. In this thesis, TF-IDF, VSM and CCS measure are selected and implemented on TBIR. To be more precise about these three techniques, TF-IDF is used to calculate the importance of index terms. The VSM is an algebraic model for representing text documents. The CCS measure is utilized to calculate similarities between documents and queries. In the following, previous works regarding applying IR techniques to TBIR methods are reviewed. Moreover, the previous works introduced in this chapter indicate that with the help of IR techniques, the performance of TBIR methods can be improved. The summary of the review can be found in Section 6 of this chapter.
1
Apply TF-IDF, VSM and CCS measure together
to TBIR Methods
II. REVIEW OF RELATED WORKS
using TF-IDF weighted vectors. Then, the similarity between the query and an im-age annotation vectors are calculated by the CCS measure. The authors utilized three languages ( English, French, Dutch ) to retrieve images. After that, the CBIR method will process the visual information of images that retrieved by the TBIR method, which can be seen that the TBIR method acts as a filter. In the end, the authors claimed that most of their experiment results in ImageCLEF10 are above the average for its modality. It can be seen that in the authors work, TF-IDF, VSM and CCS measure are utilized in the TBIR method of the hybrid image retrieval system.
Similarly, there is another approach which TF-IDF, VSM and CCS measure are uti-lized. In the study of Rui Yong et al.[40], the authors proposed an image retrieval approach in the Multimedia Analysis and Retrieval System (Mars)[17]. This approach utilized TF-IDF, VSM, CCS measure, Relevance Feedback, Wavelet representation and Co-occurrence matrix representation. It can be seen that this image retrieval is a TBIR and CBIR hybrid approach as well. In the experiment, the author evaluated their approach by using precision. However, the performance of TF-IDF, VSM and CCS measure is not evaluated.
2
Apply VSM and CCS measure together to TBIR
Methods
II. REVIEW OF RELATED WORKS
model. In the end, the authors claimed that their work outperformed the PLSA[32] method. PLSA stands for Probabilistic Latent Semantic Analysis[16] which is inspired by Latent Semantic Analysis (LSA) [7]. It focuses on recognizing and distinguishing between different contexts of word usage without recourse to a dictionary or thesaurus.
3
Apply TF-IDF and VSM technique together to
TBIR Methods
In the study of Liu et al.[27], the authors proposed a tag ranking scheme. This scheme focused on automatically ranking the tags associated with a given image according to their relevance to the image content. To estimate the relevance scores of the image tags from the probabilistic point of view, the authors utilized the TF-IDF technique. Then for each image, it is represented by VSM using the relevance scores. The experiment results showed that the proposed work could order the tags according to their relevance levels. Also, the authors believed their work could provide new facilities and opportunities for social media tagging services.
4
Apply TF-IDF technique to TBIR Methods
II. REVIEW OF RELATED WORKS
proposed method performs well. Also, the method is effective at retrieving specific symbols.
Similarly, in the study of Sivic et al.[45], the authors want to find whether a text retrieval method can be implemented on object recognition. They proposed an ap-proach which is to search for the object or scene which a user outlined in a video. TF-IDF technique is utilized to perform visual indexing. The TF-IDF technique cal-culates the similarity between the query and the document. In the authors’ work, the query is the visual words which the user outlined from a frame and the frames are the document. In the authors’ experiments, compared to the binary weights and term frequency weights, the TF-IDF weighting performed better [45].
Another related work is in the study of Li et al.[26], the authors proposed a new approach for social image retrieval. It could accurately and efficiently learn tag rele-vance by accumulating votes from visual neighbors. To calculate the relerele-vance score of an image, the authors utilized the TF-IDF technique. In the end, the authors conclude that their work showed a large potential of their algorithm for real-world applications.
5
Apply VSM technique to TBIR Methods
In the study of Lavrenko et al.[23], the authors proposed an approach to learning the semantics of images. This approach has the ability to automatically annotate an image with keywords and to retrieve images based on text queries. In this approach, the VSM is utilized. To be more precise, every image is divided into regions, for each region, it is described by a continuous-valued feature vector. In the end, the authors concluded that their proposed model worked directly on the continuous features. Moreover, the proposed model performed significantly better than a number of other models in image annotation and retrieval.
II. REVIEW OF RELATED WORKS
found that many social image search engines are based on keyword matching. How-ever, manual annotations are often unreliable and inconsistent. In order to address this challenge, the authors focused on the issue of tag completion. They aimed to automatically fill in the missing tags as well as correct noisy tags for given images. The authors utilized the VSM to represent the image-tag relation by a matrix, which made it easy to search for the optimal tag matrix consistent with both the observed tags and the visual similarity. In the end, the authors concluded that the proposed work significantly outperforms several state-of-the-art methods for automatic image annotation.
Another TBIR method is proposed regarding social media approach. In the study of Guangyu Zhu et al.[53], the authors found that for the popular photo sharing websites, user-provided image tags are often inaccurate and incomplete, which resulted in user unsatisfactory. In order to solve this issue, they proposed a new tag refinement formulation in form of convex optimization which could correct inaccurate tags and enrich the incomplete ones as well. For the proposed work, the VSM is utilized to represent images. In the end, the authors conclude that according to the experiment results, their work is effective and efficient.
With respect to image annotation approaches, in the study of Feng et al.[10]., the authors proposed a multiple-Bernoulli relevance model for image annotation. The proposed work is to formulate the process of human annotating images. The VSM is used to represent images. The authors claimed that their proposed model outper-formed the (multinomial) continuous relevance model and other models on both the Corel dataset[9] and a more realistic Trec Video dataset[1].
II. REVIEW OF RELATED WORKS
choice for annotating and retrieving images. Also, it is a fruitful area of research for applying formal models of IR.
6
Summary
Table 2 shows the summary of the above eleven related works. In the table, the check mark represents the technique utilized and the cross mark means the opposite. It can be seen that all these related works achieved satisfactory results. In the table, there are two image retrieval methods utilized TF-IDF, VSM and CCS measure together. However, for these two image retrieval methods, since they are hybrid approaches, only the performance of CBIR and TBIR hybrid method is evaluated. For the rest of the methods, most of them only used one technique and only a few adopted two techniques. Given all of the above, we investigate the effectiveness of applying these three techniques together to TBIR.
CHAPTER III
Applying TF-IDF, VSM and CCS
to TBIR methods
In this chapter, an experimental TBIR system implemented with TF-IDF, VSM and CCS measure is introduced. The experimental system is built to investigate the performance of TBIR methods. Moreover, this chapter describes how these three techniques implemented in the experimental system work with each other. The time complexity of the experimental system will be discussed in this chapter as well.
1
Methodology and Techniques
The experimental TBIR system utilized TF-IDF, VSM and CCS measure. These three techniques are described in the following sub-sections.
1.1
TF-IDF
III. APPLYING TF-IDF, VSM AND CCS TO TBIR METHODS
is the number of times that an index term occurs in a document. For instance, the TF weight of an index term t in a document dis denoted[29]:
W =tft,d (1)
In equation (1), W represents the TF weight of indextin documentd. Hence the TF weight of an index term is proportional to the count number of the index term, which means a repeated word is strongly related to the document content. The TF technique is the simplest method to evaluate index terms[8], but with some disadvantages in this technique. For example, in a document, an index term that has a high TF weight makes it important. However, it is hard to tell if this index term is important or not in the document collection. Accordingly, the main weakness of the TF technique is that it only considers the occurrence of an index term in a document, but does not consider in how many documents in a document collection the index term occurs. In other words, it is hard to tell if an index term is important or not in the document collection based on its TF weight. For instance, suppose in a documentd, an index term “car” has high TF weight, which means it is an important index term in document d. However, it is not known whether this index term is important or not in the document collection.
Consequently, it is essential to consider an index term not only in one document but also in the document collection. In order to address this issue, Inverse Document Frequency (IDF) is developed by researchers.
Unlike the TF technique, IDF does not concern how many times an index term occurs in one document. It works globally with all documents in the document collection. In 1972, a paper published by Karen Sp¨arck Jones[46] proposed a technique which later became known as IDF. The IDF weight of an index term t in a document collection is defined as follows[29]:
idft= log2 N dft
(2)
In equation (2), N represents the number of documents in the document collection.
III. APPLYING TF-IDF, VSM AND CCS TO TBIR METHODS
collection, which is also known as the Document Frequency (DF)[29]. Obviously, in the same document collection, the number of documents in the document collection is always constant, which means when calculating the IDF weight of an index term,
N will always be the same. According to equation (2), dft is inversely proportional to
idft, which means the higher the document frequency of index termtin the document
collection, the lower the IDF weight of index term t will be.
For example, the Reuters collection[25] consists of 806,791 documents1 where the document frequencies of index term “best”, “car” and “insurance” are respectively 25,235, 18,165 and 19,241. Table 3 is the summary of df, idf value for each index term t.
index term t dft (Document Frequency) idft
best 25,235 4.3
car 18,165 5.5
insurance 19,241 5.4
TABLE 3: The summary of df, idf value of index term t.
According to Table 3, the IDF weight of index term “car” is:
log2806791
18165 ≈5.5. (3)
Similarly, the IDF weight of index term “insurance” is:
log2806791
19241 ≈5.4. (4)
Apparently, an index term that has a high IDF is considered rare while an ubiquitous index term2 has a low IDF. Moreover, IDF is strongly related to the document col-lection, which means it does not count how many times an index term occurs in one document. Even an index term occurs 100 times in one document, its occurrence in
1The number of documents in the document collection will be added one when calculating the
TF-IDF weight for each index term. The reason for this will be discussed in the next subsection.
III. APPLYING TF-IDF, VSM AND CCS TO TBIR METHODS
that document is still considered as one time when calculating the IDF weight. Thus, compared to the TF technique, IDF can better distinguish the importance of index terms globally and gives a different perspective of view of how important an index term is among the document collection.
In practice, TF and IDF technique are combined to evaluate an index term locally and globally, which is the TF-IDF technique. Therefore, in a document collection, the TF-IDF weight of an index term t in documentd is given by[29]:
tf-idft,d =tft,d×idft (5)
According to equation (5), tf-idft,d assigns a weight to an index termt in document
d in a document collection. In addition, the TF-IDF weight is
1. higher when index term t has a high occurrence in documentd and occurs in a small number of documents;
2. lower when index term t has a low occurrence in document d and occurs in many documents;
3. zero when index termtdoes not occur in documentdor occurs in all documents.
It is obvious that the importance of index termtis proportional to it’s TF-IDF weight. For instance, suppose there is a document d in the Reuters collection introduced before, the TF weights of index term “best”, “car” and “insurance” are respectively 152, 3961, 8043 in document d. Table 4 is the summary of tf, df, idf,tf-idf value for each index term t in documentd.
III. APPLYING TF-IDF, VSM AND CCS TO TBIR METHODS
index term t tft,d df (Document Frequency) idft tf-idft,d
best 152 25,235 4.3 653.6
car 3961 18,165 5.5 21785.5
insurance 8043 19,241 5.4 43432.2
TABLE 4: The summary of tf, df, idf,tf-idf value of index term t in document d.
1.2
The Vector Space Model (VSM)
The Vector Space Model[24] is an algebraic model for representing text documents and it is another technique that the experimental TBIR system adopted. A doc-ument d can be represented by a vector V~(d), with each component in the vector corresponding to each index term in a query. The components are computed using the TF-IDF technique. To be more precise, the document d can be represented as
~
V(d) = (w1d, w2d, ..., wtd), where w1d represents index term one’s TF-IDF weight in
document d, w2d represents index term two’s TF-IDF weight in document d, etc.
III. APPLYING TF-IDF, VSM AND CCS TO TBIR METHODS
index term t tft,q df (Document Frequency) idfq tf-idft,q
best 1 25,235 4.3 4.3
car 1 18,165 5.5 5.5
insurance 1 19,241 5.4 5.4
TABLE 5: The summary of tf, df, idf,tf-idf value of query
Q.
After all documents in the document collection have been represented by vectors, the document collection can be represented by a term-document matrix (2 dimensions) which is matrix (6):
T1 T2 . . . Tt
D1 w(1,1) w(2,1) . . . w(t,1)
D2 w(1,2) w(2,2) . . . w(t,2) ..
. ... ... . .. ...
Dn w(1,n) w(2,n) . . . w(t,n)
(6)
In matrix (6), T1 , T2 ,. . ., Tt represent index term 1, index term 2, . . ., index term
t. D1, D2, . . ., Dn represent document 1, document 2, . . . , document n. An entry
in the matrix is the TF-IDF weight of an index term in a particular document. For example, w(1,1) represents index term 1’s TF-IDF weight in document 1 and w(t,n) represents index term t’s TF-IDF weight in document n.
III. APPLYING TF-IDF, VSM AND CCS TO TBIR METHODS
issue, one is added to the number of documents in the document collection when calculating the index terms’ TF-IDF weights in matrix (7). Accordingly, the index terms’ TF-IDF weights in both matrix (6) and matrix (7) are consistent.
T1 T2 . . . Tt
D1 w(1,1) w(2,1) . . . w(t,1)
D2 w(1,2) w(2,2) . . . w(t,2) ..
. ... ... . .. ...
Dn w(1,n) w(2,n) . . . w(t,n)
Dn+1 w(1,n+1) w(2,n+1) . . . w(t,n+1)
(7)
1.3
Cosine Coefficient Similarity (CCS) Measure
A similarity measure is a function that calculates the similarity between two ob-jects. After the document collection is represented by matrix (7), CCS[13] measure is utilized to calculate similarities between documents and a query. Using the CCS measure makes it easy to calculate the similarity between a document and a query. In the experimental TBIR system, CCS measure is used to calculate the similarities between queries and documents. CCS measures the cosine value of the angle between two vectors. Hence for TBIR, CCS measures the similarities between queries and images, which means it calculates the similarities between queries and annotations of images. The cosine similarity between a document d and a queryq is defined as[29]:
sim(d, q) =
~
V(d)·V~(q)
|V~(d)||V~(q)| (8)
In equation (8), the numerator represents the dot product of the vector V~(d) and
~
III. APPLYING TF-IDF, VSM AND CCS TO TBIR METHODS
2
Two Modes of the experimental TBIR System
and Image Ranking
As shown in Table 6, the experimental TBIR system implemented with TF-IDF, VSM and CCS measure is represented by Mode 1. Mode 2 represents the experimental TBIR system implemented with only the TF-IDF technique.
System Mode TF-IDF Vector Space Model(VSM) CCS
Mode 1 √ √ √
Mode 2 √ × ×
TABLE 6: System Modes.
In Mode 1, the retrieved images are ranked by their cosine similarities. The higher an image’s cosine similarity, the higher its rank is. Similarly, in Mode 2, the retrieved images are ranked by their TF-IDF weights. The higher an image’s TF-IDF weight, the higher its rank is.
3
System Diagram and Algorithms
This section provides a global view of the experimental TBIR system, which will help understand how components work with each other. Moreover, two algorithms implemented in the experimental system will be introduced.
III. APPLYING TF-IDF, VSM AND CCS TO TBIR METHODS
• TF-IDF calculating (Algorithm 1)
• Buliding the term-document matrix using VSM
• Calculating similarity using CCS measure (Algorithm 2)
FIGURE 2: The overview of the experimental TBIR system.
III. APPLYING TF-IDF, VSM AND CCS TO TBIR METHODS
FIGURE 3: The user interface of the system.3
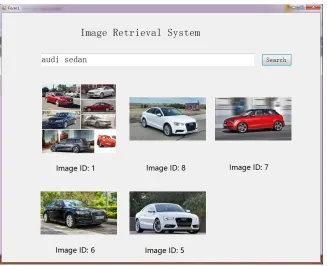
Figure 3 shows the user interface of the experimental TBIR system. A user can input his query using the textbox on the top. When he finishes inputting the query, the “search” button needs to be clicked to perform image retrieval.
After the query is processed, top 5 relevant images are displayed in descending order by similarity. Figure 3 illustrates an example of the image retrieval results which contain five images. It can be seen that the results are related to the query “audi sedan”.
More importantly, as shown in Figure 2, there are two algorithms implemented in the query processing component. In the following, these two algorithms will be discussed in more detail.
Algorithm 1 is implemented to calculate the TF-IDF weights of each index term in every document in the document collection. Moreover, the number of documents in the document collection will be added one when calculating the TF-IDF weights for index terms, because the query is also considered as one document and added to the document collection. Algorithm 1 takes query and documentCollection which is the
III. APPLYING TF-IDF, VSM AND CCS TO TBIR METHODS
document collection in the database4 as the input. For output, arrayF inal(x, y) is an 2-dimensional array which is to represent the matrix (7), wherex represents rows andy represents columns. Accordingly,xis the count number of relevant images and
y is the count number of index terms in query.
To be more precise about Algorithm 1, for each index term in query, the algorithm searches thedocumentCollectionwith theindex termin the database(line 1.6). Then it calculates the document frequency(df) of theindex termand stores the df value in variable n (line 1.7). In the loop (line 1.8 - line 1.10), sum is accumulated in each iteration. After the loop, arrayF inal(x, y) is initialized(line 1.11).
Algorithm 1: Calculate TF-IDF weights
Input: query: the query string.
documentCollection: the document collection in the database.
Output: arrayF inal(x, y): an array contains all TF-IDF weights of each
index term in every document in documentCollection
1 let i = 0; tf idf = 0; tf = 0; idf = 0; counts= 0; n = 0; sum= 0; t = 0; 2 let l = the number of index terms in query.
3 let subImage() = null;
4 Count the number of images in documentCollection and store the number in t;
5 foreach index term in query do
6 Search the documentCollectionin the database with the index term; 7 Calculate the document frequency of the index term and store the number
in n;
8 if n >0then ; . means if there is at least one image retrieved
9 sum= sum+ n;
10 end if
11 let arrayF inal(x, y) = arrayF inal(sum, l)
III. APPLYING TF-IDF, VSM AND CCS TO TBIR METHODS
12 foreach index termin query do
13 Search documentCollection in the database with index term and store the retrieved image collection in subImage();
Count the number of images in subImageand store the number in n;
14
15 if n >0then
16 idf = log2 t+1
n ; . t+1 means include the query as one document.
end if
while i <n do
counts = the TF weight of the index term insubImage(i) ;
tf =counts;
i = i+ 1;
tf idf =tf ×idf;
store the tf idf weight in arrayF inal(x, y);
17 18 19 20 21 22 23
24 clear the data in subImage(),n, tf, i and idf;
25 return arrayFinal(x,y);
Next, for each indexterm in the query, the experimental TBIR system searches for imageswith the indextermindocumentCollection inthe database andthe retrieved image collection is stored in variable subImage5 (line 1.13). Then the number of images in subImage is counted and the counted numberis stored in variable n (line 1.14). If there are images match the indexterm, which means n > 0 (line 1.15), the IDF weightof the indexterm iscalculated and the value is storedin variableidf
(line 1.16). In addition, if n = 0, this means there is no image’s annotation matches the current indexterm. In this case, it is obvious that the following code will not be executed and the program will jump to the next iteration of the for-each loop. Next, for eachimage insubImage(), the algorithm calculates the term frequency of the indextermin the current image subImage(i) and stores the value in variable tf
(line 1.19 - line 1.20). Then the TF-IDF weight of the indexterm in the current
III. APPLYING TF-IDF, VSM AND CCS TO TBIR METHODS
image subImage(i) is calculated and the value is stored in variable tf idf (line 1.22). After that, the tf idf weight is stored in array arrayFinal(x,y) (line 1.23). Nextthe data in subImage, n, tf, i and idf is cleared for the use of the next iteration of the for-each loop (line 1.24). In the end, arrayFinal(x,y) is returned as the output (line 1.25).
ThenextalgorithmisAlgorithm2whichcalculatesthesimilaritiesbetweenthequery and documents. The algorithm takes arrayFinal(x,y) which is populated by Algo-rithm1,queryanddocumentCollectionastheinput. Foroutput,arraySimilarity(x,y) isa 2-dimensional array, where xrepresents rowsand y representscolumns. Accord-ingly, x is the count number of relevant images and y is one. Moreover, y represents the similarity value column.
Algorithm 2: Calculate similarity
Input: arrayF inal(x, y): an array which contains all TF-IDF weights.
query: the query string.
documentCollection: the document collection in the database.
Output: arraySimilarity(x, y): an 2-dimensional array which contains all
similarity values in descending order between documents and query;
1 let i = 0, j = 0; 2 let n = 0;
3 let numerator = 0; 4 let denominator = 0; 5 let similarity = 0;
6 let length= x×y; ; . x and y are the values in arrayF inal(x, y)
III. APPLYING TF-IDF, VSM AND CCS TO TBIR METHODS
9 while i<length do
10 foreach index term in query do
query the documentCollection with the index term; 11
12 calculate the document frequency of the index term and store the number in n;
numerator =numerator+arrayF inal(i, j)×log2 sumn ; 13
14 denominator =denominator+ (arrayF inal(i, j))2×(log 2
sum n )
2; j =j+ 1;
similarity = √numerator
denominator;
store similarity value in arraySimilarity(x, y);
i=i+ 1; 15
16
17
18
19 j = 0, numerator = 0, denominator = 0, similarity = 0, n = 0; 20 return arraySimilarity(x,y);
The while loop (line 2.9) and the for-each loop (line 2.10) are combined togetherto iterate the arrayFinal(x, y) array. According to equation (8) in Section 1.3 in Chapter 3, the similarities between every document and the query are calculated (line 2.11 - line 2.16). Then the similarity is stored in array arraySimilarity(x,y) (line 2.17). At last, the arraySimilarity(x,y) is returned as the output (line 2.20).
III. APPLYING TF-IDF, VSM AND CCS TO TBIR METHODS
4
Complexity
Analysis
It is of importance to analyze the complexity of the algorithms implemented in the experimentalTBIRsystem. ThereforetheBigONotation[5]isutilizedtoanalyzethe experimentalTBIRsystem’scomplexitybydescribingthecomplexityofanalgorithm. Moreover,BigONotationspecificallydescribestheworst-casescenario[5]andcanbe used to describe the executiontime requiredby an algorithm. For the experimental TBIR system, the worst-casescenariois when there are a large numberof images in the database.
ThetwoalgorithmsbeingimplementedintheexperimentalTBIRsystemcanbefound inSection3ofthischapter. Accordingtothetwo algorithms,theexperimentalTBIR system mainlyconsistsoftwo steps: TF-IDF Calculationand SimilarityCalculation.
In a document collection, letq equal tothe number of index terms in auser’s query andletsequaltothecount numberof relevantimagesretrievedcorrespondingtothe query. Also,let nk equal to the documentfrequency of index term k (1 ≤ k ≤ q) in
the user’s query.
For Algorithm1, the time complexity of line 1.1, line 1.2, line 1.3, line 1.4, line 1.11 and line 1.14 is constant, which is 6O(1). Inside of the for-each loop (line 1.5), the time complexity of line 1.6 to line 1.9 is 4O(q). Then, for the second for-each loop (line 1.12), the time complexity of line 1.13 to line 1.16 and line 1.24 is 5O(q). Moreover, thereis anestedwhile loop (line1.18) insideof the secondfor-each loop, the time complexity of line 1.19 to line 1.23 is Pk
15O(nk). Overall the time complexity of Algorithm 1 is: O(q) ×Pk
15O(nk) + 9O(q) + 6O(1).
III. APPLYING TF-IDF, VSM AND CCS TO TBIR METHODS
Since the query is considered a very short document, q is small. Accordingly, in summary, the asymptotic time complexity of each algorithm is:
• Algorithm 1: Pk
1O(nk). • Algorithm 2: O(s).
The total asymptotic time complexity of the 2 algorithms is: Pk
CHAPTER IV
Experiment
There are two purposes of this experiment. The first one is to investigate the ef-fectiveness of applying the three IR techniques (TF-IDF, VSM, CCS measure) to the experimental TBIR system by comparing the precision of the system in two dif-ferent modes (Mode 1 and Mode 2). Mode 1 represents the experimental TBIR system implemented with TF-IDF, VSM and CCS measure. Mode 2 represents the experimental TBIR system implemented with only the TF-IDF technique. There are image retrieval systems discussed in Chapter 2 utilizing TF-IDF, VSM and CCS measure together. However, these image retrieval systems are TBIR and CBIR hy-brid approaches, only the performance of the hyhy-brid systems are evaluated. The second purpose is to investigate how the repeated index terms in the annotation of an image affect the performance of the experimental TBIR system in terms of image ranking in the two modes of the system. Experiment results are collected through a VB.Net-based application on a PC. The configuration of the PC is 2.4 GHz Intel CoreTMi7-4700MQ processor and 16 GB of RAM in Windows 7 environment.
For the experiment in Mode 2, TF-IDF is the only technique utilized in the exper-imental TBIR system. To implement TF-IDF technique in the experexper-imental TBIR system, given a query Q composed of a set of index terms ti(1 ≤ i ≤ n), in the
IV. EXPERIMENT
Finally the TF-IDF weight for documentd is:
Wd= n
X
i=1
tf-idfti,d (1)
Equation (1) is the traditional method of applying TF-IDF technique on TBIR and it is also elegant in its simplicity[38].
1
Database Preparation
Before the experiments are conducted, it is of importance to find proper image databases. Since the experiment environment is TBIR, two databases which con-sist of images and annotations are utilized for the experiment. The first one Ground Truth Database[34] is developed at the University of Washington and relatively small. It contains around 1000 images. Figure 4 describes the structure of the database.
FIGURE 4: Structure of the Ground Truth Database.
IV. EXPERIMENT
unique for each image. N ame is used to distinguish images under the same category.
Description is the image annotation. The last column category describes which category an image belongs to.
The second database is IAPR TC-12[14]. It consists of around 20,000 still natural images which covers sports and actions, photographs of people, animals, cities, land-scapes and many other aspects of contemporary life. The structure of the IAPR TC-12 database is shown in Figure 5. There are four columns in the database:
id, imageid, category and description. Idis the primary key which is unique for each image. Imageid is used to distinguish images under the same category. Category
describes which subset an image belongs to. The last column Description is the annotation which describes the image content.
IV. EXPERIMENT
2
Precision Experiment
To investigate the effectiveness of applying the three IR techniques (TF-IDF, VSM, CCS measure) to the experimental TBIR system, precision[29] is utilized to measure the proportion of the number of relevant images retrieved in the number of retrieved images. Precision is a measure of result relevancy. It shows how many relevant images the experimental TBIR system retrieves. A higher precision means that in the retrieved images, there are more relevant images, while a lower precision means just the opposite. After images are retrieved, it is important to know how many relevant images are retrieved. Of course, users do not want to see irrelevant results. For this experiment, the IAPR TC-12 database is utilized. Ten queries (shown in Table 7) are submitted to the experimental TBIR system. Then for each query, precision is calculated for the top 1 to 10 retrieved images respectively.
Number Query
1 tourist group 2 white church 3 tennis player 4 car park 5 blue helmet 6 narrow bay
7 river under waterfall 8 light brown footpath 9 fountain square 10 train station
IV. EXPERIMENT
Equation (2)[29] below describes how to calculate precision in traditional IR:
P recision= Number of relevant documents retrieved
Number of documents retrieved (2)
In the experiment, images’ annotations are considered as documents. Therefore, precision is defined as the number of relevant images retrieved divided by the number of images retrieved.
To determine the number of retrieved images for the experimental TBIR system in both Mode 1 and 2, when a query is submitted to the experimental TBIR system, as long as an image’s TF-IDF weight corresponding to the query is not zero, this image is considered retrieved.
In order to distinguish relevant images from retrieved images, in the following exper-iments, to avoid the subjective bias, only images that obviously do not match the query are considered irrelevant. That is to say, an image is considered relevant to a query if the concept of the query is clearly visible in the image. Also, the concept should relate to the visual content of the image easily and consistently with common knowledge. For example, suppose a query is “mid size sedan”. If there is a retrieved image about trains, it is considered irrelevant. This method has been used in the study of Li, Xirong et al.[26], Tong, Simon et al.[47], Ogle, Virginia et al.[35], Jain, Vidit et al.[19], etc. The authors utilized this method and successfully conducted their experiments.
IV. EXPERIMENT
FIGURE 6: Experiment result of precision for Query 1.
the consistency of precision before and after top 5 retrieved images. Therefore, instead of calculating the precision for the whole retrieved images collection corresponding to a query, only top 1 to 10 retrieved images in the whole retrieved images collection are taken into account.
IV. EXPERIMENT
FIGURE 7: Experiment result of precision for Query 2.
FIGURE 8: Experiment result of precision for Query 3.
IV. EXPERIMENT
FIGURE 9: Experiment result of precision for Query 4.
FIGURE 10: Experiment results of top 1 and 2 retrieved images for Query 4.
IV. EXPERIMENT
concept of Query 4 “car park” is not clearly visible in these 2 images, which means the 2 images in Figure 10 are irrelevant to Query 4.
FIGURE 11: Experiment result of precision for Query 5.
Figure 11 shows that overall, for the 5th query, the experimental TBIR system in Mode 1 performed better than in Mode 2 in terms of precision. Only the precisions of top 1 to 2 retrieved images generated by Mode 1 and 2 are the same.
IV. EXPERIMENT
FIGURE 13: Experiment result of precision for Query 7.
Figure 12 and 13 shows that overall, for the 6th and 7th query, the experimental TBIR system in Mode 1 performed better than in Mode 2 in terms of precision. Only the precisions of top 1 to 2 retrieved images corresponding to the 7th query in Mode 1 and 2 are the same.
However, for the precision of top 1 to 3 retrieved images generated by Mode 2 for Query 6, they are both zero. Figure 14 shows the top 1 to 3 retrieved images generated by Mode 2. It is evident that the concept of Query 6 “narrow bay” is not clearly visible in these 3 images, which means the 3 images in Figure 14 are irrelevant to Query 6.
IV. EXPERIMENT
FIGURE 15: Experiment result of precision for Query 8.
FIGURE 16: Experiment result of precision for Query 9.
IV. EXPERIMENT
However, for the precision of top 1 to 5 retrieved images generated by Mode 2 for Query 9, they are both zero. Figure 17 shows the top 1 to 5 retrieved images generated by Mode 2. It is evident that the concept of Query 9 “fountain square” is not clearly visible in these 5 images, which means the 5 images in Figure 17 are irrelevant to Query 9.
FIGURE 17: Experiment results of top 1 and 5 retrieved images for Query 9.
FIGURE 18: Experiment result of precision for Query 10.
Figure 18 is the experiment results of precision corresponding to the 10th query. It can be seen that overall, the experimental TBIR system in Mode 1 performed better than in Mode 2 in terms of precision. Only the precisions of top 1 retrieved images corresponding to the 10th query in Mode 1 and 2 are the same.
IV. EXPERIMENT
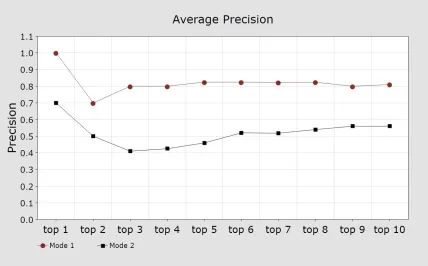
there are 9 results which the experimental TBIR system in Mode 1 performed better in Mode 2 in terms of precision. Only the result in Figure 7 (Query 2) shows that the performance of the experimental TBIR system in Mode 1 is identical to that in Mode 2 in terms of precision. Figure 19 is the summary of the experiment results regarding the average precision corresponding to the 10 queries. The line with round bullet represents the results generated by Mode 1 and the line with square bullet represents the results generated by Mode 2. It can be seen that overall the experimental TBIR system in Mode 1 performed better than in Mode 2 in terms of average precision. For the top 1 retrieved image, in Mode 1 the average precision is 1, while in Mode 2, it is 0.7. For the top 2 retrieved images, the average precision drops to 0.7 in Mode 1, while it is 0.5 in Mode 2. For the top 3 to 10 retrieved images, the average precision stabilizes at around 0.8 in Mode 1, while in Mode 2, the average precision stabilizes at around 0.5.
FIGURE 19: Average Precision.
IV. EXPERIMENT
are irrelevant images retrieved. After carefully investigating this issue, we found that there are some images whose annotations contain misleading index terms. In this case, these images are considered noisy images. For example, Figure 20 is a noisy image (ImageID: 2338) in the IAPR TC-12 database. The annotation of this image is “a river with dense vegetation”. Apparently, the content of the image does not contain the concept “a river”. Suppose there is a query Q = “a river” submitted to the experimental TBIR system, this image may be retrieved. However, the image does not contain any information related to a river. Consequently, this image is irrelevant to the query and becomes a noisy image.
FIGURE 20: Example of a noisy image.
IV. EXPERIMENT
FIGURE 21: Example of an image contains repeated index terms.
3
Repeated Index Terms and TBIR Performance
Since in the last experiment (Precision Experiment), repeated index terms are sus-pected of being the cause of bringing down the precision, this experiment is carried out to investigate how the repeated index terms in the annotation of an image affect the performance of the experimental TBIR system in the two different modes. To ac-quire more accurate result, this experiment is conducted on four different databases, which is described in the following section 3.1, 3.2, 3.3 and 3.4 respectively.
3.1
Experiment on the Ground Truth Database
IV. EXPERIMENT
Image Annotation of the 1st image System Mode Ranking
Original: house sky big leafless
grey trees
1 #1
2 #1
Modified: house sky trees big
trees leafless trees grey trees
1 #2
2 #1
TABLE 8: Summary of ranking of the 1st image.
We may discover from Table 8, when the index term “trees” repeated four times in the modified annotation of the 1st image, the image’s ranking dropped from #1 to #2 in Mode 1 while the ranking remains the same in Mode 2. It is conceivable that if there are more repeated index term “trees” in the annotation of the 1st image, the image’s ranking will continue to drop in Mode 1. However, if the image with modified annotation exists, it is hard to say that this image is less relevant than other relevant images retrieved. It may still be the most relevant image. On the other hand, it is also difficult to say that this image is still the most relevant one.
Table 9 is the summary of the 2nd selected image’s ranking among the retrieved images when the corresponding query is “buildings sky”.
Image Annotation of the 2nd image System Mode Ranking
Original: tall red green collapsed
buildings sky steps
1 #2
2 #2
Modified: buildings sky steps tall
buildings red buildings green buildings
1 #3
2 #1
TABLE 9: Summary of ranking of the 2nd image.
It is clear to see that when the index term “buildings” repeated four times in the modified annotation of the 2nd image, the image’s ranking dropped from #2 to #3 in Mode 1 while the ranking increased from #2 to #1 in Mode 2.
IV. EXPERIMENT
the experimental TBIR system could be affected by repeated index terms. The rank-ing of an image that contains repeated index terms could drop in Mode 1, while in Mode 2 the image’s ranking could increase in Ground Truth Database.
3.2
Experiment on Car Database
IV. EXPERIMENT
ImageID Description Figure
1 mazda6 sedan, ford fusion sedan, honda ac-cord sedan, nissan altima sedan, vw passat sedan, vw golf wagon, car collection
2 mazda wagon
3 audi sedan
4 audi sedan a4 2013
5 audi sedan a5
6 audi sedan a6
7 audi sedan a1
8 audi sedan a3
9 audi sedan a4 2005
10 audi sedan a8
IV. EXPERIMENT
As shown in Table 10, the constructed database consists of three columns which are ImageID,Description andF igure, whereImageID is the primary key which is unique for each image. Descriptionis the image annotation. The last columnF igure
is the actual image. It is obvious that in the description of Image 1, the index term “sedan” repeated many times compared to other images. Therefore, a query “audi sedan” is submitted to the experimental TBIR system in Mode 1 and 2 respectively. The experiment results of the two modes are shown in Figure 22, 23 and Table 11 respectively. The ranking order of images shown in Figure 22 and 23 is from left to right and top to bottom.
IV. EXPERIMENT
FIGURE 23: The retrieval result of the experimental TBIR system in Mode 2.
(A)
Ranking # Image ID Cosine Similarity
#1 9 0.95
#1 8 0.95
#1 7 0.95
#1 6 0.95
#1 5 0.95
#1 4 0.95
#1 3 0.95
#1 10 0.95
#2 1 0.68
#3 2 0
(B)
Ranking # Image ID TF-IDF Weight
#1 1 0.76
#2 8 0.45
#2 7 0.45
#2 6 0.45
#2 5 0.45
#2 4 0.45
#2 3 0.45
#2 9 0.45
#2 10 0.45
#3 2 0
IV. EXPERIMENT
It can be seen from Figure 22 and 23 that images ranked from 2 to 5 are the same and relevant to the query. However, in Figure 22, the most relevant image (Ranking #1) is Image 9 which is relevant to the query, while in Figure 23, the most relevant image is Image 1 (shown in Figure 24) which obviously does not contain any information related to the query “audi sedan”. It can be seen that the experimental TBIR system in Mode 2 provided an inaccurate image to users. Moreover, the ranking of the inaccurate image is #1.
FIGURE 24: Image 1 in the “car database”.
IV. EXPERIMENT
This experiment indicates that when images’ annotation contain repeated index terms that match the query, the retrieved images in the 2 different modes could be different. Moreover, in Mode 2, the experimental TBIR system may provide inaccurate images to users, which indicates that the performance of the experimental TBIR system in Mode 2 could be worse than in Mode 1 in terms of image ranking.
3.3
Experiment on extended Car Database
In the last experiment, the database is fairly straightforward. Consequently, in this experiment, the experimental TBIR system is tested in a more complicated database. The “Car database” is extended, more images are added to it. Because it takes too much space to introduce the detail of the database in the main body of this thesis, the detail of the extended “Car database” is shown in Appendix A.
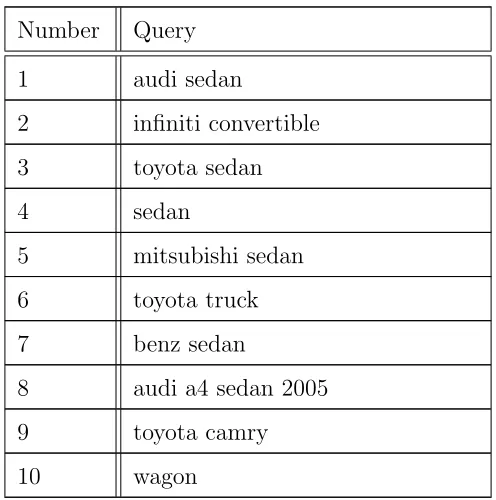
In this experiment, ten queries (shown in Table 12) are submitted to the experimental TBIR system and the detailed rankings of the retrieved images in two different modes are recorded in Appendix B.
Number Query 1 audi sedan
2 infiniti convertible 3 toyota sedan
4 sedan
5 mitsubishi sedan 6 toyota truck 7 benz sedan
8 audi a4 sedan 2005 9 toyota camry 10 wagon
IV. EXPERIMENT
Figure 25 shows the experiment results corresponding to query 1 (“audi sedan”) in Mode 1 and 2 respectively. In Figure 25, group (A) represents the top 5 images retrieved by the experimental TBIR system in Mode 1 and group (B) represents the top 5 images retrieved by the experimental TBIR system in Mode 2. For each group from left to right, the images’ ranking order decreases.
(A)
(B)
FIGURE 25: Retrieval result for Query 1: audi sedan.
FIGURE 26: The retrieval result of the experimental TBIR system in Mode 2.
IV. EXPERIMENT
the query “audi sedan”. Consequently, the performance of the experimental TBIR system in terms of image ranking is affected by repeated index terms in Mode 2, while in Mode 1, the system is not affected.
The experiment results corresponding to the rest of the 10 queries can be found in Appendix C. The summary of the experiment results is shown in Table 13.
Query Number of irrel-evant images in Mode 1
Number of irrel-evant images in Mode 2
1 0 1
2 0 1
3 0 1
4 0 0
5 0 1
6 0 1
7 0 1
8 0 1
9 0 0
10 0 0
TABLE 13: Summary of experiment results.
It can be seen from Table 13 that for query 1, 2, 3, 5, 6, 7 and 8, the experimental TBIR system in Mode 2 retrieved inaccurate results. In Mode 1, for all the 10 queries, the retrieved images are related to queries and their rankings are reasonable.
IV. EXPERIMENT
3.4
Experiment on IAPR TC-12 Database
Finally, to test the performance regarding image ranking of the experimental TBIR system on a larger and more practical database, IAPR TC-12 database is utilized. In the database, we found that the index term “a” repeated in many images’ annotations and some of them are unnecessary. For instance, the annotation of an image (Image ID: 24906) is “a woman with a white sweater is painting a wall with a purple colour newspaper on gray stairs in the background”. In this case, index term “a” repeated four times, which may affect the ranking of the image when the query contains the index term “a”. Accordingly, to verify this hypothesis, 30 groups of queries (Section 1 of Appendix D) are submitted to the experimental TBIR system respectively. For each group, it contains two very similar queries. The only difference between them is that one query includes index term “a” and the other one does not. The experimental TBIR system ran in two different modes on each query. The detailed experiment results are recorded in section 2 of Appendix D.
Figure 27 is the summaries of the experiment results corresponding to the 30 groups of queries. For each figure in Figure 27, the horizontal axis represents the groups, and the vertical axis represents the number of obvious non-relevant images to a query. The four figures in Figure 24 represents:
1. Figure 27 (A) is the experiment result generated by the experimental TBIR system in Mode 1 and queries submitted to the system contain the repeated index term “a”.
2. Figure 27 (B) is the experiment result generated by the experimental TBIR system in Mode 2 and queries submitted to the system contain the repeated index term “a”.
IV. EXPERIMENT
IV. EXPERIMENT
(A)
(B)
(C)
(D)
IV. EXPERIMENT
It can be seen from Figure 27 (C)(D), for the 30 groups of queries, when queries submitted to the experimental TBIR system do not contain the repeated index term “a”, the results generated by the system in Mode 1 and 2 rarely have non-relevant images. There is only one non-relevant image in group 5 in Mode 2. It can be seen from Figure 27 (A), while queries submitted to the experimental TBIR system contain the repeated index term “a”, the results generated by the system in Mode 1 have some non-relevant images. In group 2, 13, 26, 27 and 28, there is one non-relevant image respectively. However, as can be seen from Figure 27 (B), in most cases, the results generated by the experimental TBIR system in Mode 2 contain non-relevant images. For the 30 groups of queries, there are 26 groups of queries that the experimental TBIR system provided obvious non-relevant images to users in Mode 2. In the 30 groups, only group 3, 6, 10 and 14 do not contain non-relevant images in Mode 2.
The experiment result indicates that images’ annotations containing repeated index terms can affect the performance of the experimental TBIR system in terms of image ranking in both Mode 1 and 2 when repeated index terms in images annotations match index terms in the query. The performance of the experimental TBIR system in Mode 2 is significantly affected by repeated index terms, while the repeated index terms had little influence on the experimental TBIR system in Mode 1.
4
Discussion
Experiments are conducted on the experimental TBIR system. The experiment re-sults are summarized as the following: