ABSTRACT
Meyer, Kristin Jennifer. An Evaluation of Methods for Estimating Ground Cover and Soil Compaction as Visitor Impact Indicators. (Chair of Committee: Dr. Yu-Fai Leung)
AN EVALUATION OF METHODS FOR ESTIMATING GROUND COVER AND SOIL COMPACTION AS VISITOR IMPACT INDICATORS
by
KRISTIN JENNIFER MEYER
A thesis submitted to the Graduate Faculty of North Carolina State University in partial fulfillment of the requirements
for the Degree of Masters of Science
NATURAL RESOURCES WITH THE OUTDOOR RECREATION TECHNICAL OPTION
Raleigh, North Carolina June, 2004
APPROVED BY:
_______________________________ _______________________________ Dr. Gene Brothers Dr. Gary Blank
________________________________ Chair of Advisory Committee
DEDICATION
I dedicate this thesis to my family for their love and support:
Fabián González Vásquez, my husband Martín González-Meyer, my son
Karl Meyer, my dad Barbara Meyer, my mom Jeremy Meyer, my brother
&
BIOGRAPHY
I, Kristin Meyer, was born in Tempe, Arizona, on January 3, 1976. I have since moved around so much I just simply call myself a citizen of the world, not knowing where to call my hometown. I have lived in Stamford, CT; Phoenix, AZ; Hampden, MA; Rancagua, Chile; Tempe, AZ; Santa Clara, CA; Boston, MA; and Raleigh, NC. I have spent at least one night in the following countries: Mexico, Canada, England, Chile, Argentina, Scotland, France, Holland, Germany, Italy, and Switzerland. I am fluent in Spanish thanks to my year-long study abroad experience in Chile during high school. I am who I am today because of that trip to Chile.
After I finished high school, I spent four years in beautiful Tempe, Arizona where I studied and chased the storms throughout the state. During May of 1998, I graduated Cum Laude from Arizona State University with a B.S. in Geography with an emphasis in Meteorology. The weekend I graduated I moved to California. I lived near Big Basin National Park where the beauty of the magnificent redwood trees changed my life forever.
The last past few years have been the best. January 2002, a university professor asked me to be his graduate student. On May 25, 2002, I got married to my Chilean sweetheart. On June 2, 2003, our first son was born. Now, summer 2004, I will be graduating with my Masters degree in Natural Resources in Outdoor Recreation and will start a summer internship with the U.S. Forest Service.
ACKNOWLEDGEMENTS
TABLE OF CONTENTS
Page
List of Tables ... viii
List of Figures... ix
List of Symbols or Abbreviations ... x
Chapter I: General Introduction... 1
THE ISSUE OF VISITOR IMPACTS ...1
THE VERP FRAMEWORK ...2
INDICATOR DEVELOPMENT...4
THE BOSTON HARBOR ISLANDS ...6
RESEARCH OBJECTIVES ...8
THE STRUCTURE OF THESIS...8
Chapter II: Ground Cover... 9
INTRODUCTION ...10
METHODS FOR MEASURING GROUND COVER...11
METHODOLOGY ...14
Study Area --- 14
Field Procedures --- 15
Sampling Plot Design --- 18
Ground Cover Methods Selected --- 20
Analysis --- 23
RESULTS ...24
Georges Island --- 24
Grape Island --- 28
DISCUSSION AND IMPLICATIONS ...32
LIMITATIONS AND CONCLUSIONS ...35
Chapter III: Soil Compaction... 39
INTRODUCTION ...40
MEASURING SOIL COMPACTION ...40
METHODOLOGY ...44
Study Area --- 44
Field Procedures --- 45
Sampling Plot Design --- 46
Penetrometers Selected --- 47
Analysis --- 48
RESULTS ...49
Georges Island --- 49
Grape Island --- 51
Penetration Depths --- 53
DISCUSSION AND IMPLICATIONS ...53
LIMITATIONS AND CONCLUSIONS ...58
Literature Cited ... 67
Appendices... 71
APPENDIX A: FIELD DATA COLLECTION FORMS AND HANDOUTS...72
APPENDIX B: SUPPLEMENTAL TABLES AND FIGURES ...77
LIST OF TABLES
Page
Table 2.1. Assessment Methods used in Some Previous Recreation Studies... 12
Table 2.2. Ground Cover Assessment Scale... 21
Table 2.3.Ground Cover Data: Analysis of Data from the Field. ... 22
Table 2.4. Overall Ground Cover Estimation Results: Georges Island (All months combined) ... 25
Table 2.5.Georges Island Ground Cover Estimates: Comparison of the Quadrat and Transect Methods (All months combined) ... 26
Table 2.6. Overall Ground Cover Estimation Results: Grape Island (All months combined) 29 Table 2.7.Grape Island Ground Cover Estimates Comparison of the Quadrat and Transect Methods (All months combined) ... 30
Table 3.1. A Comparison of the Four Different Approaches to Measuring Soil Compaction. ... 41
Table 3.2. Penetration Resistance Measurements on Georges Island (Ud Soil) Using Two Types of Penetrometers... 50
Table 3.3. Relative Changes in Penetration Resistance on George Island (Ud Soil). ... 51
Table 3.4. Penetration Resistance Measures on Grape Island (NpC/PtB Soil) Using Two Types of Penetrometers... 52
Table 3.5. Relative Changes in Penetration Resistance on Grape Island (NpC/PtB Soil)... 53
Table 4.1. Evaluation of Methods Using the Good Indicator Criteria... 64
Table B1. Results for the Overall Estimation Method... 77
Table B2. Georges Island Ground Cover Estimates: Comparison of the Quadrat and Transect Methods for August ... 78
LIST OF FIGURES
Page
Figure 1.1. Map of the Boston Harbor Islands National Park Area... 7
Figure 2.1. The Sampling Plot Design... 19
Figure 2.2. Georges Island: Comparison of Two Ground Cover Estimation Methods over Time (high and low use sites combined). ... 28
Figure 2.3. Grape Island: Comparison of Three Ground Cover Estimation Methods Over Time (high and low use sites combined). ... 32
Figure A1: Ground Cover Vegetation Assessment Handout... 72
Figure A2: FORM A: Sampling Plot and Quadrat-Based Measurements... 73
Figure A3: FORM A1: Penetration Resistance at Controls... 74
Figure A4: FORM B: Line Transect Continuous Assessment and Soil Tests... 75
LIST OF SYMBOLS OR ABBREVIATIONS BOHA Boston Harbor Islands National Park Area
GMP General Management Plan
LAC Limits of Acceptable Change NPS US National Park Service
PP Pocket Penetrometer
PR Penetration Resistance
SCT Soil Compaction Tester
SNG Surface Nuclear Gauges
CHAPTER I: GENERAL INTRODUCTION
THE ISSUE OF VISITOR IMPACTS
Resource impacts caused by visitor use are an increasingly important issue in park and protected area management globally as park visitations continue to grow. Visitor use in parks usually causes some form of impact to the environment. Activities such as walking, hiking, horseback riding, snowmobiling, mountain biking and climbing may lead to soil compaction, soil erosion, vegetation loss, change in vegetation composition, tree damage, altered wildlife behavior, and reduced water quality. Many of these impacts have been studied and monitored in the USA and abroad, particularly on campsites and trails (Hammitt & Cole, 1998). Condition class ratings, rapid assessment, and quantitative measurements are some of the methods used to assess and monitor visitor impacts.
Experience and Resource Protection (VERP). These frameworks share a lot in common, including the critical role of indicators, standards, and monitoring programs.
Mandated by the 1978 National Parks and Recreation Act (P.L. 95-625), each unit within the National Park System must address carrying capacity in their new or updated general management plans (GMP) (NPS, 2000). When the Boston Harbor Islands (BOHA) became a new unit of the National Park System in 1996 it was also required to address the carrying capacity issue in their first GMP through a VERP process. This study evaluated different methods for visitor impact monitoring as part of a large project that assisted this new national park unit in its VERP implementation.
THE VERP FRAMEWORK
There are nine steps in the VERP process to help managers determine what and where visitor and resource impacts are most prominent and how to manage and monitor them (VERP, 1997).
1. Assemble an interdisciplinary project team. 2. Develop a public involvement strategy.
3. Develop statements of park purpose, significance, and primary interpretive themes. Identify planning constraints.
4. Analyze park resources and the existing visitor use.
5. Describe a potential range of visitor experiences and resource conditions. 6. Allocate the potential zones to specific locations in the park (Prescriptive
7. Select indicators and specify standards for each zone. Develop a monitoring plan.
8. Monitor resource and social indicators. 9. Take Management Action.
Steps one through six are required parts of a GMP. The first two steps guide the managers on how to put together a planning group and get the public involved. Step three is when the managers have to determine the park’s different purposes, significances, themes and constraints. Steps four and five analyze current and potential ranges of resource and visitor impacts. It is only through step four that a carrying capacity study is needed. Step six allocates the themes to areas of the park that are appropriately based on the findings in step five.
Individual park units implement steps seven through nine somewhat differently. This is because each park has a different set of indicators and standards to monitor. Through these steps managers are informed about what impacts, indicators, and standards currently exist in their parks and are offered guidance on ways to monitor and manage the impacts. In the end, park managers will determine how monitoring of impacts is implemented.
lead-time to do research on habitats, staff expertise, and their constraints in both lead-time and money . As more studies are being conducted, the VERP process will be continuously improved and enhanced by the National Park Service (NPS, 1997).
INDICATOR DEVELOPMENT
The selection of indicators for a monitoring program is step seven in the VERP process. Indicators are specific and measurable variables reflecting the overall physical, ecological, and social aspects of management zones. Good indicators are easy to measure, easy to train observers for monitoring, cost effective, and the variability of the measurement techniques are relatively low (NPS, 1997). Some examples are the extent and condition of social trails, the conditions of official trails, the conditions of recreation sites (official and unofficial), facility proximity to sensitive resources, trash or human waste, vandalism, tree damage, soil quality, and vegetation quality. These indicators are broad categories that can be further broken down and measured in many ways. Most of these indicators were assessed in the BOHA carrying capacity study.
Ground cover estimates (vegetation and bare soil) are some of the most common indicators in recreation ecology and for impact monitoring programs (Liddle, 1997). Like cover estimates, frequency counts and density measurements are two other types of quantitative parameters related to the abundance of vegetation. Vegetation density measurements and frequency counts are time consuming. Vegetation density measures are evaluated by counting all plant individuals in sampling plots. Vegetation frequency counts measure the number of times a species occurs in a given number of repeatedly placed plots or points. A good working knowledge of plant taxonomy is essential for density and frequency because they are dependent on species or individual plants. For cover, though, knowledge of plant taxonomy is helpful, but only needed if doing an in-depth and detailed coverage study. Sampling, whether for density, frequency, or cover, can be inaccurate depending on the areas and dispersion of the coverage. Compared to density and frequency, cover estimates are relatively easy to measure. Ground cover estimates along with vegetation height measures plant biomass, an important measure in forest inventory studies. The biggest advantage for cover estimates is that all ground cover types can be evaluated in comparable terms (Mueller-Dombois & Ellenberg, 1974). This cannot be done with density or frequency.
THE BOSTON HARBOR ISLANDS
The Boston Harbor has been an essential part of the history and culture of the Boston, Massachusetts, since even before European settlers arrived to the east coast of the USA. The islands are mostly drumlins created by glaciers (Figure 1.1). The Native Americans found the islands a great place to hunt and fish from early spring to late autumn (BOHA, 2003b). As explorers and settlers came new stories, myths, and legends were created. By the mid-1900’s, the harbor waters became polluted and the islands neglected because the Bostonians were forgetting about the significant history and culture of the islands. There was one person who was very important in the idea of preserving and cherishing the harbor by creating a park. Edward Rowe Snow beckoned and warned the people of Boston not to neglect the islands nor forget about the natural treasures on and around them (Snow, 2002).
Figure 1.1. Map of the Boston Harbor Islands National Park Area
Notes. The Boston Harbor Islands National Park Area includes the areas in white. The island names with black lettering are open conditionally or unconditionally to the public. The island names with grey lettering are not open to the public. The island names with white lettering will be open to the public in 2004. Adapted from http://www.bostonharborislands.com.
At present, 34 islands and peninsulas (formerly islands) are part of BOHA (Figure 1.1). The islands include 1,600 acres at high tide and 3,100 acres at low tide with over 35 miles of undeveloped coastline. They extend 11 miles eastward of downtown Boston. The sizes of the islands range from less than 1 acre to greater than 274 acres (BOHA, 2003b). These islands are unlike most NPS units because BOHA is managed by a unique partnership of 13 members consisting of the National Park Service, state agencies, municipal agencies,
South Boston
Logan Airport
N
0 1 2 3 4
the islands as a resource of national significance and to make the island system an integral part of the life of the surrounding communities and region, while improving public knowledge and access for education, recreation, and tranquility within an urban area (NPS, 2002).”
RESEARCH OBJECTIVES
The overall goal of this research is to contribute to the process of VERP indicator development in BOHA by examining alternative indicator measurement techniques. Specific objectives are to:
1) Evaluate three common methods of estimating extent of vegetative and bare ground cover.
2) Evaluate two portable instruments for measuring soil compaction (penetration resistance).
3) Develop recommendations on selecting monitoring methods in VERP implementation.
THE STRUCTURE OF THESIS
CHAPTER II: GROUND COVER
Estimating Vegetative and Bare Ground Cover as
Visitor Impact Indicators:
An Evaluation of Three Methods
ABSTRACT
INTRODUCTION
Changes in the amount and composition of ground cover are a common type of resource impact resulting from visitor use in parks and recreation areas. Park visitors who stand, walk, run, bike, horseback ride, or drive vehicles on or off trails and recreation sites can impact ground cover. Managers expect and plan for some of these impacts within use areas as an inevitable outcome of visitor use. However, they are more concerned when ground cover impacts are caused when visitors go off the trails or recreation areas to take pictures, to take shortcuts, or for any other reason. To minimize ground cover impacts managers often encourage or require visitors to stay on resistant or hardened trails and recreation sites through design, regulations and education (Hammitt & Cole, 1998).
A change in ground cover on recreation sites typically shows a trend of decreasing vegetative ground cover and increasing bare soil exposure (Liddle, 1997). Socially, reduced vegetation coverage may degrade aesthetic quality and visitor experiences. Ecologically, reduced vegetation ground cover and increased bare ground would likely accelerate erosion by water and wind. Accordingly ground cover estimates using a variety of field measures are commonly used as indicators in visitor impact research and monitoring.
METHODS FOR MEASURING GROUND COVER
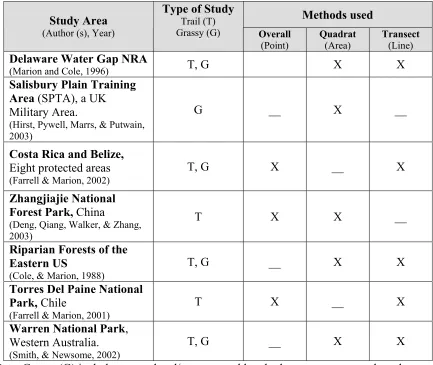
Various methods have been developed to estimate ground cover. Point (overall), line (transect), and area (quadrat) assessment methods are three major methodological approaches in previous recreation impact studies (Hammitt & Cole, 1998). The study areas for this project were primarily low herbaceous (grassy) picnic areas where the quadrat method has commonly been applied (Mueller-Dombois & Ellenberg, 1974). On the other hand, it is common to find the transect method used in desert environments and the point method used on trails (De Soyza, Whitford, & Herrick, 1997; Deng, Qiang, Walker, & Zhang, 2003). A combination of methods is often found in recreation impact studies (Table 2.1). For this study, the quadrat assessment approach will serve as the reference method against which the overall and transect methods are compared. The following is a concise review of each method.
method is statistically weaker due to the limited number of data taken. A visitor impact study in China used a point method to quickly describe a number of spots along a trail. At some of these points they used a transect to determine a more detailed and accurate estimate of the ground cover (Deng, Qiang, Walker, & Zhang, 2003).
Table 2.1. Assessment Methods used in Some Previous Recreation Studies.
Methods used Study Area
(Author (s), Year)
Type of Study
Trail (T)
Grassy (G) Overall
(Point)
Quadrat
(Area)
Transect
(Line)
Delaware Water Gap NRA
(Marion and Cole, 1996) T, G X X
Salisbury Plain Training Area (SPTA), a UK Military Area.
(Hirst, Pywell, Marrs, & Putwain, 2003)
G __ X __
Costa Rica and Belize, Eight protected areas
(Farrell & Marion, 2002)
T, G X __ X
Zhangjiajie National Forest Park, China
(Deng, Qiang, Walker, & Zhang, 2003)
T X X __
Riparian Forests of the Eastern US
(Cole, & Marion, 1988)
T, G __ X X
Torres Del Paine National Park, Chile
(Farrell & Marion, 2001)
T X __ X
Warren National Park, Western Australia.
(Smith, & Newsome, 2002)
T, G __ X X
precision, and logistical considerations. Field testing of quadrat samples is the most accurate way to find the optimal size and shape quadrats. Of the various sizes and shapes, a long, rectangular quadrat provides statistical precision, and smaller more uniform shapes tend to increase the accuracy in the observer’s perspective (Elzinga, Salzer, & Willoughby, 1998). Larger quadrats are required for measuring tree and shrub stands, while smaller quadrats are often sufficient for measuring grasses and herbaceous ground cover. Either way, quadrats are a way to provide data suitable for statistical testing. Using quadrats is a popular cover estimation technique because of the ease and speed at which data can be collected (Elzinga, Salzer, & Willoughby, 1998). In a campsite study at the Eagle Cap Wilderness in Oregon, USA, 15 quadrats each 1m by 1m were used to evaluate ground cover percentages (Cole, 1982).
perspective, there are many factors that introduce subjectivity in field decisions. One of these factors has to do with the season the study is being conducted. In winter the deciduous trees lose their leaves, which may cause a logistical problem. It has to be pre-determined which trees to measure depending if any part of the tree has to actually touch the transect or be within the aerial area of the tree. It is harder to determine the aerial area of the tree without leaves. Another factor is determining the coverage area of the vegetation type, or a lack thereof, to know when to mark a change (Elzinga, Slazer, & Willoughby, 1998). The coverage area is easy to determine for a Christmas tree or piece of trash since they are normally dense and contained. On the contrary, the coverage area for a Palo Verde tree (Cercidium floridum or Cercidium microphyllum) with slim branches going in all directions, like grasses, is hard to determine. A third factor in deciding to use a transect is whether or not to have an observation zone around the tape measure. An observation zone gives a better chance of including more vegetation types (Mueller-Dombois, & Ellenberg, 1974). In a visitor impact study, Farrell and Marion (2002) used the transect methods to determine the percent of ground cover types on trails and recreational areas within eight protected areas of Belize and Costa Rica..
METHODOLOGY
Study Area
2003a). BOHA is managed by a 13-member partnership that includes the National Park Service, federal, state and municipal agencies, and island owners.
Three islands were initially selected for this study based on their environmental characteristics and accessibility. Of the 34 islands only five were open and accessible by public ferries (Georges, Peddocks, Grape, Bumpkin, and Lovells Islands). Georges Island was chosen because it has the highest volume of visitors with the greatest amount of visitor impact. Two of the islands had very similar soil type and visitor use levels (Bumpkin and Grape). We chose to collect data on Grape Island for efficiency reasons. Peddocks Island was also selected but field data collection was incomplete due to weather and logistical constraints. This paper therefore reports results from Georges and Grape Islands only. Georges Island is a heavily used island with Fort Warren taking up a majority of the island. There are many grassy trails and recreation areas. There are a few unmowed bushy areas with some scattering of trees. Grape Island possesses a more vegetative setting with lots of trees and bushes. All the trails, campsites, and picnic areas are grassy.
Field Procedures
BOHA is open from May to October and is closed during the winter months. We collected data at the beginning (June), middle (August), and end (October) of the visitor use season to evaluate a seasonal trend in ground cover. Unfortunately, during the summer of 2002, Boston was experiencing drought conditions, which may have affected our August results.
10 and 15 minutes to set up the plot. It would take between 15 and 40 minutes to record ground cover over the transect, depending on the amount of cover changes. During this time the overall method (one minute) and quadrat method (15 minute) estimates can be recorded. Between the working hours of ten o’clock in the morning to five o’clock in the evening, there was a total of approximately 5 hours a day to perform data collections on Georges Island and 4 hours on Grape Island. These limited hours were due to corresponding ferry schedules.
Each site provides a number of ground cover data. There are twelve quadrats that provide a total of twelve ground cover quadrat observations. There is one observation from the overall ground cover assessment method. For the transect method, the number of observations depends on the number of changes in vegetation. There was a range of 17 to 59 changes in vegetation per site.
The visitor use levels (high use and low use) were based on each individual island. For example, a high use area on Grape Island would not be comparable to a high use area on Georges Island. There were a total of 83,829 visitors to Georges Island during the 2002 season while there were only 4,905visitors to Grape Island (BOHA, 2003a). Georges Island, as a whole, is well used, but there were a few areas of very concentrated visitor use. Many people including school and organization groups use the four large picnic areas around the island. We chose two of these high use areas to be our high use sampling plots. We chose one close to the pier, which is almost always occupied. The other large picnic area we chose is on the southwest part of the island (approximately a 1/4-mile from the pier) and includes a large area where children run around and play games.
The selection of low use sites was more difficult than the high use sites. On Georges Island few places are not walked or played on. On the backside of the island, there were a few areas on some trails that did not seem to be used as much as on the pier side of the island. We chose two of these areas on the trails for our study sites: one that is right next to the Fort and another closer to the coastline. From two summers of observations we found that these areas received lower use compared to the two high use areas.
Sampling Plot Design
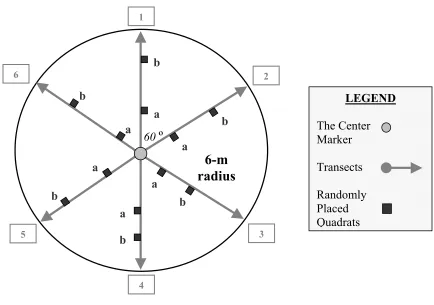
At each study site a circular sampling plot was laid out (Figure 2.1). A circular plot design was adopted, as most of the sites being studied are oddly shaped or small. From the center, our transects went out as far as six meters or until the mowed recreation area ended. This method seemed to be less time consuming than laying out square plots. With square plots we would have had to trudge through brush to find beginning and ending points for the transects. Another advantage of the circular plot is all of the transects start at one point and the end points are all the same distance. The first transect is found randomly. This center of the circular plot is found randomly by throwing any object into the pre-determined study area. A metal nut was buried into the ground at that point so that we could be certain that we relocated the exact site location for the mid and end of season data collection.
Figure 2.1. The Sampling Plot Design.
Two quadrats, made out of plastic piping forming a 25cm by 25cm square, were randomly placed along each of the transects. The location of the quadrats along the transects was calculated using the random operation on the calculator (.nnn) then multiplying that decimal by 6. For example, the random number 0.847 is multiplied by 6 giving a result of 5.082. This number is rounded to 5.1 meters. Since random numbers can range from .000 to .999 when multiplied by 6 it gives the range of 0.0 meters to 6 meters (when rounded). Using this method, quadrats had equal chance of being located along any part of all the transects.
1 5 4 3 2 6
6-m
radius
60º
On the data collection forms, to be consistent, the quadrat closer to the center point is listed before the farther away quadrat.
Ground Cover Methods Selected
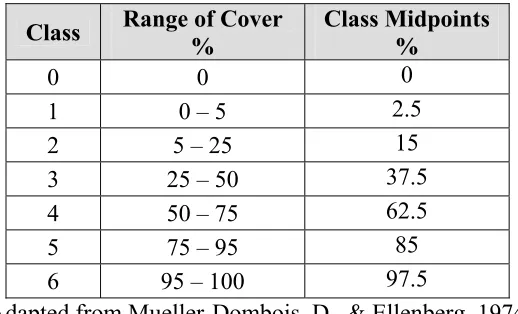
Table 2.2. Ground Cover Assessment Scale
Class Range of Cover % Class Midpoints %
0 0 0
1 0 – 5 2.5
2 5 – 25 15
3 25 – 50 37.5
4 50 – 75 62.5
5 75 – 95 85
6 95 – 100 97.5
Adapted from Mueller-Dombois, D., & Ellenberg, 1974.
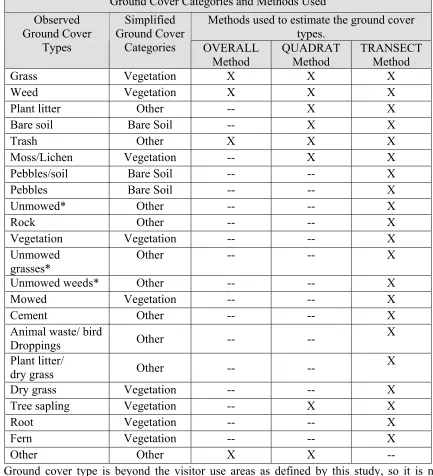
Table 2.3.Ground Cover Data: Analysis of Data from the Field.
Ground Cover Categories and Methods Used
Methods used to estimate the ground cover types. Observed Ground Cover Types Simplified Ground Cover
Categories OVERALL Method
QUADRAT Method
TRANSECT Method
Grass Vegetation X X X
Weed Vegetation X X X
Plant litter Other -- X X
Bare soil Bare Soil -- X X
Trash Other X X X
Moss/Lichen Vegetation -- X X
Pebbles/soil Bare Soil -- -- X
Pebbles Bare Soil -- -- X
Unmowed* Other -- -- X
Rock Other -- -- X
Vegetation Vegetation -- -- X
Unmowed grasses*
Other -- -- X
Unmowed weeds* Other -- -- X
Mowed Vegetation -- -- X
Cement Other -- -- X
Animal waste/ bird
Droppings Other -- -- X
Plant litter/
dry grass Other -- --
X
Dry grass Vegetation -- -- X
Tree sapling Vegetation -- X X
Root Vegetation -- -- X
Fern Vegetation -- -- X
Other Other X X --
The continuous line transect estimations were performed by observers who started at the center of each sampling plot and walked the length of each 6-m transect. Measurements of ground cover were estimated as the principal type of ground cover along the transect changed, to the closest decimeter (10 cm). There was a 10-cm observation zone along each transect so that a principal ground cover type could be determine more accurately. A beginning and end distance was recorded for each change in principal ground cover type. The amount of values to estimate ground cover depended on the amount of ground cover changes. There would be a minimum of six values for each site if all the transects reported one ground cover type. For example, if the area was principally grass, a transect may have just one value, 6 meters for grass.
Analysis
RESULTS
Georges Island
Table 2.4 highlights the means, standard deviations, and the coefficient of variations for the ground cover estimates for the overall method on Georges Island. Due to the small sample size the overall results cannot be directly compared to the transect and quadrat results through significance tests. As expected, the low use sites have a higher amount of vegetation cover (95%) than the high use sites (77%). The high use sites have a greater percent (15.1%) of bare soil than low use sites (less than 1%). Measuring vegetative ground cover has a CV range of 0.07 to 0.25, which is lower than that of bare ground cover range of 0.93 to 2.60.
Table 2.4. Overall Ground Cover Estimation Results: Georges Island (All months combined)
Overall Ground Cover Estimates
Groundcover
Type/
Use Level
N Mean (%)Standard Deviation (%)
Coefficient of Variation (%)
Vegetative Ground Cover
High Use 12 76.6 19.5 0.25
Low Use 12 95.1 7.1 0.07
Difference between High and Low Use
(Mann-Whitney U Significance)
0.065
Combined
Use 24 85.9 17.0 0.20
Bare Ground (Exposed Soil)
High Use 12 15.1 14.1 0.93
Low Use 12 0.5 1.3 2.60
Difference between High and Low Use
(Mann-Whitney U Significance)
0.015*
Combined
Use 24 7.8 12.2 1.6
* Significant: p < 0.05. ** Significant: p < 0.01.
month. No other months were found to have statistically significant differences between the two methods on the low use or high use sites. The difference that was found to be statistically significant in August may have been the result of plant litter on the ground because the area had been recently mowed.
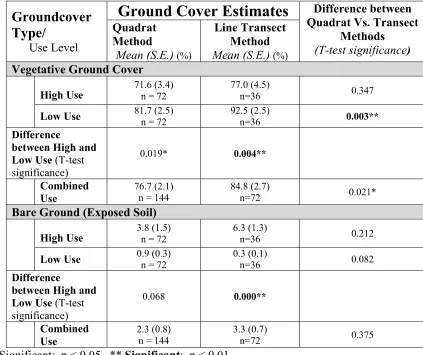
Table 2.5.Georges Island Ground Cover Estimates: Comparison of the Quadrat and Transect Methods (All months combined)
Ground Cover Estimates
Groundcover
Type/
Use Level
Quadrat Method
Mean (S.E.) (%)
Line Transect Method Mean (S.E.) (%)
Difference between Quadrat Vs. Transect
Methods (T-test significance) Vegetative Ground Cover
High Use 71.6 (3.4) n = 72
77.0 (4.5)
n=36 0.347
Low Use 81.7 (2.5) n = 72 92.5 (2.5) n=36 0.003**
Difference
between High and
Low Use (T-test
significance)
0.019* 0.004**
Combined
Use 76.7 (2.1) n = 144 84.8 (2.7) n=72 0.021*
Bare Ground (Exposed Soil)
High Use 3.8 (1.5) n = 72 6.3 (1.3) n=36 0.212
Low Use 0.9 (0.3) n = 72 0.3 (0.1) n=36 0.082
Difference
between High and
Low Use (T-test
significance)
0.068 0.000**
Combined Use
2.3 (0.8)
n = 144 3.3 (0.7) n=72 0.375
Both the quadrat and transect methods can be used to evaluate bare soil ground cover (Table 2.5). No months or use levels that were found to have a statistically significant difference. For all months combined, a range of significant values of 0.08 to 0.37 occurred.
When the quadrat and the transect methods are compared, all but one transect mean were higher than that of the quadrat method. In the case of low use levels on bare ground, the transect estimates were slightly lower than that of the quadrat method.
Table 2.5 included the statistically significant difference values for the comparison between high use and low use sites for each method. The quadrat method has a statistically significant difference for vegetation ground cover between high and low use sites, but not a statistically significant difference for bare soil ground cover. The transect method has a highly statistically significant difference for both vegetation and bare soil ground cover types between high and low use sites.
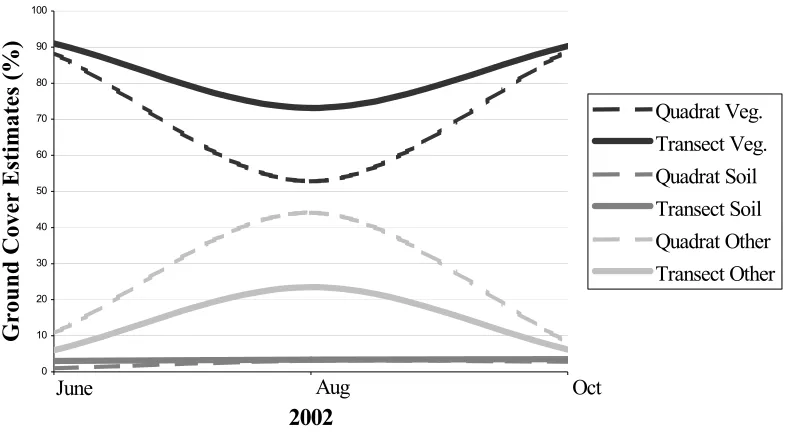
Figure 2.2 shows the seasonal trend on Georges Island by comparing transect and quadrat
methods over the three months with combined use averages. Soil stays relatively low and linear.
Soil seems to be independent of vegetation and ‘other’ estimates. Vegetation appears to have an
inverse relationship with the ‘other’ cover category. As one goes up, the other goes down
relatively proportionally. The overall trend though shows that the beginning and end of the
season values are relatively similar. This indicates that there is minimal damage caused by
Oct June Aug 0 10 20 30 40 50 60 70 80 90 100
1 2 3
2002
Ground Cover Estimates (%)
Quadrat Veg. Transect Veg. Quadrat Soil Transect Soil Quadrat Other Transect Other
Figure 2.2. Georges Island: Comparison of Two Ground Cover Estimation Methods over Time (high and low use sites combined).
Grape Island
Table 2.6. Overall Ground Cover Estimation Results: Grape Island (All months combined)
Overall Ground Cover Estimates
Groundcover
Type/
Use Level
n Mean (%)Standard Deviation (%)
Coefficient of Variation (%)
Vegetative Ground Cover
High Use 10 91.8 10.3 0.11
Low Use 10 98.9 1.5 0.02
Difference between High and Low Use
(Mann-Whitney U Significance)
0.222
Combined
Use 20 95.4 7.9 0.83
Bare Ground (Exposed Soil)
High Use 10 6.5 9.6 1.48
Low Use 10 0.6 1.4 2.33
Difference between High and Low Use
(Mann-Whitney U Significance)
0.548
Combined
Use 20 3.55 7.2 2.03
* Significant: p < 0.05. ** Significant: p < 0.01.
use data, because no other vegetation data indicates a statistically significant difference between methods. The statistically significant difference that was found in August may have been the result of the difficulty determining between dry grass and plant litter as the drought had made much of the grass yellow.
Table 2.7.Grape Island Ground Cover Estimates Comparison of the Quadrat and Transect Methods (All months combined)
Ground Cover
Estimates
Groundcover
Type/
Use Level
Quadrat MethodMean (S.E.) (%)Line Transect Method Mean (S.E.) (%)
Difference between Quadrat Vs. Transect
Methods (T-test significance) Vegetative Ground Cover
High Use 76.0 (3.2) n = 60 88.2 (2.3) n=30 0.003**
Low Use 93.9 (1.3)
n = 60
81.4 (3.9)
n=29 0.005**
Difference between High
and Low Use
(T-test significance)
0.000** 0.143
Combined Use
84.9 (1.9) n = 120
84.8 (2.3)
n=59 0.969
Bare Ground (Exposed Soil)
High Use 6.7 (1.9) n = 60 4.9 (1.3) n=30 0.443
Low Use 0.1 (0.1) n = 60 0.7 (0.4) n=29 0.160
Difference between High
and Low Use
(T-test significance)
0.001** 0.005**
Combined Use
3.4 (1.0) n = 120
2.9 (0.7)
n=59 0.655
Both the quadrat and transect methods can be used to evaluate bare soil ground cover (Table 2.7). No months or use levels were found to have a statistically significant difference. For all months combined, there was a range of significance values of 0.16 to 0.66 occurred.
There was no distinct pattern found when comparing the quadrat method to the transect method. Three is not enough evidence to support the conclusion that either the quadrat or transect has higher average means. There were two transect means that were higher than the quadrat means. There was one comparison that was about the same. There were three transect means lower than the quadrat means.
Table 2.7 included the significance values for the comparison between high use and low use sites for each method. The quadrat method has a very statistically significant difference for both vegetation and bare soil ground cover types between high and low use sites. The transect method has a statistically significant difference for bare soil ground cover between high and low use sites, but not a statistically significant difference for vegetation ground cover.
Aug Oct June
0 10 20 30 40 50 60 70 80 90 100
1 2 3
2002
Ground Cover Estimates (%)
Quadrat Veg. Transect Veg. Quadrat Soil Transect Soil Quadrat Other Transect Other
Figure 2.3. Grape Island: Comparison of Three Ground Cover Estimation Methods Over Time (high and low use sites combined).
DISCUSSION AND IMPLICATIONS
These findings may have implications for research and monitoring. For example, the selection of a field monitoring method may be more important for ground vegetation cover than for bare soil cover. A combination of assessment methods, such as quadrats and transects, should be used along with control data in park or recreation areas that have a great emphasis on conservation, restoration, enhancement, or preservation of one or more types of vegetation types. This may be the case for areas that are interested in opening a new area to recreation. Control areas as well as pre-recreation data can be used to get a better idea if the area is being over-used.
For open recreation areas where the vegetation cover is being lost and there is the chance of runoff or erosion, depending on soil type, management action should be taken. If the vegetation is trampled to the point of being non-existent, there will be no protection for the topsoil. This would allow further recreation, as well as natural factors, to erode the topsoil. Before the vegetation is trampled to the point of being eliminated, managers can both close the site temporarily or permanently and promote recreation on another site. If all of the vegetation is to the point of being eliminated, managers should close the site permanently. They may have to aide in the speedy recovery of new vegetation by putting down seeds or planting new grass (Hammitt & Cole, 1998).
may be the best method if the management does not need detailed statistics. An overall assessment of a site with a photograph of the area may be all that a manager needs to assess vegetation changes from one year to the next. This may be the case for an area that is well vegetated and shows signs of natural regeneration. Some difference year to year should be accounted, if various volunteers are taking the estimations.
There are some advantages and disadvantages to the quadrat method for estimating ground cover. The advantage of the small and uniform quadrats is that there is no distortion when observing the whole area within the quadrat. It also takes very little time to estimate the ground cover within a quadrat, approximately one minute or less per quadrat. The disadvantage is the possibility that not all cover types are correctly represented. Although it was not tested in this study, using quadrats may not give the most representative data, but using this method an observer can get some satisfaction of obtaining good data. Quadrats seemed to be relatively easy and manageable. Managers could use this method if they need to compare their ground cover estimations to a strict standard. This may be the case if they feel they are getting close to the limits set through the carrying capacity study.
predetermined. The observation sheet was left open to make the most representative data of the ground cover types that actually existed. With this much subjectivity, it was difficult to be confident in the data. With all types of covers recorded, a total of 21 different groundcover categories emerged. This method is recommended to managers who need to do a detailed and professional ground cover inventory. Either ground cover types need to be predetermined, or trained scientists or permanent staff should use the transect method to evaluate ground cover. This may be the case for well-used sites with a mixture of cover types.
LIMITATIONS AND CONCLUSIONS
were only interested in sites that were mowed and had the classification of a picnic area, trail, or both. In a few cases, though, our sampling plots extended outside the mowed area into shrubs and bushes. From the very first incident we classified these areas as ‘unmowed’. With the linear transect method of recording the distances where the changes in ground cover occur, the extent of the unmowed area is known.
Although there are many limitations, this study is very important for the Boston Harbor Islands National Park Area. This study will inform managers on existing conditions on the given islands. This may give them ideas about how to manage for future impacts on the two islands that were analyzed and may prompt interest in doing ground cover evaluations on other islands, especially the one that will be opening to the public this year.
For the National Park Service this is one more park that has been through a carrying capacity study. The NPS officials can refer park managers who will be starting future carrying capacity studies to this study to compare the methods used. There are National Parks in all parts of the country, even in deserts, for which we have found data. Most of our data would be relevant for islands and parks with low herbaceous vegetation, though. Scientific research will benefit because of the ability to compare the results to other related studies. Eventually there could be a new relationship found between groundcover types as well as new standards by which these methods are used or compared.
CHAPTER III: SOIL COMPACTION
Estimating Soil Compaction as
A Visitor Impact Indicator:
An Evaluation of Two Methods
ABSTRACT
INTRODUCTION
One of the most common ecological changes induced by recreational use is soil compaction, a process in which individual soil particles within the soil matrix are forced to rearrange themselves into closer proximity (Liddle, 1997). Some common forces of soil compaction in recreation settings include trampling by foot and vehicular traffic on recreation sites and trails, though soil compaction can also occur from natural causes such as drying and wetting. Soil compaction typically results in reduced amount and size of pore space and total soil volume, which in turn lead to decreased infiltration capacity and increased surface runoff, standing water and erosion (Brady & Weil, 2002). These changes represent site degradation and may have a detrimental effect on vegetation and soil resources. The purpose of this paper is to evaluate soil compaction through two types of penetration resistance methods in the Boston Harbor Islands National Park Area (BOHA). Each method will be evaluated for its functionality and data variability as potential impact indicators for this park’s carrying capacity study. This paper reports results from two penetration resistance instruments, namely the pocket penetrometer and the cone penetrometer.
MEASURING SOIL COMPACTION
Table 3.1. A Comparison of the Four Different Approaches to Measuring Soil Compaction.
Approach Comparison
Penetrometry Bulk Density Conductivity/
Permeability Radiation Definition* Records the
force necessary to drive a rod of known length into the ground
A direct
measure of soil density
(weight to volume ratio)
A measure of how rapidly water
permeates the soil
A measure of soil density based on penetration of gamma rays or neutrons Types of
Instruments
Pocket or cone penetrometer Soil sampler, oven, balance Metal ring, cylinder Surface nuclear gauges (SNG) Depth of Measure 0-6.4 mm (pocket) or 0-27 inches (cone)
3-10 cm (typical)
Near surface Measures moisture 15 cm (2-6 inches) from the instrument Work Setting Field oriented Field and lab
oriented Field oriented Field oriented
Advantages Easy to operate; gives immediate readings; relatively economical Standardized method; consistent results Easy to operate
Can use in stony soils; gives immediate readings
Disadvantages Does not work in stony soils; varies with moisture content
Does not work in stony soils; disturbance to the soil by digging; soil samples needs to be evaluated in a laboratory
Field time and distilled water needed in the field; disturbs vegetation
Expensive; nuclear radiation; need a license to operate; influence of organic
material
* Based on Hammitt and Cole (1998) and Randrup and Lichter (2001).
instruments used in this approach. A pocket penetrometer is a small handheld instrument that just takes surface data. The U.S. Forest Service has determined that the pocket penetrometer should be included in their phase three inventory procedures because it quantifies the soil quality indicator (Amacher & O’Neill, 2004). A basic cone penetrometer is operated manually by pushing long rod into the ground while observing a gauge at predetermined increments. Some cone penetrometers have the technology to automatically record data at the predetermined depth increments. The greatest advantage in using a penetrometer is that it is easy to use and does not disturb the soil like bulk density does (Chacalo, 2000). The greatest disadvantage is that soil moisture is needed to get very accurate results. In a recent study by Hurst, Pywell, Marrs, and Putwain (2003) the penetration resistance of grasslands to military vehicles was measured by a manual penetrometer. Both a 4-ton truck and a 1-ton land rovers caused statistically significant soil compaction, even after only one pass.
Like penetrometry, bulk density is also a very common approach in recreation ecology studies (Liddle, 1997). Bulk density is determined by the weight of oven-dried solid per unit volume. This approach requires collection of soil samples and oven-drying in a laboratory (Lowery & Morrison, 2002). The greatest advantage with bulk density is the ability to attain consistent and repeatable data. The greatest disadvantage is that soil is disturbed through both digging and the need to take soil samples to a laboratory.
compared both penetration resistance and bulk density between high and low use campsites. Based on the absolute differences, the penetration resistance had a relative change of 52.6% and bulk density had a relative change of 3.8%. In a Hawaiian trail study by Sutherland, Bussen, Plondke, Evans, and Ziegler (2000) the relative change for penetration resistance was 118.2% and only 29.3 for bulk density between on trail and off trail sites. Finally, Smith and Newsome (2002) also recently conducted a campsite study in Australia that found that the relative change between the designated area and control area means for penetration resistance and bulk density were 550% and 80.5%, respectively.
Conductivity/permeability evaluates the rate at which water or air permeates through soil. A common technique in this category is infiltration capacity, which requires the availability of field time and distilled water. This process is performed by carrying out five steps: firm the soil, line the ring with plastic wrap, add water, remove wrap and record the time, then finally repeating these steps a second time for dry soil. Cole and Fischtler (1983) did a study in three different locations and using both penetration resistance and infiltration found similar results. Thy both concluded that the less use a site gets the more significant the penetration resistance and infiltration rates will be.
between bulk density and the SNG ranged from –2.4% to 18.66%. There were no visitor impact studies that used the radiation method approach.
METHODOLOGY
Study Area
BOHA consists of 34 islands and peninsulas in Boston Harbor with 650 hectares in total size. Due to proximity to population centers this new park receives ever-increasing visitation, with 262,000 recreational visits recorded in 2002 (BOHA, 2003a). BOHA is managed by a 13-member partnership that includes the National Park Service, federal, state and municipal agencies, and island owners.
Georges Island is a heavily-used island with Udorthents (Ud) loamy soil as the dominant soil type. The Ud soil is predominately fine sandy loam good for recreation fields and parks. A slow runoff rate is the main concern for managers, because puddles will form after intense rains. There is a moderate to slow permeability rate to a depth of 3.05 meters for this soil type. Also, there is a low or moderate water capacity available (USDA, 1989).
Grape Island possesses a more natural setting with less visitor use. Newport silt loam (NpC) and Pittstown silt loam (PtB) soils dominate Grape Island. They are reported herein as a combined soil type (NpC/PtB). These soil types have the same soil properties; the only difference is in slope. Between the two soil types a slope of 2 to 15 percent is covered. The NpC/PtB soil is predominately silt loam good for parks and playgrounds. Erosion is the main concern for managers, so vegetation cover is very important. There is moderate soil permeability in the surface and subsoil layers. The available water capacity is moderate. Finally, the distance to the seasonal high water table is only 0.45 to .76 meter (USDA, 1989).
Field Procedures
cm level are compared with PP readings. Due to rocks, roots, and compaction not all SCT measurements could be taken at their intended depths, resulting in reduced number of SCT readings in some cases. Eight background PR measurements were taken with two penetrometers, respectively, at adjacent environmentally similar control areas outside each plot. All measurements of a single plot were completed on the same day.
The same plots and quadrats were relocated and remeasured in August and October 2002 to evaluate temporal changes. The August data were collected during a severe drought, resulting in extremely high PR readings under unusual soil moisture regimes. For comparability purposes only data in June and October 2002 representing the beginning and end of a visitor use season are presented.
It could take approximately 30 minutes for three people to complete one sampling plot when collecting only soil compaction data. This could be less if the same three people always did the data collection. Two people could take 10 to 15 minutes to set up the plot, while during this time the third person is collecting the control data. It would then take between 10 and 20 minutes for two people to collect the SCT data, while the third person is collecting the PP data. Between the working hours of 10AM to 5PM, there was a total of approximately 5 hours a day to perform data collections on Georges Island and 4 hours on Grape Island. These limited hours were due to corresponding ferry schedules.
Sampling Plot Design
recreation area ended. In our opinion, this method was less time consuming than square plots. With square plots we would have had to trudge through brush to find beginning and ending points for the transects. Another advantage of the circular plot is all of the transects start at one point and the end points are all the same distance. It is easy to randomly chose the direction of the transect. This center of the circular plot is found randomly by throwing an object into the pre-determined study area. A nut was buried into the ground at that point so that we could be certain that we relocated the exact site location for the mid and end of season data collection.
Once the center was determined, the transects were then measured out six meters. A stake at the center point stabilized the tape measure. After the first transect is randomly determined, five more transects are radially placed 60º apart, clockwise around the plot. Two 25cm by 25cm square quadrats were then placed randomly along each of the transects. On the data collection forms, to be consistent, the quadrat closer to the center point is listed before the quadrat farther away.
Penetrometers Selected
value in kg/cm2. The Soil Compaction Tester (DICKEY-john Co.) is a portable cone penetrometer of 93 cm in total length with a dial on top to immediately read the soil compaction value (pounds per in2). An angled cone attachment of 12.7 mm (½ in) or 19.1 mm (¾ in) is screwed onto the other end of the 70-cm rod that is pushed into the ground. The rod is marked every 7.6 cm (3 in) to enable measurement of soil compaction at 7.6 cm increments (up to 45.7 cm or18 in).
Analysis
The data were entered into and analyzed in SPSS for Windows. Data in its original form were split, sorted, or aggregated to get into the formats needed for doing the descriptive statistics and the relative change. For each island the soil compaction data was analyzed for June, October, and for each penetrometer. The tables in this study were created in Excel 2000.
RESULTS
Each island was evaluated separately due to the differences in the use and soil type. There were two patterns, though, that seemed consistent for both island and both months. First, there was a pattern in the Ud soil type where high use sites exhibited less variability in the pattern than in the low use sites. This was the opposite for the NpC/PtB soil type where it was found that the low use sites are less variable. Secondly, PP measurement showed a higher degree of measurement variability than the SCT measurements.
Georges Island
On Georges Island (Ud soil), high use plots started with higher PR values in June. The mean PP-PR was 3.0 kg/cm2 for high use plots and 2.1 kg/cm2 for low use plots (Table 3.2). The relative PR change based on PP was 54.3% for high use plots and 53.0% for low use plots (Table 3.3). On the other hand, the mean SCT-PR was 31.6 kg/cm2 for high use plots and 18.8 kg/cm2 for low use plots. The relative PR change based on SCT readings was 66.4% for the high use area and –0.05% for low use area, indicating essentially the same PR level between use and control sites in the latter case (Table 3.3).
Table 3.2. Penetration Resistance Measurements on Georges Island (Ud Soil) Using Two Types of Penetrometers.
June 2002 October 2002
Penetrometer
/ Use Level
Mean (kg/cm2)Std. Dev. (kg/cm2)
Coeff. of Var. (%)
N (kg/cmMean 2)
Std. Dev. (kg/cm2)
Coeff. of Var.
(%)
N
Pocket Penetrometer (PP)
High Use 3.0 0.8 25.8 96 2.3 0.9 37.9 96
Low Use 2.1 0.8 37.1 96 1.5 0.8 51.7 96
Difference between High
and Low Use
(T-test significance)
0.00*** 0.00***
Soil Compaction Tester (SCT) @ 7.6 cm
High Use 31.6 7.3 23.1 80* 23.7 6.2 26.0 47*
Low Use 18.8 5.2 27.8 92* 24.5 7.2 29.5 60*
Difference between High
and Low Use
(T-test significance)
0.00*** 0.53
* Some readings were unable to be obtained due to failure of the equipment to penetrate to the required depth. *** Significant: p < 0.01.
penetration depth of 7.6 cm was reached more on the low use sites than the high use sites, but in both cases many values are missing.
Table 3.3. Relative Changes in Penetration Resistance on George Island (Ud Soil).
Penetrometer/
Use Level
June 2002 October 2002Pocket Penetrometer (PP)
High Use 54.3* 35.4
Low Use 53.0 60.9
Soil Compaction Tester (SCT) @ 7.6 cm
High Use 66.4 21.3
Low Use -0.1 25.9
* All values in percent.
Grape Island
PR values as measured by both penetrometers were lower on Grape Island (NpC/PtB soil). For example, the mean PP-PR was 2.0 kg/cm2 for high use plots and 1.5 kg/cm2 for low use plots. According to the relative PR difference, use sites actually had more substantial compaction change as compared to their off-site controls. For example, relative PR changes for PP were 85.9% and 143.5% for high and low use plots respectively, while those for SCT were 111.7% and 53.5% (Table 3.5).
Table 3.4. Penetration Resistance Measures on Grape Island (NpC/PtB Soil) Using Two Types of Penetrometers.
June 2002 October 2002*
Penetrometer
/ Use Level
Mean(kg/cm2)
Std. Dev. (kg/cm2)
Coeff. of Var.
(%)
n (kg/cmMean 2)
Std. Dev.
(kg/cm2)
Coeff. of Var.
(%)
n
Pocket Penetrometer (PP)
High Use 2.0 0.9 42.1 96 2.4 0.8 35.9 46**
Low Use 1.5 0.6 37.2 96 1.8 0.4 22.2 48
Difference between High
and Low Use
(T-test significance)
0.00*** 0.00***
Soil Compaction Tester (SCT) @ 7.6 cm
High Use 16.6 5.9 35.2 96 22.5 4.6 20.6 38**
Low Use 10.4 3.2 31.2 96 12.9 2.3 17.5 47** Difference
between High
and Low Use
(T-test significance)
0.00*** 0.00***
* Only one plot was measured for each use level in October due to logistical constraints. **Some readings were unable to obtain due to failure of the equipment to penetrate to the required depth. *** Statistical significance: P < 0.01
Table 3.5. Relative Changes in Penetration Resistance on Grape Island (NpC/PtB Soil).
Penetrometer/ Use
Level June 2002 October 2002
Pocket Penetrometer (PP)
High Use 85.9* 34.8
Low Use 143.5 42.7
Soil Compaction Tester (SCT) @ 7.6 cm
High Use 111.7 37.8
Low Use 53.5 25.7
* All values in percent.
Penetration Depths
These measurements were applicable to only SCT. The results suggest that soil was generally less penetrable on high use sites and on Georges Island (Ud), on which most of the SCT measurements were not able to reach the depth of 15.6 cm. At the 7.6 cm level there was a decreasing trend in penetration depth from the beginning of use season (83.3-95.8%) to the end of season (68.8-79.2%). Soil was more penetrable on Grape Island (NpC/PtB soil). Twenty-four percent to 46% of SCT measurements reached the penetration depth of 15.6 cm. The soil was less penetrable at the 7.6cm level in October, with the percent penetrated decreased from 100% to 85% on the high use site.
DISCUSSION AND IMPLICATIONS
penetrometer holds the PR reading until it is reset. PP measurements also create less ground disturbance. The PP is more efficient than the SCT in three ways: time, people needed, and size (portability). The SCT is more expensive (≈$250), is harder to carry, and requires 2 people to operate it effectively. One person must be dedicated to taking the dial reading as it changes constantly. Another person must keep track of rod markings to ensure that reading is taken at each desirable penetration depth. As a result, the inter-rater variability could be higher. This aspect of measurement error, however, was not assessed in this study. Furthermore, the two sizes of cone tip and corresponding scales on the dial gauge could create confusion.
On the other hand, the PP readings contain a higher degree of variability in its measurements based on coefficient of variation as shown in the results. This may be due to the short penetration depth of this equipment. Irregularities of soil surface, such as rocks, stones, plant litter, and tree or grass roots, are more likely to interfere with the PP readings. Since SCT measures compaction at a deeper level, it is less influenced by surface conditions. The SCT is also capable of measuring compaction at various depths.
Park managers and scientists have three considerations in choosing an instrument to be used their studies. First, they have to decide if this is just a one time study or a long-term study involving monitoring. In a one time study, it is easier to have consistency in the way the data are collected. Planning for inter-user validity is needed if different people, especially volunteers, will be collecting data over time, in the case of a long-term study or monitoring program. Secondly, the use of volunteers, staff, or scientists to do the data collection needs to be determined. Volunteers of varied backgrounds may introduce inconsistency in measurements. Therefore adequate training is often needed. Paid scientists will probably be more consistent in applying the procedures but they are more costly. Thirdly, current site conditions and characteristics are very important. Soil types and characteristics do play a part in choosing instrumentation. Once these three issues are contemplated, only then can the pros and cons of each penetrometer used in this study can be examined. Through this study, it should be realistic to assume that a park manager can choose a soil compaction instrument that would suit the needs of their park or recreation area
may have contributed to this variation. Thirdly, the high use plots on Georges Island (Ud soil) showed less data variability for both penetrometers, whereas less data variability were found on the low use areas on Grape Island (NpC/PtB soil). In other words, data variability of PR readings appeared to increase with amount of use at low use areas, while such data variability decreases with the amount of use at high-use areas. A possible explanation is that soil strength could become more uniform in already compacted soil. Finally, the relative PR changes were found to decrease in most cases from June to October, indicating the closing gap of PR between use and control areas. Both decreasing on-site PR values and/or increasing control PR values may have caused this effect.
with the quadrat setup as explained in this paper would be sufficient to record and evaluate soil compaction.
There are some options for managers if they have a site with a soil compaction problem. Some of these options have to do with implementing changes to the resources and some to the visitors. First, the site can be restricted to more resistant areas by zoning (Hammitt & Cole, 1998; VERP, 1997). This would mean that the current area would be zoned for limited or no use and other areas that can better withstand visitor use will be promotes. Second, areas may have to be created so that when one area is limited there are others to meet visitor demand (VERP, 1997). Third, the durability of the site can be increased by maintaining or rehabilitating the resource (Hammitt & Cole, 1998; VERP, 1997). Trails and campsites can be maintained or rehabilitated through surfacing, water bars, steps, bridges, outsloping, and drainage dips. Outsloping and drainage dips are the least costly and very helpful to reduce erosion. They can also be artificially restored through means such as aeration. Aeration is the breaking up of the compacted soil to help to increase seed germination and root growth (Hammitt & Cole, 1998). Finally, elements of the visitor experience can be altered. These elements include attitudes, expectations, and behavior (VERP, 1997).
only one person is monitoring the soil compaction conditions. The cone penetrometer can be used if more than one person is monitoring the soil compaction conditions. One advantage of the cone penetrometer is that the depth of the soil can be estimated. To establish and maintain a general record, measurements by either instrument can be used as long as they are taken consistently. Various locations around the islands should be measured and recorded with reference points so that they can be re-evaluated every year. This is so that trends can be identified. In recreation areas that already have bare soil patches, a pocket penetrometer used with the quadrat setup as explained in this paper would be sufficient to record and evaluate soil compaction.
LIMITATIONS AND CONCLUSIONS
There are a number of limitations in this study. Only two islands and two penetrometer types were involved. Bulk density and soil moisture were unavailable to provide more comprehensive comparison. The control areas are not entirely free of human influence and may be subject to limited foot traffic. The full limitations of each instrument are important in comparing data from one study to another (Chacalo, 2000).
There are only a few studies that compare soil compaction methods, especially for penetration resistance, and there is none that compared penetrometers in parks and recreation areas. As indicated there are studies that may use two different types of approaches, such as penetration resistance and bulk density. This study compared two measures of the same approach, penetration resistance, for consideration in a monitoring program. As there is an increase in the desire and need to conduct carrying capacity studies in the United States and other countries, studies such as this one will inform other researchers of the utility and variety of different measurement tools so that they can make an informed choice of equipment in future studies.
CHAPTER IV: GENERAL CONCLUSIONS
The purpose of this thesis was to contribute to the process of VERP implementation at the Boston Harbor Islands National Park Area (BOHA) by examining two potential resource indicators, ground cover and soil compaction, through alternative measurement techniques. Soil degradation, or the loss of utility of soil to serve its functions, is one of the main management concerns about BOHA as the soil layer is very thin. Both ground cover and soil compaction are measures indicative of potential soil degradation. Vegetative and bare ground cover was evaluated by three alternative techniques: overall observation, quadrats and line transects. On the other hand, soil compaction was assessed using two portable penetration resistance instruments: a pocket penetrometer and a cone penetrometer.
will prevent the growth of vegetation. On Grape Island there is a high chance of soil erosion if there is a great amount of vegetation loss. An important finding from the penetration resistance study was that there were many cases on both islands that the cone penetrometer could not be pushed to a depth of 7.6cm. This means that the soil is very compacted or that there are rocks or roots very near the surface. No soil loss can be afforded on either island, since there may not a limited supply.
Just like there are natural erosion processes, there are natural aerating processes. Frost heaves, a natural abiotic process during the winter, can potentially help lessen the soil compaction and allow for more plant growth the next spring (Hirst, Pywell, Marrs, & Putwain, 2003). BOHA, like most of the parks in the northeast of the United States, is closed for the winter. The combination of minimal visitor use and the natural aeration of the soil through frost heaves during winter months many have contributed to well vegetated areas at the beginning of the season.