1 An Evaluation of Nitrogen Concentrations in the Neuse River Basin
By
April R. Norton
Submitted to the Graduate Faculty of North Carolina State University
In partial fulfillment of the requirements for the Degree of Master of Environmental Assessment
Raleigh, North Carolina 2019
Approved by advisory committee:
Ms. Linda Taylor, Chair Dr. Barry Goldfarb
2 ABSTRACT
Norton, April. Master of Environmental Assessment. An Evaluation of Nitrogen Concentrations in the Neuse River Basin
3 ACKNOWLEDGEMENTS
I would like to express my sincere appreciation to Dr. Barry Goldfarb who provided insight and assistance during the planning, development and conclusion of this project. I will always be grateful for his willingness to provide constructive suggestions to help keep my progress on schedule and his willingness to give his time so generously.
I would like to offer my thanks to the North Carolina Division of Water Resources for providing the data for this project. I would like to offer a special thanks to my supervisor, Mrs. Amy Chapman, for her professional guidance and valuable support. I would like to thank my colleagues within the Transportation Permitting Branch for providing constructive feedback throughout the progression of my project, with a special thanks to Mr. Dave Wanucha, Ms. Nora Deamer, Mr. Jim Hawhee, Mr. Robert Patterson and Mr. Brian Wrenn for project critique, and Ms. Bethany Harvey for the map creation.
4 Table of Contents
1.0 Introduction ... 5
2.0 Methods... 6
2.1. Location ... 6
2.2. Data source for nutrient concentration analysis in the Neuse River and tributaries ... 6
2.3. Data Analysis ... 8
3.0 Results ... 9
3.1. Nitrogen concentration comparisons ... 9
3.2. Concentration of N forms in the mainstem ... 10
3.3. Concentration of N forms in tributaries ... 10
3.4. NH3 concentrations at AMS in the mainstem ... 11
3.5. Change in NH3 concentrations at AMS in the mainstem ... 11
3.6. NH3 concentrations at AMS in tributaries ... 12
3.7. Change in NH3 concentrations at AMS in the tributaries ... 12
3.8. NOx concentrations at AMS in the mainstem... 13
3.9. Change in NOx concentrations at AMS in the mainstem ... 13
3.10. NOx concentrations in tributaries at AMS ... 14
3.11. Change in NOx concentrations at AMS in the tributaries ... 14
3.12. TKN concentrations at ambient monitoring stations in the mainstem ... 15
3.13. Change in TKN concentrations at AMS in the mainstem ... 15
3.14. TKN concentrations at AMS in the tributaries ... 16
3.15. Change in TKN concentrations in the tributaries ... 16
4.0. Discussion ... 17
4.1. Significant sources of TKN concentrations in the Neuse River and tributaries ... 18
4.2. Potential practices causing a decline in NOx and NH3 ... 18
4.2.1. Riparian Buffers ... 18
4.2.2. Wastewater Treatment Plants ... 19
4.3. Potential causes of increases of TKN concentrations and recommendations ... 19
4.3.1. Sediment ... 19
4.3.2. Development ... 20
5 1.0. Introduction
The Clean Water Act (CWA) of 1972 was passed by the U. S. Congress in response to increased water pollution concerns. The CWA’s mission is to restore and maintain the chemical, physical, and biological integrity of the nation’s waters (EPA, 2019). Federal and state regulations are implemented to protect rivers and streams, and other waters of the state, and to avoid and minimize water quality impairment to the maximum extent practicable.
Over 35,000 miles of streams and rivers are within North Carolina, with only 40% of the streams and rivers assessed in 2002 rated as fully supporting (Osmond, 2002). Fully supporting streams and rivers meet their designated uses, such as providing water for fishing, swimming, and drinking. There are numerous factors that may affect a stream or river to become not fully supporting and impaired, such as point and nonpoint source pollution.
Nonpoint source (NPS) pollution is the most common pollution source and is defined by the U.S. Environmental Protection Agency (USEPA) as pollution generally resulting from land runoff, precipitation, atmospheric deposition, drainage, seepage, or hydrologic modification. Rainfall and snowmelt moving over and through the ground, carrying natural and anthropogenic pollutants, depositing them into waterbodies and groundwater, is often the primary cause of NPS pollution. The EPA estimates that agriculture contributes 53%, mining and other activities 13%, miscellaneous 12%, urban runoff 12%, and construction 10% to the pollution load, nationally. Best management practices (BMPs), such as riparian buffers, are utilized within North Carolina to help minimize impacts from NPS pollution.
To help minimize NPS pollution and improve water quality, the Riparian Buffer Protection Program was implemented by the State of North Carolina. The Riparian Buffer Protection Program helps to protect streams, rivers, and lakes from becoming impaired. A riparian buffer is a vegetated area bordering a body of water such as a stream, lake, or pond. The riparian buffer filters stormwater runoff and facilitates the absorption of excess nutrients, controls erosion, regulates temperature, and provides habitat for wildlife (DWR, 2017). North Carolina has 17 river basins, six of which are subject to the Riparian Buffer Protection Program. One such basin is the Neuse River Basin, which is classified as having nutrient-sensitive waters and is protected under the Riparian Buffer Protection Program due to nutrient impairment [North Carolina Administrative Code (NCAC) Section 15A NCAC 02B .0233]. The North Carolina Division of Water Resources (NCDWR) defines nutrient-sensitive waters as waters subject to growths of microscopic or macroscopic vegetation requiring limitations on nutrient inputs. Increased vegetation in waterways is reflected in high chlorophyll-a concentrations. NCDWR has determined the maximum concentration of chlorophyll-a as 40 µg/L.
In 1993, North Carolina Division of Water Quality (NCDWQ) now known as NCDWR, implemented a management plan for the Neuse River Basin to reduce the nitrogen entering the basin from point and nonpoint sources. In 1998, the EMC adopted the state’s first mandatory plan to control both point and nonpoint source pollution within the basin (NCAC 15A NCAC 02B .0233). The developed plan consists of the Neuse River nutrient strategy, a set of rules designed to regulate sources of nutrient pollution in the basin that includes wastewater, stormwater and agricultural nutrient sources. The plan also emphasizes protection for riparian buffers and mandatory training for professionals that apply fertilizer.
6 Beginning in 1991, the state began monitoring NH3, NOx and TKN concentrations at various locations in the Neuse River and tributaries of the river. This study has provided separate NH3 concentrations at the various locations; however, TN is calculated by combining NOx and TKN as TKN concentrations include NH3. The purpose of this study is to evaluate nitrogen concentrations in the Neuse River Basin and determine if the 30% nitrogen reduction strategy mandate is being met.
2.0 Methods
2.1. Location
The Neuse River is located entirely within the State of North Carolina, originating near Durham. The River begins upstream from the Falls Lake Reservoir Dam in the Piedmont and flows southeast towards the mouth near Pamlico Sound at the Coast. In 2013, according to the NCDWR, approximately 10% of the state’s overall total of streams and rivers were within the Neuse River Basin, which includes 3,409 total miles of stream and rivers, 264,552 total acres of estuary, 75 municipalities, and a population exceeding 1.6 million (NCDEQ, 2019).
2.2. Data source for nutrient concentration analysis in the Neuse River and tributaries
NCDWR has a collection of ambient monitoring systems (AMS) located throughout the state to collect physical, chemical and biological parameters used for water quality analysis. Monitoring stations are visited by NCDWR staff at least monthly for the sample collections and measurements (NCDEQ, 2019).
There are 329 active AMS within the state with 43 stations located in the Neuse River Basin. Twenty-three out of the 43 stations were assessed in this study. Each monitoring station has specific identification numbers, which include, station numbers and latitude and longitude. Most of the monitoring stations that are in this study are located at bridge crossings or locations easily accessible by land.
Samples at the monitoring stations are collected for analysis of nutrients, chlorophyll a, turbidity, total hardness, dissolved metals, chloride, fluoride, sulfate, color, oil and grease, and fecal coliform. The samples are then submitted to NCDWR laboratories for analysis. Laboratory analysis are submitted to NCDWR Water Sciences Section for compilation, review, verification, validation, and storing of the data produced. All data submitted are added to an in-house database quarterly and it is also uploaded to the national STORET warehouse annually (NCDEQ, 2019).
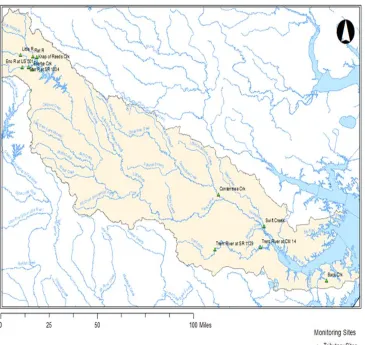
7 Figure 1. Mainstem ambient monitoring stations in the Neuse River assessed in this study.
8 Figure 2. Ambient monitoring stations in the tributaries assessed in this study.
Source: North Carolina Department of Environmental Quality, North Carolina Division of Water Resources, 2019.
2.3. Data Analysis
The data in this study was provided by the NCDWR Basin Planning Section, dated February 2018. The data were used to review NH3, NOx, and TKN trends in the Neuse River Basin. Trends are assessed in two periods: the first period is prior to the nutrient management strategy nitrogen reduction mandate (1991 – 1995), and the second period is after the implementation of the mandate (2007 – 2015). Additionally, the study compares N forms in the mainstem compared to the tributaries.
9 located within the mainstem and 11 AMS in tributaries were analyzed (Table 1). A total of 1,711 samples of NH3, 1,554 samples of NOx and 1,725 samples of TKN were collected during the study periods.
Table 1. Sites assessed in the Neuse River and tributaries.
Neuse River Monitoring Sites Tributaries to the Neuse River Monitoring Sites
Neuse River at CM 11 near Riverdale Back Creek at State Road near Merrimon
Neuse River at CM2 at Mouth of Brad Creek near Thurman
Contentnea Creek near State Road 1800 at Grifton
Neuse River at CM 22 near Fairfield Harbour Ellerbe Creek at State Road 1636 near Durham
Neuse River at CM 52 at Mouth of Narrows near Washington Forks
Eno River at State Road 1004 near Durham
Neuse River at CM 68 below Swift Creek near Askin
Eno River at US 501 near Durham
Neuse River at CM 7 near Oriental Flat River at State Road 1004 near Willardsville
Neuse River at CM 9 near Minnesott Beach Knap of Reeds Creek at WWTP Outfall near
Butner
Neuse River at CM near Mouth near Pamlico Little River at State Road 1461 near Orange
Factory
Neuse River at State Road 1400 at Streets Ferry Swift Creek at Mouth near Askin
Neuse River at State Road 1470 near Fort Barnwell Trent River at CM 14 above Reedy Branch near Rhems
Neuse River at State Road 1915 near Goldsboro Trent River at State Road 1129 near Trenton
Neuse River at State Road 2000 near Falls
Calculations of means and standard errors of the means were conducted using Microsoft EXCEL. Two overall analyses were conducted; one showing the trends over time across all AMS and a second showing the N concentrations at individual AMS across different years in each study period. First, as monthly samples were not available at all sites for all years, the means may be somewhat biased if there were major fluctuations in N concentrations in different months. The standard errors of the means were determined to provide an indication of monthly variation. Then, for the time trends analysis, an annual mean and standard error of the mean across all mainstem sites for NH3, NOx and TKN was computed for each year (Figure 3). This process was repeated for the data from the tributaries of the Neuse River (Figure 4). For the individual AMS analysis, the yearly means at each AMS were used to calculate means and standard errors of the means at each AMS for NH3, NOx and TKN across all years, separately for the two study periods (Figures 5-10).
3.0. Results
3.1. Nitrogen concentration comparisons
10 mainstem. NOx concentrations were 94% higher and TKN concentrations were 7.5% higher in the tributaries (Figures 1 and 2).
3.2. Concentration of N forms in the mainstem
NH3 concentrations in the mainstem averaged 0.04 mg/L in 2007 – 2015, compared to an average of 0.09 mg/L in 1991 – 1995 (Figure 3), a decrease of 56%. Peak NH3 concentrations were observed in 1991, with an average of 0.13 mg/L. Since 2007, NH3 concentrations at the AMS in the mainstem have remained relatively constant.
NOx concentrations averaged 0.31 mg/L in 2007 – 2015, compared to 0.59 mg/L in 1991 – 1995 (Figure 3), a decrease of 47%. Peak NOx concentrations were observed in 1991 and 1993, with both years averaging 0.64 mg/L.
TKN concentrations averaged 0.64 mg/L in 2007 – 2015, compared to 0.51 mg/L in 1991 – 1995 (Figure 3), an increase of approximately 25%. Peak TKN concentrations occurred in 2013 and 2014, with each year averaging 0.68 mg/L.
Figure 3. NH3, NOx and TKN mean concentrations and standard errors of the means across all AMS in the mainstem of the Neuse River for the periods 2007 – 2015 and 1991 – 1995.
3.3. Concentration of N forms in tributaries
NH3 mean concentrations were higher in tributaries during the earlier study period compared to the mainstem. Concentrations decreased in both the mainstem and tributaries during the later study period, with the tributaries having a higher concentration. NOx concentrations were higher than TKN concentrations during the earlier period, while NOx concentrations decreased in the later period, TKN concentrations increased.
11 NOx concentrations averaged 0.86 mg/L in 2007 – 2015, compared to 2.04 mg/L in 1991 – 1995 (Figure 4), decreasing by 58% compared to the earlier period. Peak NOx concentrations were in 1991, with an average of 2.60 mg/L.
TKN concentrations averaged 0.69 mg/L in 2007 – 2015, compared to 0.64 mg/L in 1991 – 1995 (Figure 4), increasing by 8% compared to the earlier period. Peak TKN concentrations were in 2011, with an average of 0.80 mg/L.
Figure 4. NH3, NOx and TKN mean concentrations and standard errors of the mean across all AMS in tributaries of the Neuse River for the periods 2007 – 2015 and 1991 – 1995.
3.4. NH3 concentrations at AMS in the mainstem
NH3 concentrations at AMS in the mainstem ranged from 0.02 mg/L to 0.09 mg/L in 2007 – 2015, compared to a range of 0.03 mg/L to 0.18mg/L in 1991 – 1995 (Figure 5). The sites with the highest NH3 averages in 2007 – 2015 were: Neuse River at State Road 2000 near Falls (0.09 mg/L) and Neuse at CM 52 at Mouth of Narrows near Washington Forks (0.07 mg/L).
3.5. Change in NH3 concentrations at AMS in the mainstem
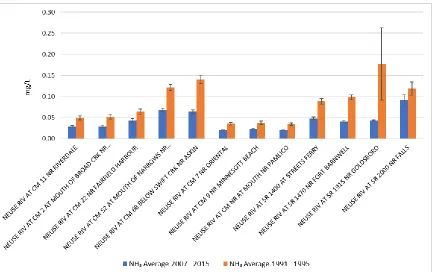
12 Figure 5. NH3 mean concentrations and standard errors of the means at AMS in the mainstem of the Neuse River in the periods 2007 – 2015 and 1991 – 1995.
3.6. NH3 concentrations at AMS in tributaries
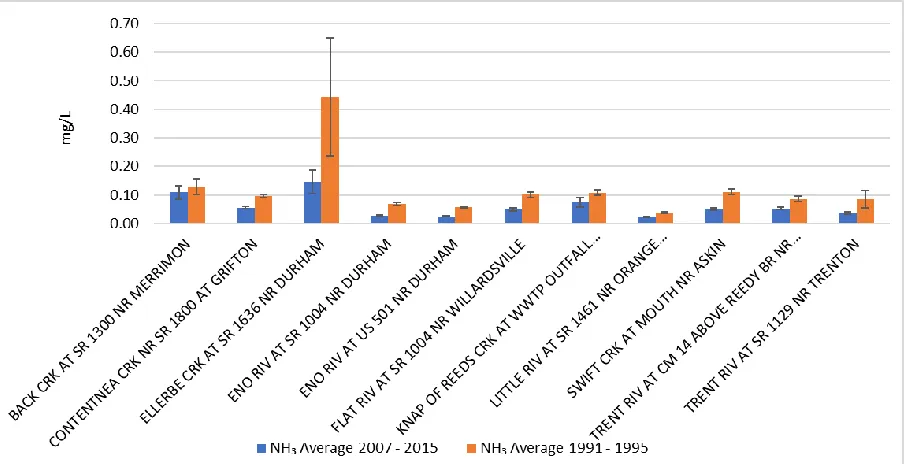
NH3 concentrations decreased at all AMS in tributaries, with concentrations ranging from 0.02 mg/L and 0.11 mg/L in 2007 – 2015, compared to 0.4 mg/L and 0.44 mg/L in 1991 – 1995 (Figure 6). Peak concentration were the following sites: Ellerbe Creek at State Road 1636 near Durham (0.15 mg/L) and Back Creek at State Road 1300 near Merrimon (0.11 mg/L).
3.7. Change in NH3 concentrations at AMS in the tributaries
13 Figure 6. NH3 concentrations and standard errors of the means at AMS in tributaries of the Neuse River in the periods 2007 – 2015 and 1991 – 1995.
3.8. NOx concentrations at AMS in the mainstem
NOx concentrations at AMS in the mainstem ranged from 0.02 mg/L to 0.53 mg/L and 0.02 mg/L to 0.99 mg/L in 2007 – 2015 and 1991 – 1995, respectively (Figure 7). Peak NOx concentrations in 2007 – 2015 were at: Neuse River at State Road 1470 near Fort Barnwell (0.53 mg/L), Neuse River at State Road 1915 near Goldsboro (0.47 mg/L) and Neuse River at State Road 1400 at Streets Ferry (0.47 mg/L).
3.9. Change in NOx concentrations at AMS in the mainstem
14 Figure 7. NOx mean concentrations and standard errors of the means at AMS in mainstem of the Neuse River in the periods 2007 – 2015 and 1991 – 1995.
3.10. NOx concentrations in tributaries at AMS
NOx concentrations in tributaries ranged from 0.15 mg/L to 3.79 mg/L in 2007 – 2015 and to 0.20 mg/L to 12.14 mg/L in 1991 – 1995 (Figure 8). Peak NOx concentrations in 2007 – 2015 were at: Ellerbe Creek at State Road 1636 near Durham (2.59 mg/L) and Knap of Reeds Creek at WWTP Outfall near Butner (3.79 mg/L).
3.11. Change in NOx concentrations at AMS in the tributaries
15 Figure 8. NOx concentration and standard errors of the means at AMS in tributaries of the Neuse River in the periods 2007 – 2015 and 1991 – 1995.
3.12. TKN concentrations at ambient monitoring stations in the mainstem
TKN concentrations in the mainstem ranged from 0.44 mg/L to 0.79 mg/L in 2007 – 2015, and 0.45 mg/L to 0.55 mg/L in 1991 – 1995 (Figure 9). Peak TKN concentrations in 2007 – 2015 were at: Neuse River at CM 2 at Mouth of Broad Creek near Thurman (0.79 mg/L), Neuse River at CM 22 near Fairfield Harbour (0.73 mg/L) and Neuse River at CM 11 near Riverdale (0.69 mg/L).
3.13. Change in TKN concentrations at AMS in the mainstem
16 Figure 9. TKN mean concentrations and standard errors of the means at AMS in the mainstem of the Neuse River in the periods 2007 – 2015 and 1991 – 1995.
3.14. TKN concentrations at AMS in the tributaries
TKN concentrations in the tributaries ranged from 0.38 mg/L to 1.11 mg/L in 2007 – 2015 and 0.34 mg/L to 1.56 mg/L in 1991 – 1995 (Figure 10). Peak TKN concentrations in 2007 – 2015 were at: Ellerbe Creek at State Road 1636 near Durham (1.11 mg/L), Back Creek at State Road 1300 near Merrimon (0.99 mg/L) and Knap of Reeds Creek at WWTP outfall near Butner (0.89 mg/L).
3.15. Change in TKN concentrations in the tributaries
17 Figure 10. TKN mean concentrations and standard errors of the means at AMS in tributaries of the Neuse River in the periods 2007 – 2015 and 1991 – 1995.
4.0. Discussion
To reduce N concentration in the Neuse River Basin, the EMC adopted the nitrogen reduction strategy plan (15A NCAC 02B .0233):
(a) Pursuant to 1995 (Reg. Sess., 1996) N.C. Session Laws, c. 572, the Environmental Management Commission hereby establishes the goal of reducing the average annual load of nitrogen delivered to the Neuse River Estuary from point and nonpoint sources by a minimum of 30 percent of the average annual load for the period 1991 through 1995 by the year 2001. All waters of the Neuse River Basin have been supplementally classified as Nutrient Sensitive Waters (NSW) pursuant to 15A NCAC 2B .0223.
Our study shows that NOx concentrations have decreased from the 1991 – 1995 study period and NH3
concentrations have remained relatively constant. TKN concentrations have increased, however, indicating an increase in organic N inputs. Hurricanes and tropical storms may have had an impact on the
increase in N inputs (Paerl et al., 2006). Tropical storms Barry and Gabrielle made landfall in 2007. Hurricane Irene, Category 3, made landfall in 2011 with max wind speeds of 105 mph. Tropical storm Beryl made landfall in 2012, followed by Hurricane Arthur, Category 2, in 2014. Tropical storm Claudette made landfall in 2015 (NC Climate Office, 2019).
18 These flooding events might have caused substantial changes in N delivered to and in the river that were not detected in this study, because they occurred outside of the study periods.
TN, the sum of TKN and NOx, decreased in the Neuse River AMS in this study during the 2007 – 2015 study period compared to the 1991 – 1995 study period. Mean TN in the mainstem for the 1991 – 1995 study period was 1.1 mg/L compared to 0.94 mg/L during the 2007 – 2015 study period, which is a decrease of approximately 15%. Tributaries of the Neuse River TN mean concentration decreased from 2.68 mg/L in 1991 – 1995 to 1.55 mg/L in 2007 – 2015 (42% decrease).
The annual mean for TN in the 1991 – 1995 study period at the Fort Barnwell monitoring site was 0.74 mg/L compared to 0.57 mg/L in the 2007 – 2015 study period (23% decrease). This finding shows that the 30% N reduction goal has not been met at the Fort Barnwell monitoring site. Supporting data that includes the number of samples, annual mean, standard error of the mean and confidence interval and limits are available in Appendices 1 and 2.
4.1. Sources of TKN concentrations in the Neuse River and tributaries
The highest TKN concentrations within the Neuse River Basin are located near the mouth of the river, and Back Creek at State Road 1300 near Merrimon has the highest mean TKN concentrations within the catchment. It is recommended that biological productivity within Back Creek is assessed.
Data from coastal plain monitoring sites (Neuse River at CM 2 at Mouth of Broad Creek near Thurman, Neuse River at CM 22 near Fairfield Harbour, and Neuse River at CM 11 near Riverdale) indicate there are significant sources of TKN within the drainage area and additional analysis is recommended, such as chlorophyll-a concentrations.
Ellerbe Creek at State Road 1636 near Durham and Knap of Reeds Creek at WWTP Outfall near Butner are upland monitoring sites in the Piedmont that have had a decline in TKN mean concentrations compared to the 1991 – 1995 averages. However, the sites continue to have increased TKN concentrations compared to other Piedmont sites. These site locations should be evaluated more closely to determine if there is an upstream contributor.
4.2. Potential practices causing a decline in NOx and NH3
The implementation of the Neuse River Basin N reduction strategy has resulted in a substantial decline in NOx concentrations and an overall decrease in TN concentration.
4.2.1. Riparian Buffers
The N reduction strategy mandate includes the protection of riparian buffers. Riparian buffers are areas of vegetation that are adjacent to waterbodies that are used for stream protection from nonpoint source pollution, which includes sediment and nutrients. A 50-foot wide riparian buffer is required for all surface waters (intermittent streams, perennial streams, lakes, ponds, and estuaries) in the Neuse River Basin, with features that are shown on either the most recent soil survey map prepared by the National Resources Conservation Service or the most recent topographic map prepared by the United States Geologic Survey (15A NCAC 02B .0233).
19 through the riparian buffer, where plants absorb some of the NOx. Studies have been conducted that suggest 80 – 95% of NOx is removed from the groundwater before it reaches the stream (Osmond, et al., 2002). However, additional research is recommended as riparian buffer NOx removal may not be as effective as originally thought. It should be noted that Johnson et. al, (2012) concluded that riparian buffers do not enhance NOx removal in an upland position. Riparian buffers have the potential to facilitate N reduction by filtering stormwater runoff, facilitating denitrification, and promoting streambank stability which will maintain more vegetation within the buffer. An added benefit is the preservation of aquatic habitat by reducing sediment input (Hunt and Jennings, 2017).
4.2.2. Wastewater Treatment Plants
Wastewater Treatment Plants (WWTP) use new technology, such as biological nutrient removal, to reduce N outputs. Additionally, National Pollutant Discharge Elimination System permits often require N limits. N concentrations are documented on Discharging Monitoring Reports (DMR) that are reported to the State of North Carolina. After reviewing DMR data, it has been determined that WWTPs may not be contributing a substantial amount of N to the surface water.
4.3. Potential causes of increases of TKN concentrations and recommendations
TKN concentration has increased within the Neuse River Basin and studies (Burkholder et al., 1992, Glasgow et al., 1995, Lewitus et al.,1999a, 1999b, Burkholder and Glasgow 1997, Mallin et al., 2000; Lebo, et al., 2011) suggest that the increases may continue due to anthropogenic and climactic factors. Additional studies suggest that TKN concentrations may be increased by stormwater runoff, WWTPs, and agriculture.
4.3.1. Sediment
Sediment is the largest water pollutant in North Carolina by volume (Crouse et al., 2015) and the sediments may contain N. Riparian buffers are effective in reducing sediment loss and help to decrease surface water velocity, causing sediment to settle from the surface water runoff. When riparian buffers are properly implemented and maintained, sediment removal may be as high as 90 – 95% (Osmond, et al., 2002).
However, additional measures are needed to reduce sedimentation in streams, as it may come from many sources, such as highway road banks, agriculture fields, and construction sites (Crouse et al., 2015).
20 4.3.2. Development
Line et al., (2002) determined how pollutant export is impacted by urban land use in the upper Neuse River Basin. The study concluded that mean TKN and NOx concentrations were highest for residential areas, golf courses, and construction site runoff during storm events. It was assumed that commercial fertilization and immature vegetation was a cause for the NOx increase due to runoff. The cause for TKN was less clear, but it is suggested that the significant amount of mulch, that may have contained animal waste, and pet waste deposited along curbs in the area were primary contributors to the increase. When comparing wooded sites (preconstruction sites) to developed sites, it was determined that the developed sites more than tripled in NOx and TKN runoff concentrations.
Stormwater is directly related to land use and the more land is developed and contains impervious surfaces, the more stormwater is generated and the more rapidly it runs off (Hunt and Jennings, 2017). Stormwater control measures (SMCs) are installed to treat, slow and reduce stormwater runoff, which ultimately will reduce N inputs, if the proper SCM design and maintenance are used. One case study found that one Wake County town had approximately 425 SCMs and that 95% of the SCMs failed initial inspection, as repairs were required due to erosion, and trash or tree removal (Hunt and Jennings, 2017). After the town’s compliance program was updated to ensure proper inspection and maintenance, the number of SCMs increased to 950 - and 95% of the SCMs passed inspection (Hunt and Jennings, 2017). When SCMs are properly maintained and inspected they control runoff and flooding and help to improve water quality (Hunt and Jennings, 2017).
Development within the Neuse River Basin may increase N inputs (Line, 2013; Paerl, 2004; Paerl et al., 1990). Areas around the Neuse River Basin are rapidly growing, US Census Bureau 2017 data indicate that Rolesville, Wendell, Knightdale, Morrisville, Clayton are the fastest growing towns in the Triangle area (Fuquay-Varina and Apex are also rapidly growing; however, they are located within the Cape Fear River Basin). Durham is also growing rapidly, more rapidly than Raleigh, with a 1.8% population increase over 2016. It is suggested that rapidly growing areas practice low impact development, as stormwater treatment and infiltration is enhanced by the presence of vegetation and pervious surfaces such as exposed soils. Low impact development has the potential to maintain a site’s hydrology during and after development (Line and White, 2015).
4.3.3. Agriculture
Agriculture is often considered the primary source of NPS pollution (Wossink and Osmond, 2002; Line et al., 2002). Over half (6,646) of the confined animal feeding operations (CAFOs) in North Carolina are in the Coastal Plain (Martin et al., 2018). The increase in CAFOs has also caused an increase in animal waste production, which has the potential of increasing N concentrations in soil, air and water (Yang et al., 2016; Martin et al., 2018).
Additional research is recommended to determine if CAFOs in the Coastal Plain are contributing to the overall TKN increase, as the potential release of N from CAFOs could be exacerbated during storms and flooding.
21 used to determine if the Neuse Rules are being met, which is approved by the EMC. The NLEW development team included representatives from NCDWR, NCDSWC and Natural Resources Conservation Service (NRCS), and the team was led by NC State University Soil Science Department faculty (NCDWR, 2018). This method, however, does not document in-stream N reduction, which may be worthy of consideration in the future.
22 Borsuk, M., Clemen, R., Maguire, L., & Reckhow, K. (2001). Stakeholder values and scientific modeling in the Neuse River Watershed. Group Decision and Negotiation 10, 355–373.
Borsuk, M., Stow, C. A., & Reckhow, K. H. (2003). Integrated approach to total maximum daily load development for Neuse River Estuary using Bayesian Probability Network Model (Neu-BERN). Journal
of Water Resources Planning and Management-ASCE, 271–282.
http://dx.doi.org/10.1061/(ASCE)0733-9496(2003)129:4(271).
Burkholder J. M. Glasgow H. B. (1997). Pfiesteria piscicida and other [toxic] Pfiesteria-like
dinoflagellates: Behavior, impacts, and environmental controls. Limnology and Oceanography 42: 1052– 1075.
Burkholder J. M. Glasgow H. B. Deamer-Melia N. J. (2001a). Overview and present status of the toxic Pfiesteria complex. Journal ofPhycology 40: 186– 214.
Burkholder J. M. Noga E. J. Hobbs C. W. Glasgow H. B. Smith S. A. (1992). New phantom
dinoflagellate is the causative agent of major estuarine fish kills. Nature 358: 407– 410. Nature. 360: 768.
Burkholder J. M., & Glasgow, H. B. (2001). History of Toxic Pfiesteria in North Carolina Estuaries from 1991 to the Present. BioScience, 51(10), 827–840.
Crouse, D., Godfrey, J., McLaughlin, R., & Osmond, D. (2015, May 24). Soil and Water Quality. Retrieved from https://content.ces.ncsu.edu/soils-and-water-quality.
Environmental Protection Agency. (2019). Clean Water Act (CWA) and Federal Facilities. Retrieved from https://www.epa.gov/enforcement/clean-water-act-cwa-and-federal-facilities
Hunt, W., & Jennings, G. (2017). Stormwater BMP Inspection and Maintenance Certification Manual. Raleigh, NC: NC State University.
Johnson, S. R., Burchell, M. R., Evans, R. O., Osmond, D. L., & Gilliam, W. J. (2013). Riparian buffer located in an upland landscape position does not enhance nitrate-nitrogen removal. Ecological
Engineering, 52, 252–261.
Keith, D. J. (2014). Satellite remote sensing of chlorophyll a in support of nutrient management in the Neuse and Tar–Pamlico River (North Carolina) estuaries. Remote Sensing of Environment, 153, 61–78.
Retrieved from https://www.journals.elsevier.com/remote-sensing-of-environment
Lebo, M. E., Paerl, H. W., & Peierls, B. L. (2011). Evaluation of Progress in Achieving TMDL Mandated Nitrogen Reductions in the Neuse River Basin, North Carolina. Environmental Management, 49, 253– 266.
Lewitus A. J. Glasgow H. B. Burkholder J. M. (1999a). Kleptoplastidy in the toxic dinoflagellate, Pfiesteria piscicida. Journal of Phycology 35: 303– 312.
Lewitus A. J. Rublee P. A. Mallin M. A. Shumway S. E. (1999b). Human health and environmental impacts from Pfiesteria: A science-based rebuttal to Griffith. Human Organization 58: 455– 458.
23
Line, D. E., & White, N. M. (2015). Runoff and Pollutant Export from LID Subdivision in North Carolina. Journal of Environmental Engineering, 142(1).
Line, D. E., White, N. M., Osmond, D. L., Jennings, G. D., & Mojonnier, C. B. (2002). Pollutant Export from Various Land Uses in the Upper Neuse River Basin. Water Environment Research, 74(1).
Mallin M. A. Burkholder J. M. Cahoon L. B. Posey M. H. (2000). The North and South Carolina coasts.
Marine Pollution Bulletin 41: 56– 75
Martin, K. L., Emanuel, R. E., & Vose, J. M. (2018). Terra incognita: The unknown risks to
environmental quality posed by the spatial distribution and abundance of concentrated animal feeding operations. Science of the Total Environment.
McDonald, J. H. (2015, July 20). Handbook of Biological Statistics. Retrieved from http://www.biostathandbook.com/standarderror.html
North Carolina Climate Office. (2019). Landfalling Tropical Cyclones in the Southeastern US. Retrieved from https://climate.ncsu.edu/climate/hurricanes/landfalling?state=NC
NCDWR Annual Progress Report (Crop Year 2017) on the Neuse Agricultural Rule (15 A NCAC 2B.0238). (2018, November). Retrieved from
https://files.nc.gov/ncdeq/Environmental%20Management%20Commission/Water_Quality_Committee_ Meetings/2018/november/Neuse-CY2017-Annual-Ag-Report.pdf
North Carolina Department of Environmental Quality, D. W. R. (2019). Neuse River Basin. Retrieved from https://www.ncwater.org/basins/neuse/index01072015.php
North Carolina Department of Environmental Quality, D. W. R. (2019). Ambient Monitoring System (AMS). Retrieved from https://deq.nc.gov/about/divisions/water-resources/water-resources-data/water-sciences-home-page/ecosystems-branch/ambient-monitoring-system
North Carolina Division of Water Resources, W. S. S. (2017, May 5). Survey of Surface Water Quality Associated with Hurricane Matthew. Retrieved from
https://files.nc.gov/ncdeq/Water%20Quality/Water_Sciences/Effects%20of%20Hurricane%20Matthew%
20on%20NC%20Surface%20Waters%20Final.pdf
Osmond, D.L., J.W. Gilliam and R.O. Evans. 2002. Riparian Buffers and Controlled Drainage to Reduce Agricultural Nonpoint Source Pollution, North Carolina Agricultural Research Service Technical Bulletin 318, North Carolina State University, Raleigh, NC.
Paerl, H. W., Mallin, M. A., Rudek, J., & Bates, P. W. (1990). The potential for eutrophication and nuisance algal blooms in the Lower Neuse River Estuary. Albemarle–Pamlico Estuarine study-supported Project. Project No. 90-15 and EPA-CE00470601, Final Report.
24
Paerl, H. W., Valdes, L. M., Joyner, A. R., & Piehler, M. F. (2004). Solving Problems Resulting from Solutions: Evolution of a Dual Nutrient Strategy for the Eutrophying Neuse River Estuary, North Carolina. Environment Science and Technology, 38, 3068–3073.
Stow, C. A., Borsuk, M. E., & Stanley, D. W. (2001). Long-term changes in watershed nutrient inputs and riverine exports in the Neuse River, North Carolina. Water Research, 35(6), 1489–1499.
doi:https://doi.org/10.1016/S0043-1354(00)00402-4
Tippett, R. (2015, January 5). Urbanization Trends. Retrieved from
https://demography.cpc.unc.edu/2015/01/05/urbanization-trends/
United States Department of Agriculture - National Agricultural Statistics Services. (2017). North Carolina Annual Statistics Bulletin. Retrieved from
https://www.nass.usda.gov/Statistics_by_State/North_Carolina/Publications/Annual_Statistical_Bulletin/i ndex.php
Voli, M.T., Wegmann, K.W., Bohnenstiehl, D.R., Leithold, E.L., Osburn, C.L., & Polyakov, V. (2013). Fingerprinting the sources of suspended sediment delivery to a large municipal drinking water reservoir: Falls Lake, Neuse River, North Carolina, USA. Journal of Soils and Sediment 13(10), 1692-1707.