WELLS, M. SCOTT. The Evaluation of Rye Cultivars on Weed Suppression, Soybean Yield and Nitrogen Dynamics in the "Roll-killed" Organic Cover Crop System. (Under the
direction of S. C. Reberg-Horton).
The “roll-‐killed” cover-‐crop system has been successful in reducing weed
pressures in organic soybeans. This study examined six-‐rye cultivars as cover crops to
determine which were most suitable for use in the rye roll-‐killed organic soybean
system for the Southern US. Six rye cultivars, three facultative, Spring type cultivars,
and three non-‐facultative, winter type cultivars, were planted at three locations over
the 2009 and 2010 growing seasons. Non-‐facultative winter type rye cultivars may
require vernalization offered by a fall planting in order to complete their life cycle.
However, facultative Spring type rye cultivars may not require vernalization to
complete their lifecycle and can be planted in spring or fall (Reberg-‐Horton et al., 2003).
Each rye cultivar was roll-‐killed at soft-‐dough and soybeans (Glycine Max L. ‘NC Roy’) of
maturity group VI were planted on two separate dates (i.e. early and late roll-‐kill).
Favorable weather through out the 2009 growing season combined with early rye
planting resulted in all rye cultivars being roll-‐killed with 100% kill rating for both
dates. All rye cultivars produced greater than 9000 kg ha-‐1 rye biomass with exception
of Rymin at Plymouth. Weed control during the 2009 growing season was excellent and
there was no rye cultivar effect on soybean yield. Due to an unseasonably cold and wet
winter, after the early roll-‐kill date (Rolldate 1) in 2010, only the spring type cultivars
were rated at 100% kill. Winter type cultivar Aroostook, along with all the spring
cultivars were the only rye cultivars rated at 100% kill by the late roll-‐kill date
broadleaf percent coverage, which could be explained by Wheeler’s reported
allelopathic activity. Soybean yield in 2010, was modeled with rye biomass (kg ha-‐1)
and soybean stand count (counts m-‐1) where rye biomass and soybean stand count
were used as covariates. Due to a dry and hot summer, soybean stand count negatively
effected soybean yield during Rolldate 2. Overall, Wheeler was found to be the most
suitable rye cultivar for organic soybean production using the roll-‐killed system in the
Southeast US based on its good biomass production, allelopathic properties, and a
termination date that closely synchronizes with soybean planting dates (Mid May-‐June).
The use of cover crops to suppress weeds, enhance soil organic matter and
prevent nutrient leaching has been well documented in organic cropping systems. Rye
(Secale cereale L.) used alone and in mixture with leguminous cover crops, has been
deployed in organic cropping systems to achieve many of these beneficial effects. The
roll-‐killed cover-‐cropping system has been reported to both suppress weeds and aid in
soil fertility. . This study investigated the nitrogen immobilization dynamics of soybeans
under the rye roll-‐killed system. The ability of high C:N ratio residues to immobilize N is
well known, but the impact of surface mulches on N immobilization is not well
characterized. A three site-‐year study was conducted in North Carolina during the 2009
and 2010 growing seasons at Kinston and Goldsboro. Two treatments were evaluated
in 2009 with an additional check added in 2010. Treatments consisted roll-‐killed rye
(RR), conventional tillage no rye (CT), and a weed-‐free rolled-‐rye with herbicide
(RR+HB). All treatments received approximately 50 kg ha-‐1 N in the Spring 2009 and
planting of soybeans (Glycine max L. ‘Hutcheson’) in May 2009 and 2010. The rye
biomass varied between the sites with approximately 4,400, 8,300, and 7,084 kg ha-‐1
DM for Goldsboro (2009), and Kinston (2009 and 2010) respectively. During the
season, movement of soil inorganic nitrogen was monitored via ion exchange probes
and with soil extractions from two depths (0-‐10.2 cm and 10.2-‐25.4 cm). Tissue data
was collected on both soybeans and redroot pigweed (Amaranthus retroflexus L.
‘Redroot Pigweed’) to determine the percent nitrogen. Initially, there was less
extractable soil inorganic nitrogen (nitrate and ammonium) in the rolled-‐rye treatment
(RR) compared with the conventional tilled no rye treatment (CT) at two of the three
sites. The extractable soil inorganic N at Kinston 2009 between RR and CT was 6.0 and
12.4 kg ha-‐1 N and at Kinston 2010, 4.1 and 20.5 kg ha-‐1 N respectively. For all sites,
peak nitrogen immobilization occurred between 4 and 6 weeks after planting. The ion-‐
exchange probes had similar trends to the extractable soil inorganic N at all sites.
Surface mulches caused a significant N immobilization effect in the soil profile. Future
work is needed to determine whether the effect is ‘created’ from transport of soil N to
by M. Scott Wells
A thesis submitted to the Graduate Faculty of North Carolina State University
in partial fulfillment of the requirements for the degree of
Master of Science
Crop Science
Raleigh, North Carolina 2011
APPROVED BY:
_______________________________ ______________________________
Samuel Chris Reberg-Horton Julie Grossman
Committee Chair
________________________________ ________________________________
DEDICATION
BIOGRAPHY
ACKNOWLEDGMENTS
I would like to thank Chris Reberg-Horton and my committee for their support, guidance, and mentorship. Also I want to express my gratitude to Carrie Brinton for all her help
making these projects a success. I want to thank George Place, Adam Smith, and Aaron Fox, for their help and support. Finally, I want to thank my wife Anne Marie Wells for her
TABLE OF CONTENTS
LIST OF TABLES ... vi
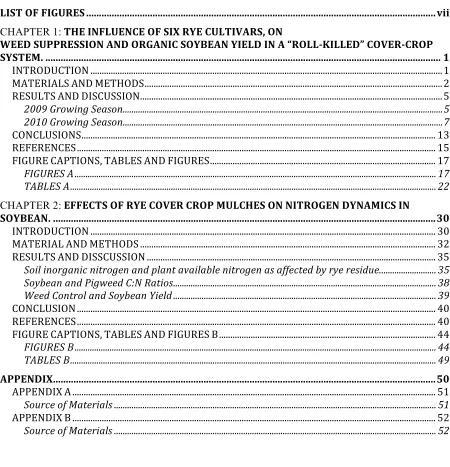
LIST OF FIGURES ... vii
CHAPTER 1: THE INFLUENCE OF SIX RYE CULTIVARS, ON WEED SUPPRESSION AND ORGANIC SOYBEAN YIELD IN A “ROLL-‐KILLED” COVER-‐CROP SYSTEM. ... 1
INTRODUCTION ... 1
MATERIALS AND METHODS ... 2
RESULTS AND DISCUSSION ... 5
2009 Growing Season ... 5
2010 Growing Season ... 7
CONCLUSIONS ... 13
REFERENCES ... 15
FIGURE CAPTIONS, TABLES AND FIGURES ... 17
FIGURES A ... 17
TABLES A ... 22
CHAPTER 2: EFFECTS OF RYE COVER CROP MULCHES ON NITROGEN DYNAMICS IN SOYBEAN. ... 30
INTRODUCTION ... 30
MATERIAL AND METHODS ... 32
RESULTS AND DISSCUSSION ... 35
Soil inorganic nitrogen and plant available nitrogen as affected by rye residue. ... 35
Soybean and Pigweed C:N Ratios ... 38
Weed Control and Soybean Yield ... 39
CONCLUSION ... 40
REFERENCES ... 40
FIGURE CAPTIONS, TABLES AND FIGURES B ... 44
FIGURES B ... 44
TABLES B ... 49
APPENDIX ... 50
APPENDIX A ... 51
Source of Materials ... 51
APPENDIX B ... 52
LIST OF TABLES
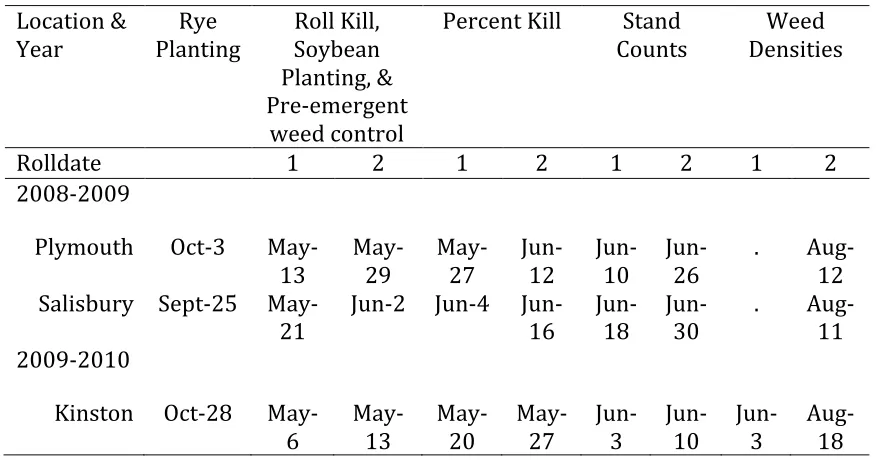
Table 1-1 Dates for rye and soybean planting and other field activities for Plymouth,
Salisbury and Kinston for 2009-2010. ... 22
Table 1-2 Termination (Roll-kill) times for rye (Secale cereal L.) cover crops in the
Southeastern US. ... 23
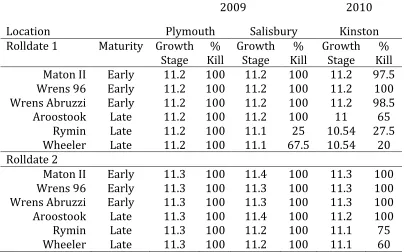
Table 1-3 Mean percent kill of six rye cultivars stands for two roll-dates two weeks after planting. ... 24
Table 1-4 Mean stand count (counts m-1) for soybeans planted into six rye cultivars for two
different roll dates ... 25
Table 1-5 Weed data for Salisbury and Plymouth 2009 not present due to excellent control in all treatments. ... 26
Table 1-6 Rolldate 1 Models ... 27
Table 1-7 Rolldate 2 Models ... 28
Table 1-8 Mixed-model analysis of variance of soybean yield from Kinston 2010 as
determined by rye cultivar, roll-kill date along with contrast statements. ... 29
Table 2-1 Weed management treatment effect on soybean yield ... 49
Table 2-2 Weed management treatment effect on weeds density ... 49
LIST OF FIGURES
Figure 1.1 Average monthly precipitation, air temperature, and 30-year normal for
Plymouth, NC and Salisbury, NC (2009), and Kinston, NC 2010. ... 17
Figure 1.2 Mean dry matter biomass production for Salisbury and Plymouth research
stations for 2009. ... 18
Figure 1.3 Soybean yield for Salisbury and Plymouth (2009). ... 19
Figure 1.4 Mean dry matter biomass production for Kinston research stations for 2010 ... 20
Figure 1.5 (Top) Early roll kill date soybean yield as predicted by stand count and rye. (Bottom) Late roll kill date soybean yield as predicted by stand count and rye biomass.. ... 21 Figure 2.1 Monthly precipitation (mm) rainfall for Goldsboro and Kinston, NC 2009-2010. Weather data provided via State Climate Office of North Carolina. ... 44
Figure 2.2 Mean soil inorganic nitrogen.. ... 45
Figure 2.3 Mean plant available nitrogen as measured by Plant Root Simulator Probes (PRS-Probes). ... 46
Figure 2.4 Soybean C:N Ratios. ... 47
Chapter 1:
The i
nfluence of six rye cultivars,
on
weed
suppression
and
organic soybean yield in
a “roll-‐
killed” cover
-‐
crop system.
INTRODUCTION
In the absence of herbicide and transgenic crops, organic soybean producers
must utilize a broad spectrum of technologies to suppress and control weeds. These
technologies range from intensive cultivation to the use of cost-‐prohibitive organically
approved herbicides. Intensive tillage may be adequate in controlling weeds in organic
soybeans but the practice requires several timely applications, which has the potential
to negatively impact soil health. A relatively new practice that employs an implement
known as the roller-‐crimper could offer organic soybean producers in the Southeast a
conservation tillage approach that avoids energy intensive tillage practices. The roller-‐
crimper is a device that utilizes a chevron pattern blunted-‐blade mounted drum filled
with water that flattens and crimps the mature cover crop without cutting the stems
(Rodale Institute 2009). In organic soybean production, rye is typically the cover crop
of choice due to its high biomass production, early maturity, and allelopathic properties
(Stoskopf, 1985; Smith et al. 2011; Mirsky et al. 2009; and Reberg-‐Horton et al. 2005).
The roller-‐crimper system utilizing rye with soybeans has been shown to be
highly effective in reducing weed crop interference (Mirsky et al., 2009 and 2011; Davis
2010; Smith et al. 2011; and Wells et al. 2011) when the rye cover crop achieves the
critical biomass threshold (Teasdale and Mohler, 2000; Smith et al., 2011). Rye biomass
roll-‐kill dates (Mirsky et al., 2009 and 2011) along with temperature and photoperiod
can contribute to suboptimal rye biomass production (Travis et al., 1988; Mirschel et al.,
2005). Regional microclimates can greatly influence the performance of rye thereby
increasing the importance of selecting the best-‐adapted rye cultivars for the southern
US. Six rye cultivars, three facultative, spring type cultivars (Maton II, Wrens 96, and
Wrens Abruzzi), and three non-‐facultative, winter type cultivars (Aroostook, Rymin,
and Wheeler), were planted at three locations over the 2009 and 2010 growing
seasons. Non-‐facultative winter type rye cultivars may require vernalization offered by
a fall planting in order to complete their life cycle. However, facultative spring type rye
cultivars may not require vernalization to complete their lifecycle and can be planted in
spring or fall (Reberg-‐Horton et al., 2003). Each rye cultivar was evaluated for impact
on weed control and the performance of the subsequent organic soybean roll-‐killed
crop.
MATERIALS AND METHODS
In 2009 and 2010, field experiments were conducted at Piedmont Research Station near Salisbury, NC, Tidewater Research Station, near Plymouth, NC, and Caswell Research Station, near Kinston, NC. The Salisbury soil type was Lloyd clay loam, 2-8 percent slope, and moderately eroded. The soil types at Plymouth were Muchalee loam and Portsmouth fine sandy loam (fine-loamy over sandy or sandy-skeletal mixed, thermic, Typic
Umbraquult). The soil type for Kinston was Johns loamy sand (course-loamy siliceous, semiactive, thermic, Arenic Hapludults) with 0-3 percent slope.
Plymouth and Salisbury from October 2008 through October 2009, and for Kinston from October 2009 through October 2010 (Figure 1-1).
The experiment was a strip plot randomized complete block design with four
replicates at Plymouth and Salisbury, and six replicates at Kinston. Treatments consisted of six rye (Secale cereal) cultivars, three winter type (Aroostook, Rymin, and Wheeler) and three spring type (Maton II, Wrens 96, and Wrens Abruzzi) that were roll-killed. In addition to the roll-killed rye treatments there were three checks outside of the treatment structure: Rolled rye with herbicide weed control (i.e. weed free, RR-WF), no rye no-tilled with
herbicide weed control (WF), and no rye no-tilled without herbicide weed control (i.e. weedy check, WC). Wrens 96 and Wheeler were used in the RR-WF checks across all six blocks with Wrens 96 for Rolldate 1 (Rolldate 1), and Wheeler for the late roll-kill date (Rolldate 2). All treatments were stripped into two levels of roll dates (early and late).
Prior to winter planting all locations were disked and field cultivated to remove any existing vegetation. Lime, phosphorus, and potassium were applied according to soil tests prior to rye planting. To ensure adequate nitrogen fertility for the rye cover crop, Plymouth, Salisbury, and Kinston Research Stations received 30-40 kg-N ha-1 prior to planting. All locations received an additional 50-60 kg-N ha-1 top-dressed urea ammonia nitrate prior to jointing in the spring.
The plot size at all locations was four rows wide at 76.2 cm row spacing by 15.24 m long. All rye cultivars were drilled using a 1.52 m, 8 row, no-till cone planter with 19.0 cm spacing between drill lines at 128 lb ac-1 (143 kg ha-1). During mid to late May,
Following the termination of the rye cover crops, soybeans (Glycine Max L. ‘NC Roy’) of maturity group VI, were planted parallel to rolling at 555,750 live seed ha-1 with 72.6 cm row spacing using a Monosem® NG Plus Vacuum planter equipped with Yetter Shark Tooth® residue managers to assist planting in no-till conditions. Before soybeans were harvested in late fall to early winter, plots were trimmed to 12.19 m to minimized any
potential edge effect. Soybean yield data was collected on the interior two rows. Weed control methods at all locations consisted of pre-plant burn down with
glyphosate on the no-rye no-tilled plots, along with the weed free and weedy check plots. In addition to the pre-plant burn down, weed free plots (both with and without rye cover crop) were treated at planting for pre-emergent weed control with S- metolachlor at 1.91 kg a.i. ha
-1. Hand weeding was done in addition to herbicide control as needed to ensure weed free
conditions in the WF and RR-WF plots.
Crop parameters of interest for both roll dates include growth stage of the rye cover-crop, rye dry matter biomass production, percent kill after rolling, soybean stand count, weed density, both early and late season percent weed coverage, and soybean yield.
Weed density and percent weed cover estimates were recorded 4 (per soybean canopy closure) and 12 (post soybean canopy closure) weeks after planting (WAP). The per-canopy closure weed densities were gathered on a 0.5 m2 area basis, whereas percent coverage estimates were determined for the entire plot. The post canopy closure weed densities were recorded after canopy closure (12 WAP) on all plots by counting all above canopy weeds across the middle two soybean rows (20.9 m2).
A combined analysis was attempted on the three trials, but significant treatments by environmental interactions prevented a pool analysis. Each site was analyzed separately with mean separation generated with Fisher’s Protected Least Significant Difference (LSD) and orthogonal contrast. Within each site, treatments were fixed and blocks were random effects. Kinston 2010 yield data was modeled with PROC MIXED using TYPE 1 test for fixed
effects (SAS, 2011). The Akaike information criterion (AIC) was used for model selection (Johnson and Omland, 2004). (SAS 2010).
RESULTS AND DISCUSSION
2009 Growing Season
kill ratings of 25 and 67.5 percent kill respectively (Table 3). However, all cultivars at Salisbury and Plymouth were rolled with 100 percent kill by Rolldate 2. We attribute the cultivar flowering differences observed for Rymin and Wheeler at Salisbury to the lower temperatures throughout the winter when compared to Plymouth (Figure 1-1). Overall differences in time of flowering were less pronounced in 2009 than 2010. Rye was planted earlier in the first year and winter temperatures were warmer (Figure 1-1) though still cooler than typical for the region.
Because all rye cultivars at Plymouth were past the milk stage by Rolldate 1 during the 2009 season, there was not an observable significant roll-kill date effect on rye biomass production (Figure 1-2). However, a significant (p<0.02) rye cultivar effect at Plymouth was detected. Rymin, a northern cultivar, was the only rye cultivar at Plymouth that produced significantly less biomass (p<0.05), which contributed to the difference of northern versus southern cultivars (p<0.07). We failed to detect a significant roll-kill date and rye cultivar effect on biomass production at Salisbury. However, the roll-kill date by rye cultivar interaction was significant at both Plymouth (p < 0.07) and Salisbury (p < 0.001) in
predicting rye biomass production. Growing degree-days were found to be highly significant (p < 0.0001) when determining rye biomass production (Mirsky et al., 2011). Even though monthly temperatures were lower at Salisbury when compared with Plymouth, the rye cultivars at Salisbury were planted earlier and roll-killed later than those at Plymouth, thus independent rye cultivar effects or roll-kill date effects on biomass production could have been reduced on the basis of longer growing season at Salisbury.
nearly 100% soybean emergence. Mean soybean stand count for Salisbury and Plymouth were 48.5 m-1 and 42.8 m-1, which correspond to 636,482 and 561,680 soybean plants per hectare respectively. Soybean stand counts varied minimally between the six rye cultivars and the three checks at both locations for the early and late roll kill dates (Table 1-4), and all stand counts for Salisbury and Plymouth were within the range to successfully compete with in-row weed pressures (Place et al., 2009). Along with high stand counts, rye biomass production across all cultivars for both locations were above the critical threshold (9,000 kg/ha rye DM) for sufficient weed control (Figure 1-2; Smith et al., 2011). Weed control was excellent at both Plymouth and Salisbury across all rye cultivars, and there was no rye cultivar effect detected on soybean yield. The rolled rye treatments performed as well as conventional no-tilled checks that were maintained weed free through the use of herbicides (Figure 1-3).
2010 Growing Season
Rye biomass production varied among the rye cultivars in the second year of the experiment. Termination date was not found to be significant in predicting rye biomass production, whereas the rye cultivars were significant in predicting biomass production (p < 0.001). Wrens Abruzzi, Wrens 96 and Maton II all reached the critical biomass threshold for weed control (9000 kg ha-1) by Rolldate 1. Aroostook was the only northern cultivar that produced above 9000 kg ha-1 dry matter. Similar to Plymouth and Salisbury (2009), both Rymin and Wheeler fell short of 9000 kg ha-1 (the critical weed control threshold) with 6000 kg ha-1 and 8000 kg ha-1, respectively (Figure 1-2). Further investigation revealed that winter
All spring cultivars were statistically equivalent (p< 0.05), whereas Rymin was the lowest yielding rye cultivar of both the winter and spring type cultivars.
The weather trends at Kinston during the 2009-2010 cover crop growing season could offer some explanations to the large cultivar differences observed. Kinston was 1.5 times wetter than the 30-year average, with 200 mm and 160 mm of precipitation for November and December, respectively. Likely more important was the exceptionally dry April with only 25 mm of precipitation. Akemo et al. (2000) experienced similar climate conditions and reported poor rye growth of 1 MT ha-1. The low water holding capacity of the soil (Johns loamy sand course-loamy siliceous, semiactive, thermic, Arenic Hapludults with 0-3 percent slope) meant little water was available for rye growth. Southern types had almost reached their full height before the dry period began, but northern types were still short (pre-boot). Since grain crop phenology depends on temperature and photo period (Mrisky et al., 2009; Travis et al., 1998; and Mirschel et al., 2005), the combination of cold temperatures and greater than normal precipitation during the 2010 winter could have favored the spring type cultivars, while at the same time hampering the early growth of the winter type cultivars (Reberg-Horton, 2002).
Spring type cultivars were nearly 100% ready to be rolled by the May 13th (Rolldate 1), whereas the winter type cultivars Aroostook, Rymin and Wheeler were not, with 65%, 27.5% and 20% kill 2-WAP. Even by the later kill date only Aroostook was 100% roll-ready, with Rymin and Wheeler still lagging behind at 75% and 60% kill ratings, respectively (Table 1-3).
populations were nearly half of what would be expected for populations of 555,750 soybean plants per hectare at 76.2 cm row spacing. The rye treatments all had lower stand counts than the WF and WC. We attribute the poor stand quality during Rolldate 1 to the lack of
precipitation throughout April and mid-May. Planting conditions were drier and warmer than the 30-year average during Rolldate 1, and available soil moisture could have been limited for all treatments. The soil would have been drier in roll-killed plots due to
transpiration of the cover crop both before and after the roll kill event, thereby lowering the available soil moisture. Ashford and Reeves (2003) observed similar depletion of soil water by a still-growing cover crop; which resulted in a reduction of soil moisture that could affect the emergence of the cash crop.
Soybean stand improved somewhat for Rolldate 2. All rye cultivars had stand counts above 35 soybeans m-1, which was a population equivalent to 461,890 plants per hectare. Prior to the late roll kill and planting date, Kinston received 38.1 mm of rainfall. Unlike the dry conditions experienced prior to Rolldate 1, frequent rain events continued throughout the end of June resulting in slightly above average precipitation.
Much like soybean stand counts, weed densities and percent coverage were variable across the two roll-kill dates. The predominant weeds at Kinston included: redroot pigweed (Amaranthus retroflexus L.), morningglory (Ipomoea L. spec.), sicklepod (Cassia obtusifolia
populations have been shown to significantly reduce summer annuals, both in and between rows, by increasing the soybean competitiveness (Place et al., 2009, Wiese et al., 1964). Although weed densities were greater for Rolldate 1, they were still significantly lower (p < 0.05) than the weed densities in the weedy check plots. No differences in control of grass species was detected when comparing all rolled-rye treatments to weed-free checks
(excluding WC), thus indicating excellent control of grasses in the rye roll-killed plots. The broadleaf weed control was somewhat dependent on the rye cultivar. Aroostook had the highest densities of broadleaves weed counts with 1.6 counts m-2, followed by Rymin (1.3 m
-2), Maton II (1.2 m-2), and surprisingly Wrens Abruzzi (1.1 m-2). Wrens Abruzzi produced in
excess of 10,000 kg ha-1 rye biomass, but had weed densities equivalent to Rymin (6365 kg ha-1) for the early roll kill date. Wrens 96 and Wheeler had the lowest populations of
12.5%) whereas Rymin (17.9%) was not found to be significantly different from the WC plots (24.9%). (Table 5).
Weed densities and percent coverage for both grasses and broadleaves were even less variable within rye cultivars for Rolldate 2. We detected no significant differences within cultivars for early (pre-canopy closure) grasses and broadleaf density and no differences for early broadleaf percent coverage. The late season weed estimates (post-canopy closure) were similar, with no detectable differences for grasses and broadleaf densities and percent
coverage. We failed to detect any late broadleaf density differences between the WC and the other six-rye cultivars. All treatments for Rolldate 2 had significantly lower (p<0.05) early grass and broadleaf densities along with late broadleaf percent coverage when compared to the WC plots (Table 5).
Soybean yield trends for Kinston (2010) were more complex than those previously observed at Plymouth and Salisbury during the 2009-growing season. A significant effect of cultivars and roll-kill effect on soybean yield (p< 0.01) was detected. During Rolldate 1 the conventional tilled weed free (WF) plots yielded significantly higher (p< 0.05) than the weed free rolled rye plots (RR-WF). However, we failed to detect any yield differences between the weed free rolled rye (RR-WF) plots and the six rye cultivars.
For Rolldate 1, both stand count and rye biomass positively affected soybean yield (Table 6). Weed pressures were not found to significantly reduce yield, as evident of the non-significant contrast RR+HB vs all six rye cultivars (Table 8). These findings were in
agreement with previous studies where high rye biomass level reduced weed competition thereby contributing to increased soybean yield (Smith et al. 2011). The stand counts for the early roll date were much lower than anticipated with 40-45 plants m-1 more typical for the given seeding rates. The no-rye weed free check (WF) had 23.5 soybeans m-1 whereas the weed free roll-killed rye check (RR+HB) had only 12.5 soybeans m-1 resulting in lower yield in all early roll-killed rye plots.
Rolldate 2 was unlike Rolldate 1. For Rolldate 2, weeds did significantly reduce soybean yield in all six-rye cultivars as illustrated by the significant (p < 0.03) contrast RR+HB vs all six rye cultivars (Table 8). Even though the weed-free rolled rye plots (RR+HB) did yield better than the six rye cultivars for Rolldate 2, we failed to detect any yield difference when compared to the conventional no-tilled weed free plots (WF).
Similar to Rolldate 1 analysis, we chose stand count and rye biomass as covariates to model soybean yield. (Table 7). Using the Akaike information criterion we chose Model 1 to best predict soybean yield. Rye biomass was found to be less of a factor when
determining soybean yield for Rolldate 2 (p<0.082), however, stand count (p<0.066), cultivar (p<0.035), and stand count2 (p<0.068) were all significant. Despite producing less rye
biomass, plots with northern rye cultivars significantly (p<0.001) out-yielded soybeans grown in southern rye cultivars.
soybean populations increased (Figure 1-5 Bottom), which is in contrast to our earlier observations. Early roll-kill plots had extremely low soybean populations relative to seeding rates (Table 4), which populations for Rolldate 2 were nearly twice as dense. It is possible that rye mulched combined with timely rainfall events possible provided favorable conditions for optimal early soybean stand. However during the hot and dry summer (Figure 1-1) experienced in 2010, the additional soybean populations at a time of increased drought stress could have effected crop on crop competition for available soil moisture during critical growth phase therefore limiting yield by reducing pod set, and seed size (Walker et al., 2010; Heatherly and Elmore, 2004; Specht et al., 1999).
We have observed that soybeans grown under rye mulches placed lateral support roots closer to the surface. (Photo 1. data not presented). The mechanism(s) behind this effect is unclear. It is possible that the enhanced soil moisture conservation and nutrient exchange from rye surface mulches (Wells et al, 2011) influenced the spatial position of the lateral roots. Mechanical impedance in no-tilled soils has shown to increase root branching of soybeans in the surface (0-5 cm) soil layers when compared to conventionally tilled soils (Iikima et al., 2007). Providing soybeans in no-till/roll-killed system produce less root growth in deep soil profiles, as the rye mulch and soil dries out, soybeans in roll-killed system could experience greater drought stress during an usually dry and hot season.
CONCLUSIONS
cover crop can become a weed by reseeding, whereas a late maturing cultivar may prove difficult to kill by rolling which can negatively effect soil moisture conditions for the following crop (Ashford and Reeves, 2003).
We recommend Wheeler for late May to early June soybean plantings. Wheeler was not the highest biomass producer in 2010, but its slower maturation could provide greater allelopathic weed control activity. Soybeans grown in Wheeler mulch produced equivalent yields to the weed free rolled-rye checks (RR+HB). For early to mid May soybean plantings, Maton II could be an acceptable rye cultivar. Maton II had equivalent weed control to the higher biomass producing cultivars such as Wrens 96 and Wrens Abruzzi. Since Maton II flowers slightly later than Wrens 96 and Wrens Abruzzi there is less potential for reseeding.
REFERENCES
Akemo, M. C., Regnier, E. E., and Bennett, M. A. 2000. Weed suppression in spring- sown rye (Secalecereal)—Pea (Pisum sativum) cover crop mixes. Weed Technology. 14:545—549.
Ashford, D. L. and D. W. Reeves. 2003. Use of a mechanical roller crimper as an alternative kill method for cover crop. American Journal of Alternative Agriculture 18: 37-45.
Johnson, J. B., and Omland, K. S. 2004. Model selection in ecology and evolution. Trends Ecol. Evol. 19:101—108.
Hamilton, M., and Reberg-Horton, S. C. 2005. Organic Field Crop Production and Marketing in North Carolina: Organic no-till roller system.
http://www.organicgrains.ncsu.edu/notill.htm#bloomchart Accessed: June
20, 2011.
Heatherly, L.G. and Elmore, R.W. 2004. Managing inputs for peak production. P.
451—536. In H.R. Boerma and J.E. Specht (ed.) Soybeans: Improvement, production and uses. 3rd ed. Agron. Monogr. 16. ASA CSSA and SSSA, Madison, WI.
Iijima, M., Morita, S., Zegada-Lizarazu, W., and Izumi, Y. 2007. No-tillage enhance the dependence on surface irrigation water in wheat and soybeans. Plant Prod. Sci. 10(2):182—188.
Johnson, J. B. and Omland, K. S. 2004. Model selection in ecology and evolution. Trends in Ecology and Evolution. Vol.19 No. 2. February.
Mirschel, W., Wenkel, K.O., Schultz, A, Pommerening, J. and Verch, G. 2005. Dyanmic phenology model for winter rye and winter barley. Eur. J. Agron. 23:123--135. Mirsky, S. B. Curran, W. S., Mortensen, D. M., Ryan M. R., and Shumway, D. L. 2009.
Control of cereal rye with a roller/crimper as influenced by cover crop phenology. Agronomy Journal. Vol. 101, issue 6.
Mirsky, S. B. Curran, W. S., Mortensen, D. M., Ryan M. R., and Shumway, D. L. 2011. Timing of cover-crop management effect on weed suppression in no-till
planted soybean using roller-crimper. Submitted to Weed Science and under review.
Reberg-Horton, S. C. 2002. Optimizing allelopathy and nitrogen scavenging in rye cover crops. PhD thesis. North Carolina State University.
Reberg-Horton, S. C., Creamer, N. G., Danehower, D. A., Ma, G., Monks, D. W., Murphy, J. P., P., Ranells, N.N., Williamson, J.D., and Burton, J. D. 2003. Cultivar and maturation effects on allelochemical content of ten cultivars of rye. vol. 57, p. 84, in Proceedings of the Annual Meeting-Northeastern Weed Science Society. Reberg-Horton, S. C., Burton, J.D., Danehower, D. A., Ma, G., Monks, D. W., Murphy, J.P.,
Ranells, N. N., Williamson, J. D., and Creamer, N, G. 2005. Change over time in the allelocchemical content of ten cultivars of rye (Secale cereale L.). Journal of Chemical Ecology, Vol. 31, No. 1. pp. 179-193.
Smith, A. N., Reberg-Horton, S. C., Place, G. T., Meijer, A. D., Arellano, C., and Mueller, J. P. 2011. Rolled Rye Mulch for Weed Suppression in Organic No-Tillage
Soybeans. Weed Science, 59(2):224-231.
Specht, J.E., Hume, D.L., and Kumudini, S.V. 1999. Soybean yield potential—a genetic and physiological perspective. Crop Sci. 39:1560--1570.
Stoskopf, N. C. 1985. Rye. p. 403—414. In Cereal grain crops. Prentice Hall, Reston VA.
Travis, K.Z., Day, W. and Porter, J.R. 1998. Modeling the timing of early development of winter wheat. J. Agric. For. Meteorol, 44:67—79.
Walker, E.R., Mengistu, A., Bellaloui, N., Koger, C. H., Roberts, K. and Larson, L. A. 2010. Plant population and row-spacing effects on maturity group III
soybeans. Agron. J. 102:821—826.
FIGURE CAPTIONS, TABLES AND FIGURES
FIGURES A
Figure 1.2 Mean dry matter biomass production for Salisbury and Plymouth research stations for 2009. Roll Date was not found significant for both Plymouth and Salisbury. Rye cultivar was significant in predicting biomass yield at Plymouth only (p < 0.02). The interaction of roll date by cultivar was slightly significant at Plymouth (p<0.07) and significant at Salisbury (p<0.001). Means from Plymouth followed by the same letter are not significantly different based on Fisher’s Protected LSD test at P < 0.05. Due to the roll data by cultivar interaction at Salisbury, means separated by α signify a significant roll date by cultivar interaction based on Fisher’s Protected LSD test at p < 0.05. * Critical rye biomass threshold for weed control.
Figure 1.3 Soybean yield for Salisbury and Plymouth (2009). We failed to detect any varietal differences from both Plymouth and Salisbury within rye variety. Roll kill date was also not found to be significant at Plymouth. Roll-‐kill date was found to be significant at Salisbury (p<0.05). * Washington County mean
soybean yield (kg ha-‐1)for 2009 . α Rowan county mean soybean yield (kg ha-‐1) for 2009. Mean soybean
Figure 1.4 Mean dry matter biomass production for Kinston research stations for 2010. Variety was found to significant predict rye biomass DM production (p<0.001). Contrast of northern and southern rye varieties was found to be significant (p<0.001). Means followed by the same letter are not significantly different based on Fisher’s Protected LSD test at P < 0.05. * Critical rye biomass threshold for weed control.
Figure 1.5 Soybean yield as predicted by soybean stand count and rye biomass production. The planes for both figures are the average soybean yield across each variety. Top figure: Rolldate 1, stand count, biomass and variety were all significant (p<0.001, p<0.07, p<0.05). The contrast north vs south was found significant (p<0.02) and RR+HB vs others was not found to be significant (p<0.44). The WF checks significantly out
yielded the RR+HB checks (p<0.04). Bottom figure: Rolldate 2, stand count, variety and (stand count)2 were
TABLES A
Table 1-‐1 Dates for rye and soybean planting and other field activities for Plymouth, Salisbury and Kinston for 2009-‐2010.
Location & Year
Rye Planting
Roll Kill, Soybean Planting, & Pre-‐emergent
weed control
Percent Kill Stand Counts
Weed Densities
Rolldate 1 2 1 2 1 2 1 2
2008-‐2009
Plymouth Oct-‐3 May-‐
13 May-‐29 May-‐27 Jun-‐12 Jun-‐10 Jun-‐26 . Aug-‐12 Salisbury Sept-‐25 May-‐
21 Jun-‐2 Jun-‐4 Jun-‐16 Jun-‐18 Jun-‐30 . Aug-‐11
2009-‐2010
Kinston Oct-‐28 May-‐ 6
May-‐ 13
May-‐ 20
May-‐ 27
Jun-‐ 3
Jun-‐ 10
Jun-‐ 3
Table 1-‐2 Termination (Roll-‐kill) times for rye (Secale cereal L.) cover crops in the Southeastern US.
Maturity Time* Cultivar Habit
Early Late April Wrens Abruzzi Spring
Wrens 96 Spring
Maton II Spring
Mid Early May Aroostook Winter
Late Mid to Late May Rymin Winter
Wheeler Winter
Table 1-‐3 Mean percent kill of six rye cultivars stands for two roll-‐dates two weeks after planting.
2009 2010
Location Plymouth Salisbury Kinston
Rolldate 1 Maturity Growth
Stage Kill % Growth Stage Kill % Growth Stage Kill %
Maton II Early 11.2 100 11.2 100 11.2 97.5
Wrens 96 Early 11.2 100 11.2 100 11.2 100
Wrens Abruzzi Early 11.2 100 11.2 100 11.2 98.5
Aroostook Late 11.2 100 11.2 100 11 65
Rymin Late 11.2 100 11.1 25 10.54 27.5
Wheeler Late 11.2 100 11.1 67.5 10.54 20
Rolldate 2
Maton II Early 11.3 100 11.4 100 11.3 100
Wrens 96 Early 11.3 100 11.3 100 11.3 100
Wrens Abruzzi Early 11.3 100 11.3 100 11.3 100
Aroostook Late 11.3 100 11.4 100 11.2 100
Rymin Late 11.3 100 11.2 100 11.1 75
Wheeler Late 11.3 100 11.2 100 11.1 60
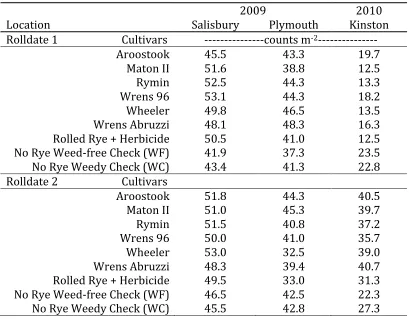
Table 1-‐4 Mean stand count (counts m-‐1) for soybeans planted into six rye cultivars for two different roll dates. Stand counts were taken approximately one-‐month after planting.
2009 2010
Location Salisbury Plymouth Kinston
Rolldate 1 Cultivars -‐-‐-‐-‐-‐-‐-‐-‐-‐-‐-‐-‐-‐-‐-‐counts m -‐2-‐-‐-‐-‐-‐-‐-‐-‐-‐-‐-‐-‐-‐-‐-‐
Aroostook 45.5 43.3 19.7
Maton II 51.6 38.8 12.5
Rymin 52.5 44.3 13.3
Wrens 96 53.1 44.3 18.2
Wheeler 49.8 46.5 13.5
Wrens Abruzzi 48.1 48.3 16.3
Rolled Rye + Herbicide 50.5 41.0 12.5
No Rye Weed-‐free Check (WF) 41.9 37.3 23.5
No Rye Weedy Check (WC) 43.4 41.3 22.8
Rolldate 2 Cultivars
Aroostook 51.8 44.3 40.5
Maton II 51.0 45.3 39.7
Rymin 51.5 40.8 37.2
Wrens 96 50.0 41.0 35.7
Wheeler 53.0 32.5 39.0
Wrens Abruzzi 48.3 39.4 40.7
Rolled Rye + Herbicide 49.5 33.0 31.3
No Rye Weed-‐free Check (WF) 46.5 42.5 22.3
No Rye Weedy Check (WC) 45.5 42.8 27.3
Table 1-‐5 Soybean post canopy closure weed coverage for Kinston 2010. Weed data for Salisbury and Plymouth 2009 not present due to excellent control in all treatments.
Post Canopy Closure
Grasses Broadleaves
Roll Date 1 Treatments -‐-‐-‐% coverage-‐-‐-‐ B
Weedy Check (WC) 63.3 a 24.9 a
Aroostook 28.7 b 9.7 c
Maton II 16.5 b 9.2 c
Wheeler 19.1 b 8.7 c
Wrens Abruzzi 29.3 b 10.8 c
Wrens 96 36.9 b 12.5 c
Rymin 20.2 b 17.9 bc
Roll Date 2 Treatments -‐-‐-‐% coverage-‐-‐-‐
Weedy Check (WC) 51.7 a 25.2 a
Aroostook 13.5 b 4.4 b
Maton II 9.1 b 5.4 b
Wheeler 13.8 b 3.4 b
Wrens Abruzzi 10.3 b 3.2 b
Wrens 96 13.0 b 5.6 b
Rymin 8.9 b 9.9 b
Table 1-‐6 Rolldate 1 models predicting soybean yield for Kinston 2010.
ANOVA
Terms AICC AIC BIC Estimate Pr > F
Model 1* 258.9 257.9 257.5
Intercept -‐17.86 0.1991
Stand Count 1.05 0.001
Biomass 0.003 0.07
Variety . 0.05
Model 2 297.7 297.3 269.9
Intercept 23.57 0.05
Stand Count 0.56 0.10
Biomass 0.0004 0.65
Model 3 245.6 244.9 244.5
Intercept -‐44.35 0.03
Stand Count 2.28 < 0.001
Biomass 0.004 0.03
Variety . 0.04
Stand Count * Variety . 0.592
*Model I was chosen to predict yield in Figures 1-5 Top.
Table 1-‐7 Rolldate 2 models predicting soybean yield for Kinston 2010.
ANOVA
Terms AICC AIC BIC Estimate Pr > F
Model 1* 262.4 261.9 261.5
Intercept -‐143.76 0.21
Stand Count 8.22 0.066
Biomass 0.0044 0.11
Variety . 0.035
(Stand Count)2 -‐0.12 0.058
Model 2 261.5 261.0 260.5
Intercept 17.32 0.60
Stand Count -‐065 0.14
Biomass 0.0046 0.10
Variety . 0.027
Model 3
Intercept 275.3 274.8 274.3 101.88 0.19
Stand Count -‐2.96 0.086
Biomass -‐0.0046 0.083
Variety . 0.025
Stand Count * Biomass 0.00025 0.24
Table 1-‐8 Mixed-‐model analysis of variance of soybean yield from Kinston 2010 as determined by rye cultivar, roll-‐kill date along with contrast statements.
Fixed Effects F-‐value P value
Cultivar 0.74 0.60
Roll-‐Kill Date 11.22 0.03
Roll-‐Kill Date x Cultivar 0.43 0.82
Rolldate 1 Rolldate 2
Contrast -‐-‐-‐-‐-‐-‐-‐-‐-‐-‐-‐-‐-‐-‐-‐p value-‐-‐-‐-‐-‐-‐-‐-‐-‐-‐-‐-‐-‐-‐-‐
RR+HB vs Six Rye Cultivars 0.33 0.032
WF vs RR+HB 0.039 0.54
Chapter 2:
Effects of rye cover crop mulches on nitrogen dynamics
in soybean.
INTRODUCTION
A potential weed management practice that is in the early stages of adoption by organic soybean producers is the use of roll-killed cover crops. This system utilizes a roller-crimper implement immediately prior to planting of a cash crop to kill the mature cover crop, thereby producing a weed suppressive mulch (Davis 2010). Cover crop mulch suppresses weeds by both physical and chemical mechanisms. Physical impedance and light deprivation are major mechanisms of controlling weed emergence in mulched systems (Teasdale and Mohler, 2000) with varying estimates of the importance of allelopathic chemicals from rye shoots (Kruidhof et al. 2009, Reberg-Horton et al. 2005, Putnam and DeFrank, 1983). Both physical and chemical weed control mechanisms are dependent on cover crop biomass. Smith et al. (2011) demonstrated excellent weed control in organic soybeans when roll-till rye biomass levels reached 9000 kg ha-1. The level of weed
suppression directly depends on the quantity of rye mulch, with an exponential relationship between mulch mass and weed emergence (Teasdale and Mohler, 2000).
interactions have been well characterized, with high C:N residues causing rapid N
immobilization that affects both crops and weeds (Silgram and Chambers 2002, Recous et al. 1995, Burgess et al. 2002, Schomberg et al. 1994, Jin et al. 2008). Less is known about the effect of surface residues on N immobilization in agricultural systems.
The impact of surface residues on soil N dynamics has been relatively well studied mainly in forestry systems. Hart et al. (1993) hypothesized that N transfer from soil to decomposing surface litter increases in ecosystems which have accumulations of high C:N ratio litter on the soil surface. Nitrogen transfer from soil to surface litter could account for all of the N-immobilized in this layer during the first year of decomposition (Hart and Firestone, 1991). To further support the significance of surface residues on
N-immobilization, Jaeger et al. (1999) showed unchanged, net microbial N-immobilization throughout the summer in the surface soil, and then rapid increases in September after the forest leaf canopy senescence. Analogous N-immobilization effect was demonstrated when
Theobroma grandiflorum, and Triticum aestiavum both high C:N ratio litter, were applied to soil surfaces (Holland and Coleman, 1987; Schewendener et al., 2005). Similar
N-immobilization effects should be expected in agricultural systems with high C:N surface residues.
pigweed) progressively improves as N rate increases (Blackshaw and Brandt 2008). Increasing levels of nutrient availability strongly influences reproductive performance of
Senna obtusifolia (sicklepod) along with increased leaf area and plant biomass (Tungate 2002).
Our goals of this study were to investigate the effect of high C:N cover crop rye surface residue application on soil inorganic and plant available nitrogen, and to determine the weed and crop response to possible low-nitrogen environments.
MATERIAL AND METHODS
In 2009 and 2010, a field experiment was performed at the Center for
Environmental Farming Systems (CEFS) in Goldsboro, NC and Kinston Research Farm
in Kinston, NC. The soil type in Goldsboro for 2009 was Wickham loamy sand (Fine-‐
loamy, mixed, semiactive, thermic Typic Hapludults) with 2-‐6% slope, and the soil types
in Kinston for years 2009 and 2010 were Johns loamy sand (Coarse-‐loamy, siliceous,
semiactive, thermic Aeric Paleaquults) with 0-‐2% slope and Kenansville loamy sand
(Loamy, siliceous, subactive, thermic Arenic Hapludults) with 0-‐3% slope.
The experiment was a randomized complete block design with six replicates.
Treatments consisted of: rolled rye (RR) with no additional weed control measures,
conventionally tilled (CT) with herbicide based weed control, and conventionally tilled
with no weed control measures (weedy check). In 2010 a fourth treatment, rolled rye
plus herbicides (RR + HB) was added to further dissect the interaction between weeds
and soil N levels. The 2009 plots were part of a larger experiment (Smith et al. 2011)
Prior to winter rye planting both locations were disked and field cultivated to
remove any existing vegetation. Lime, phosphorus, and potassium were applied
according to soil tests prior to rye planting. To ensure adequate nitrogen fertility for
the rye cover crop, both Goldsboro (2009) and Kinston (2009 and 2010) received
approximately 30 kg-‐N ha-‐1 prior to fall planting. In addition, Kinston received top
dressed urea ammonium nitrate at 55 kg ha-‐1, whereas Goldsboro received manure
compost with a nitrogen equivalent of 56 kg ha-‐1 prior to jointing in the spring.
The plot size at both locations was four rows wide (76 cm row spacing) by 15
meters long. Prior to planting in the fall, all fields were disked and field cultivated. Rye
(Secale cereale L. ‘Rymin’) was subsequently no-‐till drilled with 14 cm spacing between
rows as a cover crop at a rate of 134 kg ha-‐1. In both years, the rye was drilled
perpendicular to the soybean planting and rye roll-‐kill direction. In mid-‐May, the rye
cover crop was roll-‐killed (Feekes growth stage 11) with a 3.1 m chevron roller
crimper. After the rye cover crops were terminated via the roller/crimper, soybeans
(Glycine max L. ‘Hutcheson’), maturity group V, were immediately planted using a
Monosem no-‐till planter parallel to the roller crimper direction at 370,500 live seed ha-‐
1. Before the soybean harvest in mid-‐October, plots were trimmed to minimize any
potential edge effect. Soybean yield data were collected on the two middle rows.
Weed control methods varied between the two locations. At Goldsboro,
conventional weed free checks were treated with clove oil applied 6 WAP as a directed
under canopy in-‐row spray at 18.7 liters a.i. ha-‐1 (10% concentration). At Kinston,
emergent at a rate of 74.7 g a.i. ha-‐1, and s-‐metolachlor applied at planting for pre-‐
emergent weed control at a rate of 1.91 kg a.i. ha-‐1. Hand weeding was done as needed
to ensure weed free conditions at both locations.
Crop parameters of interest included soybean stand counts, rye biomass, weed densities, soybean and pigweed (Amaranthusspp.) tissue percent nitrogen, and soybean yield. Stand counts were taken twice during the season at 4 and 6 WAP 1 meter of soybean row. Rye biomass was collected using 0.5 m2 quadrats. The fresh rye biomass was then dried at 60°C for 72 hours and dry weights recorded. Weed density data were gathered during late summer on all plots by counting above canopy weeds in the two middle soybean rows (20.9 m2). Soybean and pigweed tissues were collected at 2-week intervals after
planting on a randomly selected 1 m row of soybeans, or on 0.5 m2 area basis for pigweed. The dried and ground plant tissue was analyzed on PerkinElmer Series II CHNS/O 2400 for percent carbon and nitrogen. Using a small plot combine, soybean yield was measured in late fall from 12.2 m of the two center rows in each plot.
The soil parameters of interest were soil extractable inorganic nitrogen, plant available nitrogen, soil temperature, and soil moisture. Composite soil samples were taken from two depths, shallow (0-10.2 cm) and deep (10.2-25.4 cm). Soil inorganic nitrogen (NO
-3-N and NH+4-N) was extracted and analyzed on a Quick Chem 8000 Lachat according to the
Inc. protocol (Western Ag Innovations Inc. 2007). To prevent root competition, PRS-probes were installed in 10 cm diameter Root Exclusion Cylinders made of PVC pipe. Soil
temperature and gravimetric soil moisture were recorded at planting and every 2 weeks afterwards for a duration of 8 weeks.
A combined analysis was attempted on the three trials, but significant treatment by environment interactions prevented a pooled analysis. Weed densities were log transformed for analysis and means were back transformed for presentation and repeated measures utilized. Each site was analyzed separately with proc MIXED. Within each site, treatments were fixed and blocks were random effects (SAS 2010).
RESULTS AND DISSCUSSION
Soil inorganic nitrogen and plant available nitrogen as affected by rye residue.
At roll-kill, the initial extractable soil inorganic nitrogen and plant available nitrogen levels (i.e. probe N) were significantly lower among rolled-rye (RR) and rolled-rye plus herbicides (RR+HB) when compared to conventional tilled (CT) plots at two of the three site-years, Kinston 2009 and 2010. There was no detectable difference of both soil inorganic N and plant available N between RR and RR+HB (Figure 2-2). The trend of reduced initial soil inorganic-N and plant available-N in the RR and RR+HB plots was observed in Kinston during 2009 and 2010. In Kinston at the shallow sampling depth, initial soil inorganic-N concentration for CT and RR were 8.5 kg ha-1 and 4.1 kg ha-1 in 2009, respectively, and 14.1 kg ha-1 and 3.1 kg ha-1 in 2010 (Figure 2-2). Rye has been shown to be an excellent
lower levels of soil inorganic N when compared with legume monocultures (Ranells and Wagger, 1997). A primary mechanism responsible for rye’s scavenging abilities is it fibrous and extensive root system. Generally, a rye cover crop has 20% to 30% of its total dry matter in roots. Depth of these fibrous roots, paired with high root density, is known to increase roots ability to scavenge and sequester soil inorganic-N (Meisinger et. al,
1991). The amount of rye residue that is generally recommended for the roller-crimper system is greater than 9,000 kg ha-1 (Smith et al. 2011). Such high mulch levels would mean substantial levels of soil N are typically scavenged and accumulated into rye biomass in this system.
Results show that at all 3 sites soil inorganic-N remained lower and more consistent in the RR and RR+HB plots throughout the season (Figure 2-2). Upward spikes in soil-N availability were observed in CT plots in response to wetting and drying cycles. These spikes are typical in soil nitrogen data sets (Lundquist, 1999; Coppens et al., 2006; Burgess et al., 2002; Frey et al., 1999) as microbial biomass increases with moisture and increasing mineralization rates as microbes decompose soil organic matter. The continued low N in the RR plots suggests portions of carbon rich rye residue was being decomposed and prevented the N-mineralization seen in the CT plots.
The lack of initial extractable soil N treatment differences in Goldsboro 2009 may be attributed to high soil temperatures coupled with low soil moistures (data not
treatments in soil inorganic-N from shallow depths two weeks after planting (Figure 2-2); an increase in soil inorganic-N was observed in the deeper 10-25 cm fraction in the CT
treatments (Figure 2-2). This increase of soil inorganic-N in the deep profile is likely the result of a series of rain events occurring 0 and 2 WAP that leached inorganic nitrogen into the lower soil profile.
Several rye biomass factors are possibly contributing to the observed
N-immobilization. Even though rye roots account for 20-30 percent of the overall rye biomass, their carbon to nitrogen ratios (mature rye roots) range from 22 to 28, much lower than the C:N ratios of the rye surface residue 60-80:1; indicating that rye roots are likely to contribute minimally to soil inorganic N immobilization (Malpassi, R.N. et al., 2000). However, easily soluble carbon can contribute to bacteria driven N immobilization by leaching from the rye shoots on the surface into the soil profile (Cochran et al., 1980). Another proposed
Soybean and Pigweed C:N Ratios
At both locations during 2009 and 2010, soybean tissue C:N ratios were higher in the RR and RR+HB plots for the first 6 weeks but converged by week 8 (Figure 2-4). This time frame, growth stage V2-V3, corresponds with soybean nodules beginning N-fixation,
suggesting that beyond week six the soybeans were sufficiently meeting their N requirements through N-fixation. Nitrogen deprivation in soybeans can reduce biomass production prior to nodulation (Heckman and Kluchinski, 1995), but the lack of difference in yields between RR+HB and the CT plots suggest the low soybean N state in that system for the first six weeks had limited impact on crop development.
Pigweeds suffered a more severe response in N deprivation than the soybeans. At both Goldsboro and Kinston during 2009, pigweed C:N ratios continued to diverge between the two treatments (CT and RR) over the eight week sampling period (Figure 2-5).
Comparable N deprivation in other weed species can reduce shoot biomass, seed number, and total seed mass and as a result, the offspring were found to be less competitive in low-nitrogen environments (Tungate 2006).
These effects could play an important role in determining weed-crop competitive outcomes. The role of N in weed-crop competition has been largely studied in non-N fixing cropping systems (Henson and Jordan 1982; Supasilapa et al. 1992, Blackshaw et al.,
2003). In the current study, the RR plots had sustained lower soil inorganic-N levels ranging from 3.0 kg ha-1 to 7.0 kg ha-1 throughout the season when compared to the CT plots. In the nitrogen-constrained RR plots, it may be possible to exploit the N responsiveness of some weed species during the critical period of weed competition. Species having the highest growth rates in fertile environments can be the most sensitive to suboptimal nutrient
from soybeans to weeds, transfer of N is very low in weed species such as pigweed that are known to be non-hosts for arbuscular mycorrhizae (Moyer-Henry et al., 2006). The low soil inorganic-N in the RR plots could restrict the growth of weed species such as pigweed during the critical weed-free period (Eyherabide et al., 2002), between 2 and 7 weeks after
emergence, thus reducing weed-crop competition. During this time frame, soil inorganic-N in the RR plots was constantly lower than 7.0 kg ha-1 for all 3 sites. Four weeks after planting the soil inorganic-N in RR and RR+HB plots at Kinston 2009 and 2010 continued to decline while pigweed C:N ratios showed increasing signs of N deprivation.
Weed Control and Soybean Yield
Weed control in the RR plots varied between locations and years. The predominant weed at both locations was pigweed with the weedy check plots ranging 1-29 plants m-2
CONCLUSION
Although the three site years had varying rye biomass, the RR system created an extremely low N environment that affected N content in both pigweed and soybeans prior to nodulation. Soil N was suppressed throughout the season for both soybeans and pigweeds in the RR+HB plots yet we observed no detectable soybean yield loss. This suggests that when a cereal cover crop is paired with a legume cash crop, reduced weed crop interference may result, with little reduction in soybean yield. Further research is needed to determine the extent to which the low N environment is contributing to weed management in the RR system.
REFERENCES
Ashford, D.L., and Reeves, D.W. 2003. Use of a mechanical roller-crimper as an alternative kill method for cover crops. American Journal of Alternative Agriculture.
vol. 18, 1:37-45.
Berg, B. and Dise, N. 2004. Calculating the long-term stable nitrogen sink in northern European forests. Acta Oecologica 26:15–21.
Blackshaw, R. E. 2004. Application method of nitrogen fertilizer affects weed growth and competition with winter wheat. Weed Biology and Management 4, 103–113. Burgess, M. S., Madramootoo, C.A., and Mehuys, M. S. 2002 Nitrogen Dynamics of
Decomposing Corn Residue Components Under Three Tillage Systems. Soil Science Socitey of America Journal 66 pp. 1350—1358.
Cochran, V.L., Elliott, L.F., and Paperndick, R.I. 1980. Carbon and nitrogen movement from surface-applied wheat (Triticum asetivum) straw. Soil Sci. Soc. Am. J.44:978— 982
.