Sharif University of Technology
Scientia Iranica
Transactions C: Chemistry and Chemical Engineering
www.sciencedirect.com
Catalytic methanation reaction over supported nickel–ruthenium
oxide base for purification of simulated natural gas
W.A.W. Abu Bakar
∗,
R. Ali
,
S. Toemen
Department of Chemistry, Faculty of Science, Universiti Teknologi Malaysia, 81310 UTM Skudai, Johor, Malaysia
Received 12 January 2011; revised 26 April 2011; accepted 5 November 2011
KEYWORDS
Nickel oxide; Ruthenium oxide; Catalyst; Methanation; Natural gas.
Abstract The presence of carbon dioxide and water molecules as impurities in crude natural gas decreases the quality of natural gas. Recently, the catalytic treatment of this toxic and acidic gas has become a promising technique by converting CO2to methane gas in the presence of H2S gas; thus, enhancing
methane production and creating an environmentally friendly approach to the purification of natural gas. A series of catalysts based on nickel oxide were prepared using the wetness impregnation technique and aging, followed by calcination at 400°C. Pd/Ru/Ni(2 : 8 : 90)/Al2O3catalyst was revealed as the most
potential catalyst, and achieved 43.60% of CO2conversion, with 6.82% of methane formation at 200°C. This
catalyst had the highest percentage of 52.95% CO2conversion and yielded 39.73% methane at a maximum
temperature of 400°C. In the presence of H2S in the gas stream, the conversion dropped to 35.03%, with
3.64% yield of methane at a reaction temperature of 400°C. However, this catalyst achieved 100% H2S
desulfurization at 140°C and remained constant until the reaction temperature of 300°C. Moreover, the XRD diffractogram showed that the catalyst is highly amorphous in structure, with a BET surface area in the range of 220–270 m2g−1. FESEM analysis indicated a rough surface morphology and non-homogeneous
spherical shape, with the smallest particles size in the range 40–115 nm.
©2012 Sharif University of Technology. Production and hosting by Elsevier B.V.
1. Introduction
Nickel based catalysts are generally considered reference methanation catalysts and are known to eliminate H2S by a
desulfurization process. According to Jose et al. [1], nickel oxide exhibits high activity and selectivity for producing methane, due to the ability of NiO to undergo the reduction process owing to the presence of a defect site on the surface of NiO. It had also been reported that NiO has a bimodal pore structure, which entails high activity for CO2 methanation [2]. This bimodal
pore structure will serve as an optimum pore size for the adsorption of both reactants. The strength of adsorption on nickel has ‘intermediate’ binding energies for hydrogen. It also has ‘intermediate’ values of heat of adsorption. Souma et al. [3], showed that the methanation reaction seems to be accelerated
∗Corresponding author. Tel.: +60 13 7466213.
E-mail address:wanazelee@yahoo.com(W.A.W. Abu Bakar).
by the absorption of H2on metallic nickel. Yamasaki et al. [4]
found that an amorphous alloy of Ni–25Zr–5Sm catalyzed the methanation reaction, with 90% conversion of CO2 and 100% selectivity towards CH4at 300°C.
Noble metals such as rhodium, ruthenium, platinum and palladium, exhibit s promising CO2
/
H2 methanationperfor-mance, high stability and less sensitivity to coke deposition. Finch and Ripley [5] claimed that the noble metal promot-ers may enhance the activity of the catalysts to increase the conversion to methane. In addition, noble metal promoted catalysts maintained greater activity for methane conversion than non-promoted catalysts in the presence of sulfur poison. Kusmierz [6] found that ruthenium catalysts are highly selec-tive towards methane, even if supported on Al2O3. The main
products of the reaction were CH4and water. Traces of carbon
monoxide were present among the product, too, but methanol was completely absent. However, Takeishi and Aika [7] who studied Raney Ru catalysts, found a small amount of methanol was produced on supported Ru catalyst, but the production of methane gas was thousands of times more than the amount of methanol from CO2hydrogenation.
Research done by Miyata et al. [8] revealed that the addition of Pd and Pt noble metals drastically improved the behavior
Peer review under responsibility of Sharif University of Technology.
1026-3098©2012 Sharif University of Technology. Production and hosting by Elsevier B.V.
doi:10.1016/j.scient.2012.02.004
Open access under CC BY-NC-ND license.
of Ni
/
Mg(
Al)
O catalysts. The addition of noble metals on Ni resulted in a decrease in the reduction temperature of Ni and an increase in the amount of H2 uptake on Ni onthe catalyst. Panagiotopolou and Kodarides [9] found that the platinum catalyst is inactive in the temperature range of 200–400°C, since temperatures higher than 450 °C are required in order to achieve conversion above 20%. Erdohelyi et al. [10] studied the hydrogenation of CO2 on Rh
/
TiO2. Therate of methane formation was unexpectedly higher in the CO2
+
H2 reaction on Rh/
TiO2 in the presence of H2S. Athigher temperatures of 400°C, around 75% selectivity for CH4
formation and CO was also formed from the reaction. The selection of support is considered as important, since it may influence both the activity and selectivity of the reaction. It has also been discovered that the addition of alumina may increase methanation activity, despite the presence of low concentrations of H2S [11]. Therefore, Al2O3is selected as the
support for all studied catalysts in this research.
Since the catalytic process through methanation reactions offers the best way to remove CO2in natural gas, the present
study is to develop a catalyst based on nickel oxide by modifying the dopants using noble metals in order to fully remove this CO2 gas at the highest conversion percentage possible at low
temperatures. The addition of noble metals was studied, aiming to understand the effect of the presence of noble metals on the Ni catalyst, towards better catalytic performance.
2. Experimental
2.1. Chemicals and reagents
Nickel nitrate hexahydrate, with a chemical formula of Ni
(
NO3)
2·
6H2O, produced by GCE Laboratory Chemicals, wasused as the base in this research. Meanwhile, ruthenium(III) chloride hydrate
(
RuCl3·x
H2O)
, palladium(II) nitrate hydrate(
Pd(
NO3)
2·x
H2O)
and tetraamineplatinum nitrate((
NH3)
4Pt
(
NO3)
2)
, produced by Sigma Aldrich Chemical, rhodium(III)nitrate hydrate
(
Rh(
NO3)
3·x
H2O)
from Fluka Analytical,cop-per(II) nitrate hexahydrate
(
Cu(
NO3)
2·
6H2O)
fromRiedel-de-Haën and manganese acetate tetrahydrate Mn
(
CH3COO)
2·
4H2Ofrom Rinting Scientific, were used as dopants. In addition, alu-minium oxide beads
(
Al2O3)
produced by MERCK Eurolab, andphotocatalytic ceramic beads (SiO2
/
TiO2) produced by TitanPE Technology Inc., were used as the support materials for the preparation of catalysts. Polyethylene glycol 2000, with a chemical formula of H
(
OCH2CH2)n
OH (Fluka Chemicals), anddiethanolamine, with a chemical formula of HN
(
CH2CH2OH)
2(Merck-Schuchardt), were used for sol–gel preparation.
2.2. Catalyst preparation
All catalysts were prepared by the aqueous incipient wetness impregnation method. The nickel loading used was 90 wt% 3 g of Ni
(
NO3)
2·
6H20 was dissolved in a small amountof distilled water, then mixed together with a solution of noble metal chloride salts or nitrate salts in a beaker, according to the desired ratio. A homogeneous mixture was obtained by magnetic stirring at room temperature for 30 min. For catalysts coated using a noble metal chloride precursor, the metal chloride salt was stirred in doubly distilled water and dispensed. This process was repeated several times until there were no changes occurring in the catalyst solution after AgNO3
was added. This indicated that the chloride ion was completely removed. Al2O3 alumina beads with diameter of 4–5 mm
Figure 1: Schematic diagram of home-built micro reactor used for catalytic activity measurement.
were used as support material in this study. The support was immersed into the catalyst solution for 24 h and the supported catalysts were transferred onto an evaporating dish with glass wool on it. It was then aged inside an oven at 80–90°C for 24 h to remove water and allow the well homogenized immobilization of the catalysts on the surface of the supported material. It was then followed by calcination in the furnace at 400 °C for 5 h, using a ramp rate of 10°C
/
min, to further eliminate all metal precursors and any excess of water or impurities. A similar procedure was repeated for other ratios of the catalyst. Finally, the potential catalysts were studied in detail on various optimization parameters.2.3. Catalytic activity measurement
The supported catalyst sample was packed into a cylindrical glass tube with diameter of 10 mm and length of 360 mm, and was stored in the furnace of the home-built micro-reactor, as shown inFigure 1. No pretreatment was done prior to beginning the heating experiment. In-situ reactions of methanation and desulfurization were performed from ambient temperature up to 300°C, with an increment temperature rate of 5 °C
/
min. Each experiment was repeated twice, and each treatment temperature was maintained for 30 min before the next temperature increment was accomplished. It was found that catalytic activity on the second treatment did not differ significantly. Composition of the reactant gases in comparison with the real composition of sour gases in Malaysian crude natural gas is depicted inTable 1. The mixture of CO2and H2gases was introduced into the reactor system in a stoichiometric ratio of 1:4. The product gas coming out from the furnace was collected in a FTIR sample cell and scanned at every 20°C by a FTIR Shimadzu 8300 Spectrometer. Percentage conversion of CO2 and H2S was obtained by calculating the peak area
of their respective stretching bands relative to the peak area of the gas during calibration without a catalyst. Off line GC analysis (Hewlett Packard 6890 Series GC System) was done to determine the yield of CH4gas, due to the low sensitivity of FTIR
spectroscopy towards the stretching band of CH4.
2.4. Catalyst characterization
Table 1: Flow gas mixture and chemical composition of crude natural gas from Telaga Bergading, Petronas Carigali Sdn. Bhd., analyzed by GC-MS.
Gas Flow gas mixture (%) Composition in crude natural gas (%)
CH4 – 47.0
CO2 19.0 23.5
H2S 4.8 5.4
Others (CO, O2,N2) – 24.1
H2 76.2 –
To assess the surface by FESEM-EDX analysis, the samples were analyzed using Zeiss Supra 35 VP FESEM with the energy of 15.0 kV, coupled with the EDX analyzer and 1500
×
magnification. Prior to analysis, the sprinkled sample was coated with gold, as a conducting material, by gold sputter, at 10−1Mbar, using the Bio Rad Polaron Division SEM coating system machine. The catalyst sample was bombarded by an electron gun, with a tungsten filament, under 25 kV resolution. The N2adsorption/desorption isotherm of the catalyst analyseswas obtained using a Micromeritics ASAP 2010 volumetric adsorption analyzer at
−
196°C. Prior to measurement, the calcined catalysts were degassed at 200 °C, overnight. The isotherms were used to determine the following parameters: surface area (using Brunauer–Emmett–Teller (BET) equation), total pore volume, total micropore volume, and total mesopore volume. TGA analysis for the samples was carried out by a TGA-SDTA 851 Mettler Toledo simultaneous thermal analyzer, up to 800°C at 15°C/
min. The sample in the form of fine powder was placed in an alumina covered crucible, an empty crucible being the reference. Nitrogen gas, with a flow rate of 50µ
L/
min, was used as the atmosphere.3. Results and discussion
3.1. Catalytic performance of supported NiO based catalyst with ruthenium as a first dopant
Table 2illustrates the catalytic performance of supported
nickel oxide based catalysts, which were calcined at 400°C for 5 h. According to the results, a Ni
/
Al2O3 catalyst gives only24.58% conversion of CO2at a reaction temperature of 400°C.
Incorporating ruthenium into this catalyst further lowered the catalytic performance towards CO2 conversion to 7.21%.
The decreasing performance of this catalyst could be due to the Ru precursor; RuCl3
.
nH2O used in this study. This is ingood agreement with Nurunnabi et al. [12], who found that the small amount of chloride ion in the Ru
/
Al2O3 catalystcould lead to a decrease in the active sites of the Ru catalyst surface. The presence of residual chloride ions forms a partition between the support and the metal, and therefore inhibits both CO and hydrogen chemisorption phenomena on the catalyst surface [12].
However, the addition of palladium into the Ru
/
Ni(
10:
90)/
Al2O3 catalyst to form Pd/
Ru/
Ni(
2:
8:
90)/
Al2O3 catalystcoincidentally enhanced catalytic activity for the conversion of CO2 of the prepared catalysts. It showed 37.94%, 43.60%
and 45.77% of CO2 conversion at reaction temperatures of
100 °C
,
200 °C and 300 °C, respectively, while 52.95% CO2conversion was achieved at the maximum studied temperature of 400°C. This suggests that small amounts of Pd addition can play an important role in the improvement of catalyst activity. This is in accordance with the findings of Baylet et al. [13] who studied the catalytic activity and stability of Pd doped
Table 2: Percentage conversion of CO2from methanation reaction over
various alumina supported nickel oxide based catalysts with ruthenium as a dopant and co-dopant.
Alumina supported catalysts Reaction temperature
100°C 200°C 300°C 400°C
% conversion of CO2
Ni(100%)/Al2O3 6.35 10.86 18.15 24.58
Ru/Ni(10:90)/Al2O3 1.26 1.89 3.94 7.21
Pd/Ru/Ni(2:8:90)/Al2O3 37.94 43.60 45.77 52.95 Pt/Ru/Ni(2:8:90)/Al2O3 10.75 18.03 32.33 34.74
Rh/Ru/Ni(2:8:90)/Al2O3 3.23 5.67 11.00 19.29
Ru/Mn/Ni(2:8:90)/Al2O3 7.74 22.19 26.31 34.86
Ru/Cu/Ni(2:8:90)/Al2O3 14.62 24.02 24.88 25.87
Ru/Pd/Ni(2:8:90)/Al2O3 17.30 22.58 28.77 35.64
hexaaluminate catalysts for the CH4catalytic combustion. They
found that the addition of palladium to the alumina support material gives a sufficient absorption for the CO2 dissociation
process, which is due to the increasing of active sites created on the catalyst surface.
When platinum was added into the Ru/Ni catalyst, the Pt
/
Ru/
Ni(
2:
8:
90)/
Al2O3 catalyst did not perform well, andmanaged to convert only 34.74% at the maximum reaction temperature, 400°C, while at 200°C, the conversion of CO2
was around 18.03%. Bi et al. [14] reported that the Pt catalyst is generally effective for the Reverse Water–Gas Shift (RWGS) reaction. It can be seen fromTable 2that the result of Ru/Ni doped with Pt was not as good as Ru/Ni doped with Pd. It showed that Pd is better than Pt. Our finding was in agreement with Lapisardi et al. [15] who revealed that the conversion rate of the Pd catalyst was four times higher than that of the Pt catalyst for the production of syngas. As previously reported by Gelin et al. [16], Pd
/
Al2O3did not exhibit any deactivationwith time, on stream, under experimental conditions, but Pt
/
Al2O3slowly deactivates with time. The decreasing activityof this catalyst is mostly due to the sintering of Pt particles, exaggerated by local hot spots, owing to the highly exothermic CO2methanation reaction, which is responsible for the loss of
Pt dispersion [17].
The presence of rhodium in the Rh
/
Ru/
Ni(
2:
8:
90)/
Al2O3catalyst was even worse, with poor activity and selectivity in comparison to Ni
/
Al2O3. Only 19.29% CO2 conversion wasobserved under similar experimental conditions, even at the highest reaction temperature of 400°C. These findings might be explained by the fact that the addition of Rh in this catalyst caused poor metal dispersion. This was also reported by Wachs [18], and the reason given was due to the poor interaction between active basic metal oxide and the support material. Thus, the metals are easily migrated and sintered to form large metal particles [19], leading to the agglomeration on the surface of the catalyst, which will reduce the degree of dispersion. Furthermore, when Ru was added into the Mn
/
Ni/
Al2O3catalyst to form the Ru/
Mn/
Ni(
2:
8:
90)/
Al2O3catalyst, it did not show good performance in its catalytic activity, which only gave 22.19% and 34.86% of CO2conversion
at reaction temperatures of 200 °C and 400°C, respectively. Meanwhile, the CO2 conversion of Ru
/
Cu/
Ni/
Al2O3 catalystwith a ratio of 2:8:90 gave no more than 25.87% of conversion, even at the maximum reaction temperature of 400°C.
Pd and Ru are a good combination for Ni based catalysts only when the ratio of Ru is higher than that of Pd. It can be observed
fromTable 2that only 35.64% of CO2conversion was obtained
at the reaction temperature of 400°C for the Ru
/
Pd/
Ni(
2:
8:
90)/
Al2O3 catalyst compared to the Pd/
Ru/
Ni(
2:
8:
Figure 2: Catalytic performance of CO2conversion from methanation reaction
over Pd/Ru/Ni/Al2O3catalyst calcined at 400°C for 5 h with various loading of
nickel: (i) 90 wt% (Pd/Ru/Ni(2:8:90)/Al2O3), (ii) 80 wt%(Pd/Ru/Ni(5:15:
80)/Al2O3)and (iii) 70 wt%(Pd/Ru/Ni(5:25:70)/Al2O3).
Pd
/
Ru/
Ni(
2:
8:
90)/
Al2O3catalyst is the potential catalystfor CO2 conversion. Generally, the conversion rate of CO2for
all prepared catalysts increased with the increasing of reaction temperature.
Based on the results taken from catalytic activity testing, it was found that Pd
/
Ru/
Ni(
2:
8:
90)/
Al2O3 was thepotential catalyst for CO2 conversion. Several optimization
parameters were conducted on these catalysts including the amount of Ni loading, the calcination temperature of the supported catalyst, the type of support material, method of preparation, H2S testing, reproducibility testing and, finally,
regeneration testing.
3.1.1. Effect of nickel loading
Figure 2compares the amount of Ni loading towards the
percentage CO2 conversion by the Pd
/
Ru/
Ni/
Al2O3 catalyst.The Ni loadings used were 90, 80 and 70 wt%. The catalytic activity of the Pd
/
Ru/
Ni(
5:
25:
70)/
Al2O3 catalyst is onlyslightly lower than that observed on the same catalyst, with Ni loadings of 90 and 80 wt%. The CO2 conversions over
the Pd
/
Ru/
Ni(
5:
25:
70)/
Al2O3catalyst reached their maximumconversions at 400°C, around 32%, and achieved 45.06% for the Pd
/
Ru/
Ni(
5:
15:
80)/
Al2O3 catalyst at the same reactiontemperature. The lowest activity of the Ni catalyst, with the lowest amount of Ni, was due to partial Ni particles located in the pores, thus, leading to lesser active sites for the reduction process, as mentioned by Perkas et al. [20]. From this observation, it can be concluded that the catalytic activity of Ni loading follows a trend in the order of 90 wt%
>
80 wt%>
70 wt%. The selection of metal loading is tremendously important in order to properly balance the activity with selectivity. Then, these catalysts were further analyzed by varying the calcination temperature of the supported catalyst.3.1.2. Effect of different calcination temperature towards sup-ported catalyst
This parameter was investigated to determine the effect of calcination temperature on alumina supported catalyst towards CO2conversion. Pd
/
Ru/
Ni(
2:
8:
90)/
Al2O3catalyst was coatedon alumina and aged in an oven for 24 h before calcined the catalyst at five different temperatures of 300
,
400,
500,
700 and 1000 °C. Figure 3 indicates the trend plot of catalytic activity over Pd/
Ru/
Ni(
2:
8:
90)/
Al2O3 at various calcinationtemperatures.
From Figure 3, it can be observed that the highest CO2
conversion was obtained from the Pd
/
Ru/
Ni(
2:
8:
90)/
Al2O3Figure 3: Catalytic performance of CO2conversion from methanation reaction
over Pd/Ru/Ni(2:8:90)/Al2O3catalyst calcined for 5 h at different calcination
temperatures: (i) 400°C, (ii) 500°C, (iii) 700°C, (iv) 1000°C, and (v) 300°C.
catalyst calcined at 400°C, with 43.60% conversion, followed by the Pd
/
Ru/
Ni(
2:
8:
90)/
Al2O3 catalyst calcined at 500 and700°C, which achieved only 24.1% and 10.36% of CO2
conver-sion at 200°C, respectively. This phenomena could be explained by the drastic increase in calcination temperature, which de-creases the specific surface area of the solids and, thus, cat-alytic activity. This is probably due to the deep encapsulation of sintered noble metal particles, which limit its diffusion by re-ducing the pore size, as stated in the research of Ruckenstein and Hu [21]. As expected, further increase of calcination tem-perature to 1000°C induces the decreasing of catalytic activ-ity over this Pd
/
Ru/
Ni(
2:
8:
90)/
Al2O3 catalyst. However, thePd
/
Ru/
Ni(
2:
8:
90)/
Al2O3catalyst calcined at 300°C achieved35.77% CO2conversion at a reaction temperature of 200°C. It
can be concluded in this research that 400°C was the optimum calcination temperature over the Pd
/
Ru/
Ni(
2:
8:
90)/
Al2O3cat-alyst. In other words, the conversion of CO2over the alumina
supported catalyst in this research, with different calcination temperatures, is in the following increasing order: 400°C
>
300°C>
500°C>
700°C. It was then further optimized by varying the support materials.3.1.3. Effect of different support materials
As the acid or base properties of the support may influence the catalysts, either electronically or structurally, the potential Pd
/
Ru/
Ni(
2:
8:
90)
catalyst calcined at 400 °C was chosen to be supported on various supports, such as alumina beads(
Al2O3),
TiO2/
SiO2 beads and carbon chips from the palmkernel shell in order to compare the compatibility and suitability of the supports towards the catalyst. The comparison of the support effect towards the catalytic performance of the Pd
/
Ru/
Ni(
2:
8:
90)
catalyst is summarized inFigure 4.It could be seen that catalysts on the Al2O3support gave the
highest CO2conversion. It still appeared as the most suitable
support, as it showed a stable performance on CO2conversion.
The carbon support from the palm kernel shell was found to convert 25.54% of CO2at the reaction temperature of 200°C.
Meanwhile, theTiO2
/
SiO2support gives a very low conversionof CO2(4.8%) at 200°C, and achieved a maximum CO2
conver-sion of 17.87% at the maximum studied reaction temperature of 400°C. These results implied that the TiO2
/
SiO2support wasnot appropriate for CO2conversion, as also suggested by
Take-naka et al. [22]. They found that TiO2
/
SiO2supported catalystsFigure 4: Catalytic performance of CO2conversion from methanation reaction
over Pd/Ru/Ni(2:8:90)catalyst with various support materials: (i) Al2O3beads
(ii) TiO2/SiO2beads and (iii) Carbon chips from PKS calcined at 400°C for 5 h.
Figure 5: Catalytic performance of CO2conversion from methanation reaction
over Pd/Ru/Ni(2:8:90)/Al2O3catalyst calcined at 400°C for 5 h testing with
and without the presence of H2S gas.
100% metal oxide dispersion on the SiO2support was obtained,
because of lower reactivity and the higher acidic character of this support. Such properties will decrease its reduction abil-ity of CO2to CH4during catalytic testing. In other words, the
conversion of CO2over Pd
/
Ru/
Ni(
2:
8:
90)
, with differentsup-port, is in the following increasing order: Pd
/
Ru/
Ni(
2:
8:
90)/
Al2O3>
Pd/
Ru/
Ni(
2:
8:
90)/
Carbon>
Pd/
Ru/
Ni(
2:
8:
90)/
TiO2. Further, the catalyst was undergoing other optimization
parameters, which are calcination temperatures of the alumina support.
3.1.4. Effect ofH2Sgas on the alumina supported catalysts
The potential catalysts were further tested for the CO2
methanation reaction in the presence of H2S to check the
durability of the catalysts. In the presence of a sulfur compound in the gas stream, nickel catalysts for CO2 methanation are
easily deactivated. Thus, the toughness of the catalyst towards the H2S attack is an important factor for the practical use
of catalysts, as has been suggested by Habazaki et al. [24].
Figure 5indicates the comparison of catalytic activity over the
Pd
/
Ru/
Ni(
2:
8:
90)/
Al2O3catalyst in the presence of H2S gas.As seen in the above figure, the Pd
/
Ru/
Ni(
2:
8:
90)/
Al2O3catalyst had achieved 100% H2S desulfurization at 100°C, to
sulfur, and remains constant until the reaction temperature of 300 °C. It began to decrease from 100% to 57.31% at temperatures 300–400 °C. The catalyst lost its H2S activity,
probably due to the high concentration of S, which forms an external layer on the catalyst surface, preventing the next incoming H2S from passing and continuing its reaction with
active sites of the catalyst, as suggested by Hassan [25].
Figure 6: The trend plot of reproducibility testing over Pd/Ru/Ni(2:8:90)/ Al2O3 catalyst calcined at 400 °C for 5 h towards CO2 conversion from
methanation reaction.
It seems that in the presence of H2S, the conversion of CO2
decreased to around 30.07% of its performance, from 43.6% to 13.53% at 200°C, indicating that the catalyst was poisoned by the sulfur compound. This sulfur compound is more active in making an interaction between the catalysts, blocking the pore on the surface of the catalyst and, hence, retarding the reduction of CO2 during the reaction. This is in a good agreement with
results reported previously, that the adsorption of H2S on Ni is
very strong, which, then, deactivates the nickel based samples by chemisorption on the metal catalyst [10,26].
3.1.5. Reproducibility testing towards potential catalyst
The reproducibility catalytic activity of the catalyst was tested using the same catalyst several times until the catalyst was deactivated.Figure 6shows the trend plot of reproducibil-ity testing over the Pd
/
Ru/
Ni(
2:
8:
90)/
Al2O3catalyst. It can beseen that the conversion of CO2over the fresh catalyst is 43.60%
at the reaction temperature of 200°C. However, the conversion was slightly decreased to 35.10% after the second testing, us-ing the spent catalyst, and continuously decreased to 26.17% for the third testing over the same spent catalyst at the same reaction temperature. For the fourth testing, CO2 conversion
was lower, even though the conversion of the catalyst kept in-creasing from temperatures of 60–240°C, and then slowly de-activating until the maximum studied temperature of 400°C. From the observation inFigure 6, it can be suggested that the Pd
/
Ru/
Ni(
2:
8:
90)/
Al2O3catalyst started to deactivate after thefirst testing.
3.1.6. Regeneration testing on the potential catalyst
This experiment was demonstrated to determine the op-timum operating conditions needed to regenerate the spent catalyst and re-test its activity. The spent catalyst from Section3.1.5was used to carry out this experiment.Figure 7 shows the trend of the regenerated catalyst testing of the Pd
/
Ru/
Ni(
2:
8:
90)/
Al2O3catalyst at various temperatures andtimes. There are two methods of catalyst regeneration pro-cess: oxidative regeneration and non-oxidative regeneration as classified by Furimsky and Massoth [27]. In this research, the regeneration process is categorized as oxidative regeneration, because the waste catalyst was exposed to the oxygen. Eq.(1) seems to include the idea of using compressed air in this re-search:
NiC(p)
+
3O2(g)−
→
Table 3: The product and by-product of CO2methanation reaction over Pd/Ru/Ni(2:8:90)/Al2O3catalyst detected via GC.
Catalyst Reactant Reaction
temp (°C)
CO2conversion (%) Selectivity
(%)
Unreacted CO2(%)
Product CH4 By-product
CO+H2O
Pd/Ru/Ni(2:8:90)/Al2O3
CO2
100 2.78 35.16 7.33 62.06
200 6.82 36.78 15.64 56.40
300 15.95 29.82 34.85 54.23
400 39.73 13.22 75.03 47.05
CO2+H2S
100 0.35 11.19 3.03 88.46
200 1.73 11.80 12.79 86.47
300 2.61 23.36 10.05 74.03
400 3.64 31.39 10.39 64.97
Figure 7: Regeneration catalytic testing over Pd/Ru/Ni(2:8:90)/Al2O3catalyst
for 3 h at various temperatures towards CO2conversion from methanation
reaction.
The use of compressed air in this research is the most practical approach, since the industrial equipment used for the regen-eration temperature is usually limited to 430°C, as suggested by Trimm [28].Figure 7reveals that the carbon was removed from the Pd
/
Ru/
Ni(
2:
8:
90)/
Al2O3catalyst surface by heatingthe catalyst at 200°C for 3 h in the flow of compressed air, since the conversion of CO2 was comparable to that fresh catalyst,
which was 42%. Therefore, the Pd
/
Ru/
Ni(
2:
8:
90)/
Al2O3cata-lyst can be reused without losing its good catalytic activity.
3.2. Methane gas formation measurement via gas chromatogra-phy
The reactor gas product from the FTIR cell was collected and analyzed for CH4formation. The methane formation was
determined via GC, because of the low sensitivity of FTIR spectroscopy towards the methane stretching region.Table 3 shows the testing results of CO2
/
H2 methanation over thepotential alumina supported catalyst. There are three possible products obtained during the CO2 methanation reaction,
namely, carbon monoxide, water and methane. FromTable 3, it can be seen that the percentage of unreacted CO2decreases
as the CO2was converted into CH4, CO and H2O, while the CH4
content increased as the temperature increased. However, the CO2methanation in this research could be considered a partial
oxidation reaction. This is because the formation of CO and the amount of unreacted CO2are higher than the formation of CH4.
Even at the reaction temperature of 200°C, the conversion of CO2did not yield 100% CH4, but tended to form CO and H2O.
These results are in good agreement with other researchers. Yaccato et al. [17] found that when the methanation process
was tested, the main product observed was CO at low temperature and, when using higher temperature, CH4 was
formed. This is due to the indirect conversion of CO2into C1
hydrocarbons through the formation of intermediate CO, as suggested by Silver et al. [29]. Only 39.73% of methane was formed over this catalyst at the maximum studied temperature. The methane production lowered when the CO2
metha-nation was conducted in the presence of H2S over the
Pd
/
Ru/
Ni(
2:
8:
90)/
Al2O3catalyst. At 200°C, the methanepro-duction decreased from 6.82% to 1.73%, while at 400°C, the for-mation of methane dropped around 91% from 39.73% to only 3.64% indicating that the catalyst was possibly poisoned by the presence of H2S in the gas stream. The active sites of the
cat-alyst were blocked by the sulfur compound. This phenomenon prevents CO2and H2from being absorbed and converted to CH4
on the surface of the catalyst.
3.3. Characterization of the potential catalysts
3.3.1. X-ray diffraction analysis (XRD)
Figure 8shows the diffractograms of XRD analysis for the
Pd
/
Ru/
Ni(
2:
8:
90)/
Al2O3 catalysts, which were calcined at400
,
700 and 1000°C. The XRD diffractogram for the potential catalyst that was calcined at 400°C showed a very low degree of crystallinity and a high noise to signal ratio. It can be seen that the slight significant peaks in the diffractogram could all be attributed to the presence of Al2O3, as the support forthe catalyst which occurred centered at 2
θ
=
67.
000° and 37.
000°. Research done by Wang et al. [30] also reveals that no crystalline phases were detected in the Cu–Mn–O/
Al2O3catalyst that was calcined at 400°C by XRD, because the active components of metal oxides are highly dispersed in the alumina support, which is highly amorphous.
However, at a calcination temperature of 700 °C, the intensity of alumina peaks over the Pd
/
Ru/
Ni(
2:
8:
90)/
Al2O3catalyst was slightly increased and became more profound. This revealed that an intermediate crystallinity was observed in this catalyst. The phase that was dominated by alumina support was revealed as cubic Al2O3at 2
θ
=
67.
114(
I100),
45.
450(
I100)
, and37
.
505°(I90) withdspacing value of 1.393, 1.994 and 2.396 Å(PDFdvalues for cubic Al2O3
(
Å)
=
1.
403, 1.985 and 2.394 Å).From the calculation based on the relative intensity ratio, the overlapping of cubic NiO diffraction peaks with those of the support peaks was assumed to be occurred at 2
θ
of 45.
450° (I100) and 37.
505(
I68)
, with d spacing values of 1.994 andFigure 8: XRD diffractograms of Pd/Ru/Ni(2:8:90)/Al2O3catalyst calcined at
(a) 400°C, (b) 700°C and (c) 1000°C for 5 h.
dvalues for NiO
(
Å)
=
1.
477 Å)
. The other two peaks were obtained at 2θ
of 28.
198(
I100)
and 34.
066°(I77), withdspacingvalues of 3.162 and 2.630 Å (PDFd values for RuO2
(
Å)
=
3
.
182 and 2.690 Å), and were assigned for the tetragonal of RuO2. As shown by Graph (b) inFigure 8, the pattern showedvery small peaks, which were hardly distinguishable from the background noise, possibly indicating that there was only a very small amount of RuO2 present on the surface, or that
the particles dispersed on the support were relatively small. A similar species of the tetragonal RuO2phase was also observed
by Chen et al. [31] at diffraction peaks of 2
θ
=
28.
000°, and 35.
100°over the Ru–La2O3/
Al2O3catalyst, even calcination ata temperature of 500°C. It can be suggested that the presence of RuO2is not resolved over the catalyst.
The cubic phase of PdO peaks was assumed in the envelope of RuO peaks at 2
θ
of 34.
066° (I100) ord spacing values of2.630 Å (PDFdvalue for PdO
(
Å)
=
2.
820 Å)
. Meanwhile, the emergence of a new broad peak at 2θ
of 54.
177°(I70), withdspacing value of 1.692 (PDFdvalue for PdO
(
Å)
=
1.
630 Å)
, was also observed for the same compound.All peaks observed became more intense, sharper and narrower when the catalyst was calcined at 1000°C (Graph (c) inFigure 8) indicating that the degree of crystanallity over the Pd
/
Ru/
Ni(
2:
8:
90)/
Al2O3catalyst increased with increasingcalcination temperature. The highest intensity was also due to the cubic phase of Al2O3at 2
θ
=
66.
671(
I100)
, 45.
648°(I100)and 37.416 (I90) ordspacing values of 1.402, 1.986 and 2.402 Å
(PDFdvalues for cubic Al2O3
(
Å)
=
1.
403, 1.985 and 2.394 Å).In addition, one of the peak corresponding to the cubic NiO was covered with alumina support at 2
θ
of 37.416 (I68) ordspacing values of 2.402 Å (PDFdvalues for cubic NiO
(
Å)
=
2.
412 Å)
. Another two peaks appeared sharply at 2θ
of 43.294 (I100) and 62.
902°(I44) ordspacing values of 2.088 and 1.476 Å(PDFdvalues for cubic NiO
(
Å)
=
2.
088 and 1.477 Å). The nickel oxide cubic phase is thermostable and it can prevent the changing phase from occurring, as suggested by Richardson et al. [32].Furthermore, peaks assigned to the tetragonal of RuO remained similar at 2
θ
of 27.
265° (I100) and 32.131 (I77) or d spacing values of 3.268 and 2.783 Å (PDF d values for RuO2(
Å)
=
3.
182 and 2.690 Å). In the meantime, the broadpeaks of the PdO cubic phase have been transformed into high intensity and sharper peaks at 2
θ
of 31.702 (I100) and 56.
820°(I90) ordspacing values of 2.820 and 1.619 Å (PDFdvalues for
PdO
(
Å)
=
2.
820 and 1.630 Å).However, all the NiO, RuO2 and PdO species were not
observed in the catalyst that was calcined at 400°C (Graph
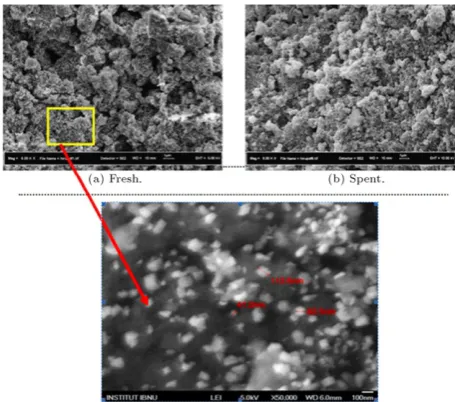
Figure 9: FESEM micrographs of fresh and spent Pd/Ru/Ni(2:8:90)/Al2O3
catalysts, calcined at 400°C for 5 h with magnification 5000×and 50,000×.
(a) in Figure 8). It can be suggested that these species are present with small crystallite size and highly dispersed, so, they could not be detected, due to the insensitivity of the XRD instrument. This was confirmed by EDX analysis, which showed the existence of Ni, Ru, Pd, Al and O elements in the Pd
/
Ru/
Ni(
2:
8:
90)/
Al2O3 catalyst itself. Therefore, it can beconcluded that these species can lead to a higher conversion of CO2 at a reaction temperature of 200 °C, as shown in
Figure 3. The highest CO2 conversion was obtained for the
Pd
/
Ru/
Ni(
2:
8:
90)/
Al2O3catalyst calcined at 400°C (43.60%),followed by the Pd
/
Ru/
Ni(
2:
8:
90)/
Al2O3 catalyst calcined at500 °C (24.10%), 700 °C (10.36%) and 1000°C (3.16%). The formation of active species, such as the cubic phase of NiO, also leads to higher catalytic activity towards the CO2methanation
reaction.
3.3.2. Field emission scanning electron microscopy and energy dispersive X-ray
Figure 9 shows the FESEM micrographs of fresh and
spent Pd
/
Ru/
Ni(
2:
8:
90)/
Al2O3 catalysts, calcined at 400 °Cfor 5 h with magnification of 5000
×
and 50,000×
. The fresh Pd/
Ru/
Ni(
2:
8:
90)/
Al2O3catalyst showed rough surfacemorphology with an inhomogeneous spherical shape, and comes with small particles sizes. The morphology of the fresh catalyst changed significantly after the hydrogenation of the methanation reaction, which showed the formation of aggregated and agglomerated undefined shapes on the surface of the spent catalyst (Figure 9(b)). This observation was possibly due to the heat generated during the catalytic reaction, which caused the catalyst to agglomerate, thus, decreasing the activity, as shown inFigure 6.
In this research, it was found that the particle size of fresh Pd
/
Ru/
Ni(
2:
8:
90)/
Al2O3 catalyst is categorized at theTable 4: EDX analysis of fresh and spent Pd/Ru/Ni(2:8:90)/Al2O3catalysts
calcined at 400°C for 5 h.
Catalyst Weight ratio (%)
Al O Ni Ru Pd C
Fresh catalyst 38.46 50.69 3.33 4.64 2.89 –
Spent catalyst 36.33 44.58 4.33 7.77 3.19 3.80
Table 5: BET surface area and average pore diameter of the fresh and spent Pd/Ru/Ni(2:8:90)/Al2O3catalyst calcined at 400°C for 5 h.
Catalyst Condition SBet(m2g−1) Average pore
diameter (Å)
Pd/Ru/Ni(2:8:90)/Al2O3 Fresh 266.10 50.3841
Spent 221.97 58.3265
supported nickel oxide based catalyst. One of the most efficient ways to improve the reactivity for CO2methanation is to use
materials with a large surface area and high dispersion, as explained by Kodama et al. [33].
Furthermore,Table 4shows the EDX analysis for the fresh and spent Pd
/
Ru/
Ni(
2:
8:
90)/
Al2O3 catalysts. The elementalanalysis performed by EDX confirmed the presence of Ni, Ru, Pd, Al and O in the potential catalyst.
From EDX analysis, it can be observed that the composition of Ru was higher than the composition of Ni on the fresh and spent Pd
/
Ru/
Ni(
2:
8:
90)/
Al2O3 catalysts. This phenomenoncan be explained, due to the incorporation of Ni into the support after calcination of the respected catalyst at 400°C. This is in good agreement with the findings observed by Nurunnabi et al. [12], who claimed that Ni may have been adsorbed into the porous support, hence, the lower concentration of Ni on the catalyst surface than can be detected by EDX. The migration of Ni atoms from bulk matrices to the surface of the catalyst making the higher composition of Ni was detected for the spent catalyst.
Moreover, the spent Pd
/
Ru/
Ni(
2:
8:
90)/
Al2O3 catalystconfirms the existence of 3.80% carbon on the surface of the catalyst. The difference of fresh and spent catalyst surfaces was due to the presence of carbon, as shown in FESEM analysis (Figure 9). The formation of agglomerated catalyst particles in the spent Pd
/
Ru/
Ni(
2:
8:
90)/
Al2O3 catalyst wasobserved. As mentioned by Hu and Lu [34], the catalyst containing nickel is subjected to deactivation by carbon after running the catalytic testing. The low activation energy also can be related to deactivation by coke formation at higher temperature, as explained by Paál et al. [35]. However, the surface state under these conditions is regenerable as confirmed by the regeneration reaction on this catalyst, as discussed in Section3.1.6.
3.3.3. Nitrogen absorption analysis (NA)
The potential catalysts, Pd
/
Ru/
Ni(
2:
8:
90)/
Al2O3, in freshand spent forms, were characterized by nitrogen adsorption analysis.Table 5summarizes the BET surface area and average pore diameter of the Pd
/
Ru/
Ni(
2:
8:
90)/
Al2O3catalyst.Mean-while,Figures 10and11show the N2 adsorption–desorption
isotherms of the fresh and spent Pd
/
Ru/
Ni(
2:
8:
90)/
Al2O3catalysts.
From BET surface area analysis of the Pd
/
Ru/
Ni(
2:
8:
90)/
Al2O3 catalyst, it can be seen that the surface area of thefresh catalyst was 266
.
10 m2g−1; 16.58% higher than its spent catalyst (221.
97 m2g−1)
. According to Wan Abu BakarFigure 10: Isotherm plot of fresh Pd/Ru/Ni(2:8:90)/Al2O3catalyst.
Figure 11: Isotherm plot of spent Pd/Ru/Ni(2:8:90)/Al2O3catalyst.
et al. [36], the BET surface area is presumed to be reduced when there is no generation of new active sites and no transformation of active species occurred during the catalytic reaction. By referring to the EDX analysis, the existence of carbon may also reduce the surface area by blocking the pores of the spent catalyst. As a result, the conversion of CO2 over
the spent Pd
/
Ru/
Ni(
2:
8:
90)/
Al2O3catalyst was decreased to35.10%, compared to the fresh catalyst (43.60%), at the reaction temperature of 200°C.
However, the surface area of the Pd
/
Ru/
Ni(
2:
8:
90)/
Al2O3catalyst is considered higher. The higher surface area of the catalyst denoted the increased active sites of the cat-alyst. This result agrees well with the particle size of the Pd
/
Ru/
Ni(
2:
8:
90)/
Al2O3 catalyst obtained from the FESEMmicrograph, where the catalyst showed nano particle levels. This smaller particle size is presumed to contribute to the increment in surface area. This may contribute to the increas-ing of catalytic activity over the Pd
/
Ru/
Ni(
2:
8:
90)/
Al2O3cat-alyst, while the average pore diameter of fresh and spent Pd
/
Ru/
Ni(
2:
8:
90)/
Al2O3catalysts is around 50 Å. Theprefer-able effect of the pore structure of the support could also en-hance the conversion of CO2, as claimed by Chang et al. [37].
Unfortunately, a nitrogen analysis for the catalyst calcined at 700 and 1000°C cannot be carried out due to instrument break-down.
The N2 adsorption–desorption isotherms of the fresh
Pd
/
Ru/
Ni(
2:
8:
90)/
Al2O3 catalyst demonstrated an isothermFigure 12: Thermogram of Pd/Ru/Ni(2:8:90)/Al2O3catalyst after aging in an
oven for 24 h at 80–90°C.
similar to the spent catalyst (Figure 11). The mesoporous structure of the nickel oxide catalyst led to an increment in CO2
performance, which has been mention previously by Inui [2]. The existence of the mesoporous structure gives an optimum pore size in helping to adsorb reactant gases on the surface of the catalyst itself.
3.3.4. Thermogravimetry analysis—differential thermal analysis (TGA-DTA)
After aging the catalysts, which had been prepared by the wetness impregnation method in an oven for 24 h at 80–90 °C, the catalyst was sent for characterization using TGA-DTG. Figure 12 shows the TGA thermogram of the Pd
/
Ru/
Ni(
2:
8:
90)/
Al2O3catalyst.It showed two significant weight lost curves, which occurred around 60 and 280°C. The total weight loss is 14.66%. Starting from a temperature of 60°C until 280°C, free water molecules and the nitrate compound from the supported catalysts were removed, while, 280°C onwards, the nitrate compound and surface hydroxyl molecule were decomposed from the samples. Savva et al. [38], who studied the Ni
/
Al2O3 catalyst preparedby conventional impregnation and sol–gel methods, found that the physisorbed water was completely removed up to 150 and 200 °C. Meanwhile, the decomposition of nitrate was occurred at a temperature range of 190°C onwards. Finally, they observed that weight loss at temperatures higher than 360°C should be attributed to the removal of structural water from the alumina.
From this investigation, the calcination temperature of 400°C is insufficient to remove all nitrate compounds that originate from the metal precursor. The presence of nitrate compounds in this catalyst was also observed by FTIR analysis, which detected the stretching mode of the free nitrate group. It can be seen that all impurities were removed from the catalysts at temperature higher than 800°C, meaning that a pure metal oxide had been obtained. Thus, the catalyst calcined at 1000 °C should be good for this catalyst. However, the investigation found that calcination temperatures higher than 400°C decreased its catalytic activity.
4. Conclusions
The overall performance from catalytic activity studies did not yield any catalyst that gives 100% conversion of CO2at lower
reaction temperatures. However, Pd
/
Ru/
Ni(
2:
8:
90)/
Al2O3was assigned as the most potential catalyst resulted from catalytic activity measurements of FTIR and GC. This catalyst
was prepared using the wetness impregnation technique aged at 85 °C, followed by calcination at 400 °C for 5 h. The Pd
/
Ru/
Ni(
2:
8:
90)/
Al2O3 catalyst shows 43.60% of CO2conversion with 6.82% of methane formation at 200°C. This catalyst had the highest percentage of 52.95% CO2conversion,
and yielded 39.73% methane at the maximum temperature of 400°C. In the presence of H2S in the gas stream, the conversion
dropped to 35.03%, with 3.64% yield of methane. However, this catalyst achieved 100% H2S desulfurization at 140°C and
remained constant until a reaction temperature of 300°C.
Acknowledgments
The authors gratefully acknowledge the Ministry of Science, Technology and Innovation, Malaysia, for the E-Science Fund Vote 79252, and Universiti Teknologi Malaysia for financial support.
References
[1] Jose, A.R., Jonathan, C.H., Anatoly, I.F., Jae, Y.K. and Manuel, P. ‘‘Experi-mental and theoretical studies on the reaction of H2with NiO. Role of
O vacancies and mechanism for oxide reduction’’,J. Am. Chem. Soc., 124, pp. 346–354 (2001).
[2] Inui, T. ‘‘Highly effective conversion of carbon dioxide to valuable compounds on composite catalysts’’,Catal. Today, 29, pp. 329–337 (1996). [3] Souma, Y., Ando, H., Fujiwara, M. and Kieffer, R. ‘‘Catalytic hydrogenation of carbon dioxide to hydrocarbons’’,Energy Convers. Manage., 36(6–9), pp. 593–596 (1995).
[4] Yamasaki, M., Komori, M., Akiyama, E., Habazaki, H., Kawashima, A., Asami, K. and Hashimoto, K. ‘‘CO2methanation catalysts prepared from
amorphous Ni–Zr–Sm and Ni–Zr-misch metal alloy precursors’’,Mater. Sci. Eng. A, 267, pp. 220–226 (1999).
[5] Finch, J.N. and Ripley, D.L. United States Patent 3988334. Retrieved on October 26 (1976) from:http://www.freepatentsonline.com/.
[6] Kusmierz, M. ‘‘Kinetic study on carbon dioxide hydrogenation over Ru/γ-Al2O3catalysts’’,Catal. Today, 137, pp. 429–432 (2008).
[7] Takeishi, K. and Aika, K.I. ‘‘Comparison of carbon dioxide and carbon monoxide with respect to hydrogenation on Raney ruthenium catalysts’’,
Appl. Catal. A, 133, pp. 31–45 (1995).
[8] Miyata, T., Li, D., Shiraga, M., Shishido, T., Oumi, Y., Sano, T. and Takehira, K. ‘‘Promoting effect of Rh, Pd and Pt noble metals to the Ni/Mg(Al)O catalysts for the DSS—like operation in CH4steam reforming’’,Appl. Catal. A, 310,
pp. 97–104 (2006).
[9] Panagiotopolou, P. and Kondarides, D.I. ‘‘A comparative study of the water–gas shift activity of Pt catalysts supported on single (MOx) and
composite (MOx/Al2O3,MOx/TiO2) metal oxide carriers’’,Catal. Today,
127(1–4), pp. 319–329 (2007).
[10] Erdohelyi, A., Fodor, K. and Szailer, T. ‘‘Effect of H2S on the reaction of
methane with carbon dioxide over supported Rh catalysts’’,Appl. Catal. B, 53, pp. 153–160 (2004).
[11] Happel, J. and Hnatow, M.A. United States Patent 4260553. Retrieved on April 7 (1981) from:http://patft.uspto.gov/.
[12] Nurunnabi, M., Muruta, K., Okabe, K., Inaba, M. and Takahara, I. ‘‘Performance and characterization of Ru/Al2O3 and Ru/SiO2catalysts
modified with Mn for Fisher–Tropsch synthesis’’, Appl. Catal. A, 340, pp. 203–211 (2008).
[13] Baylet, A., Royer, S., Marecot, P., Tatibouet, J.M. and Duprez, D. ‘‘High catalytic activity and stability of Pd doped hexaaluminate catalysts for the CH4catalytic combustion’’,Appl. Catal. B, 77, pp. 237–247 (2008).
[14] Bi, Y., Xu, H., Li, W. and Goldbach, A. ‘‘Water–gas shift reaction in a Pd membrane reactor over Pt/Ce0.6Zr0.4O2catalyst’’,Int. J. Hydrog. Energy, 34,
pp. 2965–2971 (2009).
[15] Lapisardi, G., Urfels, L., Gelin, P., Primet, M., Kaddouri, A., Garbowski, E., Toppi, S. and Tena, E. ‘‘Superior catalytic behaviour of Pt-doped Pd catalysts in the complete oxidation of methane at low temperature’’,Catal. Today, 117, pp. 564–568 (2006).
[16] Gelin, P., Urfels, L., Primet, M. and Tena, E. ‘‘Complete oxidation of methane at low temperature over Pt and Pd catalysts for the abatement of lean-burn natural gas fuelled vehicles emissions: influence of water and sulphur containing compounds’’,Catal. Today, 83(1–4), pp. 45–57 (2003). [17] Yaccato, K., Carhart, R., Hagemeyer, A., Lesik, A., Strasser, P., Volpe, A.F.,
Turner, H., Weinberg, H., Grasselli, R.K. and Brooks, C. ‘‘Competitive CO and CO2methanation over supported noble metal catalysts in high throughput
scanning mass spectrometer’’,Appl. Catal. A, 296, pp. 30–48 (2005). [18] Wachs, I.E. ‘‘Recent conceptual advances in the catalysis science of mixed
metal oxide catalytic materials’’,Catal. Today, 100, pp. 79–94 (2005). [19] Wu, J.C.S. and Chou, H.C. ‘‘Bimetallic Rh-Ni/BN catalyst for methane
[20] Perkas, N., Amirian, G., Zhong, Z., Teo, J., Gofer, Y. and Gedanken, A. ‘‘Methanation of carbon dioxide on Ni catalysts on mesoporous ZrO2doped
with rare earth oxides’’,Catal. Lett., 130(3–4), pp. 455–462 (2009). [21] Ruckenstein, E. and Hu, H.Y. ‘‘Carbon dioxide reforming of methane
over nickel/alkaline earth metal oxide catalysts’’,Appl. Catal. A, 133, pp. 149–161 (1995).
[22] Takenaka, S., Shimizu, T. and Otsuka, K. ‘‘Complete removal of carbon dioxide in hydrogen-rich gas stream through methanation over supported metal catalysts’’,Int. J. Hydrog. Energy, 29, pp. 1065–1073 (2004). [23] De Boer, M., van Dillen, A.J., Koningsberger, D.C., Geus, J., Vuurman, M.A.
and Wachs, I.E. ‘‘Remarkable spreading behavior of molybdena on silica catalysts. An in situ EXAFS-Raman study’’,Catal. Lett., 11, pp. 227–240 (1991).
[24] Habazaki, H., Yamasaki, M., Zhang, B., Kawashima, A., Kohno, S., Takai, T. and Hashimoto, K. ‘‘Co-methanation of carbon monoxide and carbon dioxide on supported nickel and cobalt catalysts prepared from amorphous alloy’’,Appl. Catal. A, 172, pp. 131–140 (1998).
[25] Hassan, K.H. ‘‘Regeneration and activity test of spent zinc oxide hydrogen sulphide removal catalyst’’,Eur. J. Sci. Res., 39(2), pp. 289–295 (2010). [26] Rostrup-Nielsen, J.R. ‘‘Chemisorption of hydrogen sulfide on a supported
nickel catalyst’’,J. Catal., 11(3), pp. 220–227 (1968).
[27] Furimsky, E. and Massoth, F.E. ‘‘Introduction of regeneration of hydropro-cessing catalysts’’,Catal. Today, 17(4), pp. 537–659 (1993).
[28] Trimm, D.L.,Design of Industrial Catalyst, Elsevier Scientific Publishing Company, The Netherlands, pp. 121–139 (1980).
[29] Silver, R.G., Jackson, N.B. and Ekerdt, J.G. ‘‘Adsorption and reaction of carbon dioxide on zirconium dioxide’’, In Catalytic Activation of Carbon Dioxide, W.T. Ayers, Ed., pp. 123–132, American Chemical Society, Washington, DC (1988).
[30] Wang, H.T., Xiao, T.C., Su, J.X., Liu, W.X. and Lu, Y.L. ‘‘Catalytic purification of flue gas from civil-used stove’’,Catal. Today, 53, pp. 661–667 (1999). [31] Chen, X., Zou, H., Chen, S., Dong, X. and Lin, W. ‘‘Selective oxidation of CO
in excess H2over Ru/Al2O3catalyst modified with metal oxide’’,J. Nat. Gas
Chem., 16, pp. 409–414 (2007).
[32] Richardson, J.T., Garrait, M. and Hung, J.-K. ‘‘Carbon dioxide reforming with Rh and Pt–Re catalysts dispersed on ceramic foam supports’’,Appl. Catal. A, 255, pp. 69–82 (2003).
[33] Kodama, T., Kitayama, Y., Tsuji, M. and Tamaura, Y. ‘‘Methanation of CO2
using ultrafine NixFe3−xO4’’,Energy, 22(2–3), pp. 183–187 (1997).
[34] Hu, X. and Lu, G. ‘‘Inhibition of methane formation in steam reforming reactions through modification of Ni catalyst and the reactants’’,Green Chem., 11(5), pp. 724–732 (2009).
[35] Paál, Z., Gyorffy, N., Wootsch, A., Tóth, L., Bakos, I., Szabó, S., Wild, U. and Schlögl, R. ‘‘Preparation, physical characterization and catalytic properties of unsupported Pt–Rh catalyst’’,J. Catal., 250(2), pp. 254–263 (2007). [36] Wan Abu Bakar, W.A., Othman, M.Y., Ali, R., Ching, K.Y. and Toemen, S. ‘‘The
investigation of active sites on nickel oxide based catalysts towards the in-situ reactions of methanation and desulfurization’’,Modern Appl. Sci., 3, pp. 35–41 (2009).
[37] Chang, F.W., Hsiao, T.J., Chung, S.W. and Lo, J.J. ‘‘Nickel supported on rice husk ash-activity and selectivity in CO2methanation’’,Appl. Catal. A, 164,
pp. 225–236 (1997).
[38] Savva, P.G., Goundani, K., Vakros, J., Bourikas, K., Fountzoula, C., Vattis, D., Lycourghiotis, A. and Kordulis, C. ‘‘Benzene hydrogenation over Ni/Al2O3
catalysts prepared by conventional and sol–gel techniques’’,Appl. Catal. B, 79, pp. 199–207 (2008).
Wan Azelee Wan Abu Bakarwas born in 1959, in Kelantan, Malaysia. After graduation from the Department of Chemistry at the National University of Malaysia in 1983, he continued his studies into heterogeneous catalysis at Nottingham University, England and received Ph.D. degree in 1995. He then joined Universiti Teknologi Malaysia, where he is currently Professor of Inorganic Chemistry. Professor Wan Azelee Wan Abu Bakar is author of 100 papers published in national and international journals and 4 university chemistry books.
Rusmidah Aliwas born in 1957, in Klang, Selangor, Malaysia. She obtained her B.S. degree in Chemistry, in 1980, from Universiti Kebangsaan Malaysia, and her M.S. and Ph.D. degrees from the University of Southampton, England, in 1983 and 1987, respectively. She then joined Universiti Teknologi Malaysia, where she is presently Associate Professor of Inorganic Chemistry. Professor Rusmidah Ali is author of 30 papers published in national and international journals and 11 books.