Porter).
The purpose of this study was to determine the impact of a summer bridge program
geared toward first-year students at a large public university located in the Southeastern
United States. The research question guiding this study was, “Does participation in a
summer bridge program increase academic success for first-year college students?” I defined
academic success outcomes as students’ first-year fall semester grade point average,
end-of-first-year grade point average, end-of-first-year fall semester credit hours earned, end-of-first-year spring
semester credit hours earned, end-of-first-year credit hours earned, and retention to the
second year at the university.
The primary methodological approach was propensity score analysis, specifically
inverse probability weighting, used to compare participants in the Summer Bridge Program
at the selected university to similar non-participant matches. To supplement the research and
support gaps in the literature on summer bridge programs, I used basic interpretive
qualitative inquiry to explore the experiences of past summer bridge program participants to
understand why they became involved in the unique program researched. Four themes
emerged from the exploratory study of past participants: eagerness to start college, interest in
getting ahead, parallel peer comparisons, and building a peer network. The results of the
evaluation study did not suggest a definitive positive impact of the Summer Bridge Program
on the academic success of the first-year students who participated. In the primary analysis,
a positive impact was only found for end-of-year credit hours earned. Overall, this study
© Copyright 2016 by Mary Christine Medina
by
Mary Christine Medina
A dissertation submitted to the Graduate Faculty of North Carolina State University
in partial fulfillment of the requirements for the Degree of
Doctor of Philosophy
Educational Research and Policy Analysis
Raleigh, North Carolina
2016
APPROVED BY:
_______________________________ _______________________________
Stephen Porter, PhD Joy Gayles, PhD
Committee Chair
_______________________________ _______________________________
DEDICATION
I dedicate this work to my nephew and niece, Logan and Reese. I love you both very much.
BIOGRAPHY
Mary Christine Medina is a native of Columbia, South Carolina. Mary started her higher
education career as a first-generation college student at Clemson University where she
received her Bachelor of Arts in Mathematical Sciences with a minor in Education. She then
attended Florida State University where she received her Master of Science in Higher
Education with an emphasis in Student Affairs and a minor in Multiculturalism and
Diversity. Afterwards, Mary worked professionally at Clemson University in multicultural
affairs and then at the University of Florida in career services. After working full-time for
several years, she decided to pursue further graduate work full-time and started her Doctor of
Philosophy degree in Educational Research and Policy Analysis with a specialization in
Higher Education Administration at North Carolina State University. While at NC State,
Mary held graduate assistantships in multicultural affairs as well as fraternity and sorority
ACKNOWLEDGMENTS
I would like to thank the many special people in my life whose love and support
throughout this journey helped make it possible. First and foremost, I would like to thank
some of my family members. Thank you to my parents, Luz and Ronald, my sister, Lisa, and
my grandparents Luz and Jose. Your love and support mean the world to me. Thank you for
always being understanding and supportive of my dreams. My journey as a college student is
complete.
Thank you to my dissertation chair, Dr. Stephen Porter, for guiding me through this
process, for helping me expand my quantitative skills, for answering any question big or
small, and for your commitment to seeing me succeed. You helped make this process
manageable and achievable. Thank you to my dissertation committee, Dr. Joy Gaston
Gayles, Dr. Paul Umbach, and Dr. RaJade Berry-James. Joy, thank you for believing in me
and for showing me what it means to be a PhDiva. Paul, thank you for sharing your wealth
of knowledge and for challenging me to become a better writer. Jade, thank you for all of
your advice and for being my cheerleader.
Thank you to my cohort. To my counterparts in the fabulous five, Racheal Brooks,
Ashley Clayton, Becky Crandall, and Shauna Morin. We shared a special bond that I will
never forget. It was great to be reminded I had others in my corner that knew what it was
like to go from full-time professional to full-time student. Thank you to my other cohort
friends, Mark Hall, Ashley Grantham, and Thomas Greene. I appreciate all of the times we
have been my rock throughout this process. Thank you for always being a sounding board, a
shoulder to lean on, someone to give me a reality check when needed, a friend to spend long
afternoons or evenings in the library, and a scholar that could challenge me to strive for the
best. Your kind spirit and energy was always appreciated.
Thank you to my former NC State Multicultural Student Affairs and Office for
Institutional Equity and Diversity colleagues. Thank you to my current Fraternity and
Sorority Life colleagues. I appreciate all of the encouragement you provided me during my
time at NC State. It has been such a pleasure working with you all. Each of you brings a
special energy that helped me grow as a professional. A special thank you to Rod Bradley
for always wanting to make sure that I achieved what I set out on this journey for. You
always believed in me and my ability to be successful in anything that I do. Your check-ins
were always right on time. A special thank you to Ian T. Stroud for expecting nothing but
the best from me. You always made sure that I had the end goal in mind. I finally did it! A
special thank you to Shelly Brown Dobek for your vote of confidence and for helping me
grow as a professional. A special thank you to Chris Jefferson for cheering me on and being
supportive as I neared the end of my journey.
Thank you to all of my professional colleagues, former and current students, and
friends I have met throughout my career from Clemson University, Florida State University,
the University of Florida, NC State, and individuals I have met through NASPA,
LeaderShape®, and beyond. I appreciate you all for cheering me on and for helping me
regards to my research and for answering my questions. A special thank you to Dr. Tara
Thompson for your editing assistance. A special thank you to Kenyatta Shamburger, Altheia
Richardson, Dr. Jeanine Ward-Roof, Dr. Joy Smith, Lyndsey Williams-Mayweather,
Candace Hall, Kwanza Caffie, Tonya Dawson, JJ Evans, and the list goes on.
Thank you to Dr. Carol Galladian for believing in me from day one. I am so thankful
to have had an opportunity to not only work with you but to have built a friendship with you.
I have kept your words of wisdom with me throughout this journey. Thank you to Dr.
Tiffany Davis for expecting nothing but success from me. Thank you for all of your advice,
encouragement, and that extra push to get things done.
Thank you to my sorority sisters of Alpha Kappa Alpha Sorority, Inc. There are too
many of you to name. I am blessed to call you my sisters. A special thank you to the sisters
of the Sigma Tau Omega Graduate Chapter of Alpha Kappa Alpha Sorority, Inc. A special
thank you to Sorors Ashley Young, NaKeisha Pulley, and Aftan Sanders for always checking
on me and showing me sisterly love. A special thank you to Soror Dr. Kimberly Poole for
being a great mentor and role model.
Thank you to my best friends both near and far whose love I am grateful for including
Shaniya Barron, Jasmine Gray Joyner, Grace Kaumeheiwa, Shandon Lesesne, Mee Na Stone,
and Alicia Worthy. You all are the best and I am happy to have made you all proud of me.
Last but not least, thank you to my friend and partner Michael Smith. You mean so
I am sure there are names I have forgotten. But for all the love and support so many
TABLE OF CONTENTS
LIST OF TABLES ...x
LIST OF FIGURES ... xii
CHAPTER 1: INTRODUCTION ...1
Background of the Study ...1
Statement of the Problem ...3
Background on the Summer Bridge Program ...6
Purpose of the Study ...12
Significance of the Study ...13
Limitations ...14
Definition of Terms ...15
CHAPTER 2: LITERATURE REVIEW ...18
Theory of Change ...19
Background ...19
Theory of Change for SBP ...21
Types of Summer Bridge Programs ...27
Summer Bridge Program Participants ...27
Summer Bridge Program Characteristics ...29
Research on Summer Bridge Programs ...32
No Comparison Group or Statistical Adjustment ...32
Comparison Groups...38
Statistical Adjustment ...49
Experimental ...56
Conclusion ...58
CHAPTER 3: METHODOLOGY ...60
Institutional Context ...60
Exploratory Study: Why Do Students Attend SBP? ...61
Approach ...61
Participant Selection ...62
Data Collection ...63
Data Analysis ...64
Evaluation Study: What is the Impact of SBP on Academic Success Outcomes? ...65
Research Design ...65
Population ...67
Sample ...68
Variables ...72
Treatment variable ...72
Outcome variables ...73
Matching covariates ...73
Data Analysis ...83
Exploratory Study ...101
Participant Background ...101
Eagerness to Start College...103
Interest in Getting Ahead ...108
Parallel Peer Comparisons ...112
Building a Peer Network ...116
Summary ...119
Evaluation Study ...120
Descriptive Statistics ...120
Outcomes ...128
Gender, Socio-economic Status, and Academic Ability Subgroups ...133
Female versus male ...135
Low SES versus high SES ...141
Low academic ability versus high academic ability ...147
CHAPTER 5: DISCUSSION AND CONCLUSION ...153
Discussion of Findings ...153
Conclusion ...167
Implications for Practice ...169
Suggestions for Future Research ...172
REFERENCES ...176
APPENDICES ...183
Appendix A: Theory of Change for the Summer Bridge Program ...184
Appendix B: Wellness Wheel ...185
Appendix C: SBP Job Description ...186
Appendix D: Recruitment Email ...188
Appendix E: Preliminary Participant Questionnaire Items ...189
Appendix F: Interview Protocol ...190
Appendix G: Interview Codebook ...192
Appendix H: Treatment, Outcomes, and Matching Covariates ...196
Appendix I: Full Regression Results for Fall GPA ...208
Appendix J: Full Regression Results for End-of-Year GPA ...215
Appendix K: Full Regression Results for Fall Credits Earned ...222
Appendix L: Full Regression Results for Spring Credits Earned ...229
Appendix M: Full Regression Results for End-of-Year Credits Earned ...236
LIST OF TABLES
Table 1. Fall 2013 and Fall 2014 First-Year Student Racial Breakdown ...61
Table 2. Main Covariate Sample: Exclusion of Cases...69
Table 3. SAT Questionnaire Question Descriptions ...70
Table 4. SAT Covariate Sample: Exclusion of Cases ...71
Table 5. Results from the Logit Propensity Models Predicting SBP for Unmatched Data for Main Covariate Sample and SAT Covariate Sample ...84
Table 6. Propensities in Non-SBP and SBP Groups for Main Covariate Sample and SAT Covariate Sample ...91
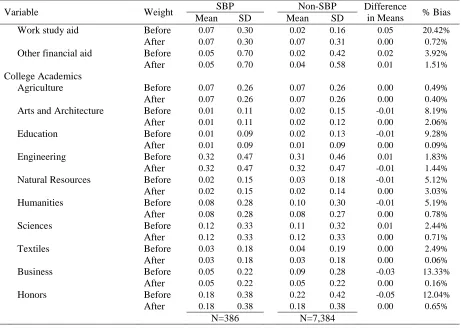
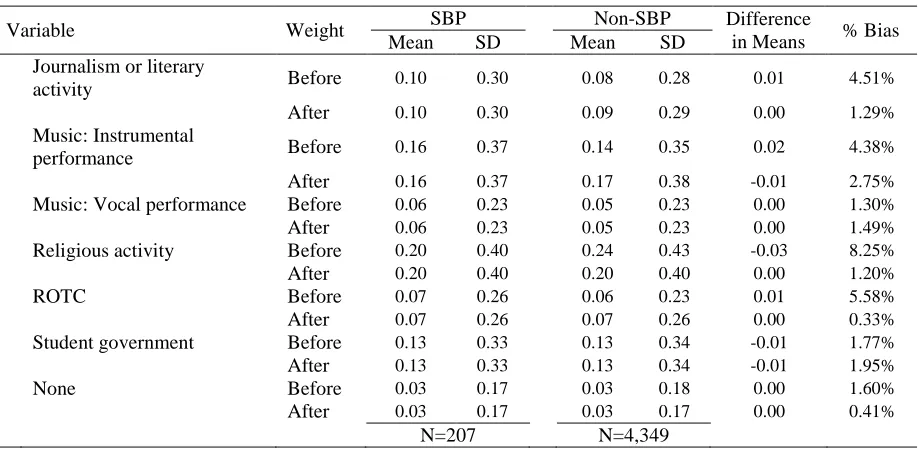
Table 7. Balance Check for Main Covariate Sample ...93
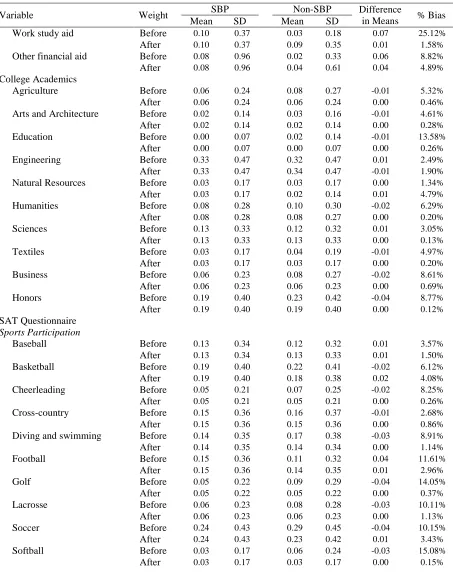
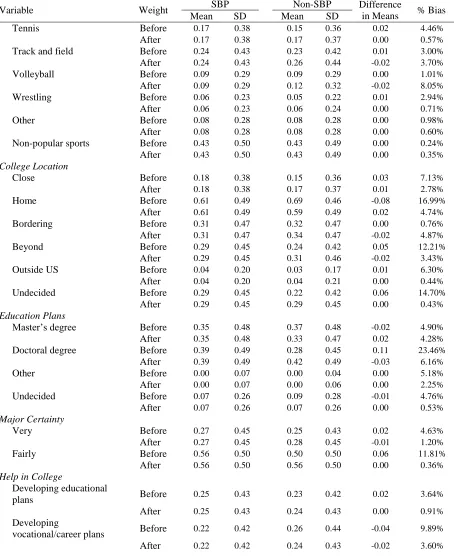
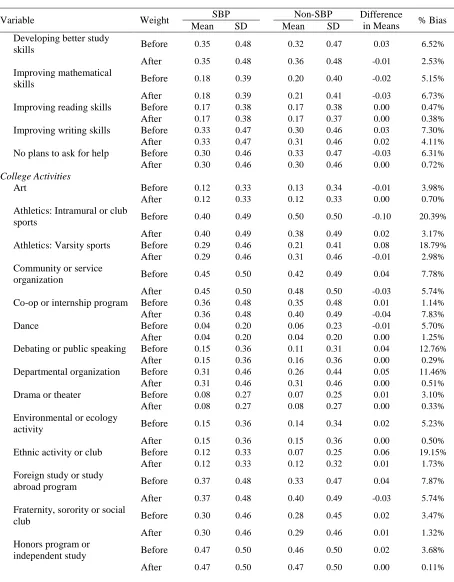
Table 8. Balance Check for SAT Covariate Sample ...95
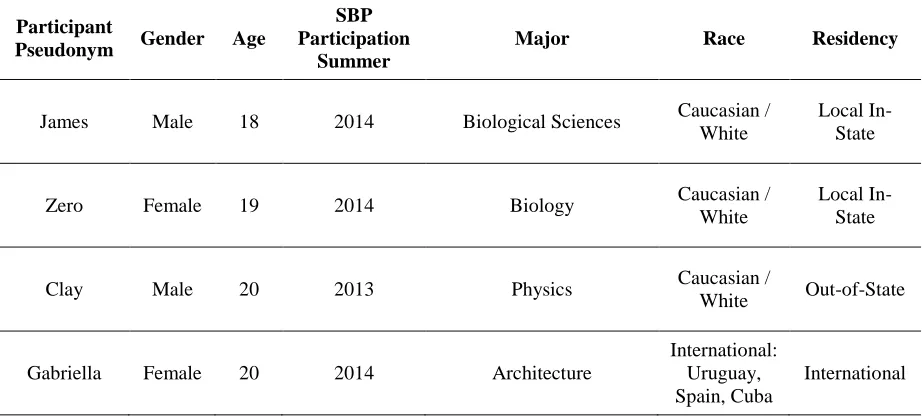
Table 9. Background on Interview Participants ...102
Table 10. Descriptive Statistics for Main Covariate Sample ...121
Table 11. Descriptive Statistics for SAT Covariate Sample...122
Table 12. Regression Results for GPA, Retention, and Credit Hours Earned for Main Covariate Sample and SAT Covariate Sample ...129
Table 13. Median Percent Standardized Bias Before and After Weighting for Each Subgroup in Main Covariate Sample and SAT Covariate Sample ...135
Table 14. Regression Results for GPA by Gender for Main Covariate Sample and SAT Covariate Sample ...137
Table 15. Regression Results for Credits by Gender for Main Covariate Sample and SAT Covariate Sample ...138
Table 17. Regression Results for GPA by Socio-Economic Status for Main Covariate
Sample and SAT Covariate Sample ...142
Table 18. Regression Results for Credits by Socio-Economic Status for Main Covariate Sample and SAT Covariate Sample ...144
Table 19. Regression Results for Retention by Socio-Economic Status for Main Covariate Sample and SAT Covariate Sample ...146
Table 20. Regression Results for GPA by Academic Ability for Main Covariate Sample and SATCovariate Sample ...148
Table 21. Regression Results for Credits by Academic Ability for Main Covariate Sample andSAT Covariate Sample ...150
Table 22. Regression Results for Retention by Academic Ability for Main Covariate Sample andSAT Covariate Sample ...151
Table 23. Interview Codebook ...192
Table 24. Treatment, Outcomes, and Matching Covariates ...196
Table 25. Full Regression Results for Fall GPA ...208
Table 26. Full Regression Results for End-of-Year GPA ...215
Table 27. Full Regression Results for Fall Credits Earned ...222
Table 28. Full Regression Results for Spring Credits Earned ...229
Table 29. Full Regression Results for End-of-Year Credits Earned...236
LIST OF FIGURES
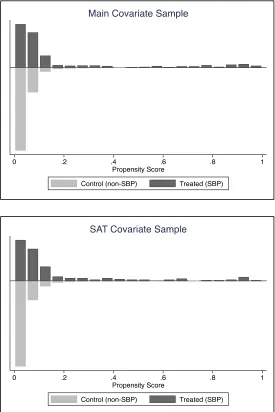
Figure 1. Propensity Score Distributions for Control (non-SBP) and Treated (SBP) Groups in Main Covariate Sample and SAT Covariate Sample ...90
CHAPTER 1: INTRODUCTION Background of the Study
According to a National Center for Education Statistics (NCES, 2014) report on
recent 2012 graduation rate data, only 59% of students seeking a bachelor’s degree at a
four-year institution will graduate within six four-years. This statistic is based on first-time, full-time
students who began a degree program in fall 2006. “The graduation rate for females (61
percent) was higher than the rate for males (56 percent)” (NCES, 2014, p. 194). Further,
retention rates at public institutions are lower than the national average. The six-year
graduation rate was 57% at public institutions with a higher graduation rate for females
(60%) compared to males (54%) (NCES, 2014).
Tinto (2001) indicates the majority of student departures occur prior to the second
year. According to ACT, Inc. (2014b), approximately 22% of first-year students at public
PhD granting institutions in the United States do not return for their second year. This
statistic has remained relatively consistent over the past five years (ACT, Inc., 2014a). These
are troubling statistics indicating that institutions of higher education face extreme challenges
in the retention of undergraduate students.
Institutions implement a variety of retention-focused strategies and interventions in an
attempt to impact graduation rates, specifically from year one to year two in college. The
implementation of summer bridge programs is a popular trend on many campuses (Barnett et
al., 2012). These programs are designed to ensure that students have a successful transition
college, they will ultimately continue on a path of successful achievement toward graduation
(Cabrera, Miner, & Milem, 2013).
To assist with students’ academic and social integration, summer bridge programs
commonly address developmental academic assistance needs, orient students to campus life
culture, foster a network of support among peers and university staff, and provide a
jump-start on academic coursework (Kezar, 2000; Stolle-McAllister, 2011; Tinto, 1990). In all,
summer bridge programs are implemented with an aim that students do not enter the
university underprepared or so far behind their peers that they are unable to succeed (Tinto,
1990). These initiatives vary by institution based on the targeted population that the summer
bridge program is designed to serve. For example, some programs focus more on students in
need of developmental education. These programs help students achieve a higher level of
comprehension and proficiency in core subjects such as math, reading, and writing (Barnett
et al., 2012; Gold, Deming, & Stone, 1992). Other programs may focus on particular skills
needed for a specific major of study (Kezar, 2000). The consensus is that the typical summer
bridge program is designed for a select population.
A program open to all first-year students is uncommon. Kuh (2005) indicates these
programs “are open to anyone who is interested in getting a head start on college” (p. 102).
This unique type of summer bridge program, intentionally designed to be open to all
first-year students from any academic major, is not present in the current body of literature. This
exposes a current gap in the literature, as “open-admissions” summer bridge programs would
The current study focused on a program of this nature, the Summer Bridge Program
(SBP). SBP is a high school to college first-year summer bridge program offered at a public,
research-extensive, coeducational, land-grant university located in the Southeastern United
States. The program is open to all incoming first-year students at the university, regardless
of demographics, background characteristics, and academic ability. Evaluating an
open-admissions summer bridge program allowed me to explore whether the program had an
impact on a broad range of first-year students’ academic success.
This study is grounded in a theory of change conceptual model specifically designed
for SBP (see Appendix A). A theory of change model outlines a causal path from an
intervention to an intended impact (Organizational Research Services, 2004; Taplin, Clark,
Collins, & Colby, 2013). The constructed model provides my interpretation of a conceptual
rationale regarding why SBP should yield a positive impact on academic success for
first-year students. The model incorporates functional components of SBP, as well as, proximal
outcomes. By using propensity score analysis, I investigated the impact SBP had on the
academic success of first-year students at the selected university. To supplement the
implementation of propensity score analysis, I engaged in basic interpretive qualitative
inquiry through interviews to understand why students became involved in SBP. This was a
complementary element to my research to explore SBP’s open-admissions style format.
Statement of the Problem
In the early 1990s, Ackermann (1991) and Garcia (1991) indicated that transitional
retain college students toward graduation. These programs were primarily designed to serve
academically underprepared (Garcia, 1991) and underrepresented students (Ackermann,
1991) in higher education. Today, colleges and universities have continued to offer various
types of summer bridge programs as an alternate strategy to meet the academic and social
transitional needs of entering college students (Barnett et al., 2012; Strayhorn, 2011).
Barnett et al. (2012) refer to summer bridge programs as a popular alternate strategy to
increase college readiness compared to more traditional efforts of developmental education.
Although researchers have reported on the wide use of summer bridge programs over
the years, there has not been much evaluation on whether these programs are meeting their
intended needs (Barnett et al., 2012). Summer bridge programs are designed to help students
transition to the collegiate environment and get on the correct path toward academic success.
Ideally, summer bridge program participants would be successfully retained to graduation.
With this intended outcome in mind, it is important to determine whether summer
bridge programs truly have an impact on students’ academic success in college. This is
where empirical causal research on summer bridge programs is beneficial. Researchers
continually mention that more empirical research should be executed on summer bridge
programs, as many have not assessed these programs in this manner (Barnett et al., 2012;
Bettinger, Boatman, & Long, 2013; Cabrera et al., 2013; Kezar, 2000; Raines, 2012; Sablan,
2014; Strayhorn, 2011; Suzuki, Amrein-Beardsley, & Perry, 2012). The majority of summer
bridge program research has focused on more descriptive analyses of these programs rather
demographically similar to participants (Cabrera et al., 2013; Sablan, 2014; Strayhorn, 2011).
While descriptive analysis is valuable, this type of research alone does not provide a strong
argument on whether summer bridge programs truly impact students in terms of desired
outcomes.
In addition to expanded research on summer bridge programs, researchers need to
explore all types of programs that presently exist. Depending on specific university needs,
many summer bridge programs work to aid in the transition of target demographic groups
(Bettinger et al., 2013; Kezar, 2000; Sablan, 2014). Often, this may include students at high
risk of dropping out of college early such as ethnic minority students and/or lower achieving
students in need of academic assistance (Gold et al., 1992). Programs open to all students
despite their academic or demographic profile would be considered more unique. As such,
there is no research that places a focus on this type of program, as this study does.
Finally, researchers should study summer bridge programs to evaluate funding for
these programs. Sablan (2014) indicates three primary sources of funding: “(a) institutional
funds, (b) federal and state money, and (c) foundation money and grants” (p. 1039).
Depending on the institution and the availability of funds, public institutions may lack state
funding to support such initiatives. The source of funding may affect the types of offerings
within summer bridge programs as well as the selection and conditions for student
participants (Sablan, 2014). Budget dollars should be spent on programs that have a strong
impact on students. Kezar (2000) also emphasizes the need to evaluate summer bridge
which programs are most important on college campuses. Having more empirical data on
summer bridge programs can help justify these initiatives and rationalize the use of funds.
Background on the Summer Bridge Program
When considering evaluation research it is important to understand multiple aspects
of the service delivery unit (Rossi, Lipsey, & Freeman, 2004). Therefore, I provide a
comprehensive overview of the program at the focus of my research to more fully understand
aspects of the intervention. The Summer Bridge Program at the selected university for this
study is designed to assist new first-year students with their transition from high school to
college. The program takes place during the summer over a five-week second summer
session period (end of June to early August). During this time, students live in an on-campus
residence hall and participate in academic coursework as well as interactive events.
The first Summer Bridge Program began in 2010 with a cohort of only 47 students.
Since this time, the program has grown substantially to a nearly 370% increase with 221
participants during summer 2014. Because of the changes that have occurred each summer
since its inception, summer 2014 was considered the fifth pilot year of the program. The
primary change that has occurred from year to year involves differences in the targeted
population of students.
Similar to many other summer bridge programs across the nation as discussed in the
literature, SBP started as a program for at-risk students. This included select student athletes,
conditional admit international students, and those from high schools identified in the state as
selected to participate in a first-year student academic intervention program were also
targeted for SBP. This program was designed to provide intentional academic support to
students that met the general admittance criteria for the university but were not admitted into
their selected major. This first-year academic program was discontinued at the university in
2013. As SBP grew from the year of its inception, the program targeted more student
populations for participation. Campus partners assisted to market SBP to target groups, such
as students of color and students in engineering and science majors, to ensure students heard
about the program through multiple channels.
Today, SBP is open to all incoming first-year students from each academic college on
campus. This means that partnerships with each academic college exist to accommodate the
program participants during summer courses. Currently, only one subgroup, first-year
student athletes, is required to participate in SBP. Prior to 2014, only select student athletes
were required to participate, such as those on the football or basketball team.
Recruitment for SBP participants occurs in several different ways. Once students are
accepted to the university, they are sent information about SBP via traditional mail and
email. The following is an excerpt from a recruitment message:
As an accepted student, we would like to extend an invitation to participate in the
[Summer Bridge Program]. [SBP] offers new freshmen the chance to get a head start
on learning about the unique opportunities available at [the university]. Get to know
advisors to plan your academic careers. Take classes recommended by your specific
college or department and get a jump-start into your curriculum.
Presentation sessions are provided at various admitted student events hosted by
undergraduate admissions. SBP also has a website that shares details about the program.
Included on the website is a video highlighting aspects of the program such as: take up to 8
credit hours, enhance study skills, enhance research skills, enhance presentation skills,
collaborate with mentors to help guide you, explore the university’s beautiful campus, enjoy
on and off campus programs, and give back to the community.
Many campus partners also assist in sharing information about SBP to admitted
students to encourage enrollment in the program. The academic support unit for student
athletes communicates directly with students required to participate and communicates with
the SBP coordinator to arrange their enrollment in the program. Now that the program is
open to all first-year students at the university, the marketing efforts are much broader and
uniform, and no particular group is more likely to be invited over others.
SBP operates on a three prong programmatic design: academic success, social
exposure and networking, and campus acclimation. These elements are infused throughout
the operations of SBP. The program aims to provide a supportive environment to program
participants while also providing a realistic view of the transitional challenges that may occur
during the full academic year. The present study measures the academic success portion of
Enrollment in summer classes that prepare students for the first year in their major is
core to the SBP experience. The academic coursework for each student varies by academic
college. Academic colleges have the flexibility to design the coursework track offerings for
students. This may include one to three track options. Some colleges specifically outline the
courses a student will take, such as necessary prerequisites for their major, while others may
allow the student to select from a list of general education program options. Further,
dependent on the college and the student’s desires, a student may take anywhere from one to
three classes with a maximum limit of 8 credit hours.
In addition to academics, SBP also engages in partnerships with various offices and
departments across campus. These campus partners provide support and informational
resources to participants. Sample campus partners include multicultural student affairs, the
counseling center, university recreation, housing, dining, and the student leadership and
service office. As a part of a new initiative starting in 2014, SBP designed the events under
the framework of a Wellness Wheel. Adapted from Hettler’s (1976) dimensions of wellness,
SBP follows a seven dimensional Wellness Wheel that includes: physical, emotional,
intellectual, social, environmental, occupational, and spiritual wellness. A description of the
components of the Wellness Wheel is provided in Appendix B.
Each of the SBP events focuses on at least one of these areas of wellness. During
summer 2014, SBP hosted a total of 27 events, including an introductory workshop on
wellness. Event topics and activities included leadership styles, procrastination, financial
sleep education, study skills, healthy relationships, anxiety and depression awareness,
community service projects, crafts, cultural awareness, and fitness activities. Typically there
are four to six SBP events offered per week of the program. All of these events range in
length of time and are optional for students to attend.
As a benefit to SBP participants, students are able to receive a Certificate of
Achievement in Leadership and Wellness. To receive this certificate, students must fulfill
three requirement areas. This includes attendance at a minimum of 8 events covering all of
the dimensions of the Wellness Wheel including a mandatory introductory session, write a
one to two page reflection on each event attended, and develop a detailed four-year personal
success plan focused on further developing in all areas of wellness. Overall, SBP students
can determine how engaged they want to be in the program events and whether they want to
fulfill the requirements of the certificate of achievement.
SBP also incorporates several required activities. All participants attend a university
orientation session in late June exclusively for SBP. This orientation mimics the other
sessions at the university held for incoming first-year students. Orientation is a one and a
half day experience going from approximately 8 a.m. to 10 p.m. on day one and 7:30 a.m. to
12 p.m. on day two. This is the kick-off event for the summer. Other required events during
the summer include a university resources scavenger hunt and a closing banquet.
In addition to program events, SBP participants may take advantage of other campus
resources open during the summer. These include, but are not limited to, tutoring services,
During the summer, the tutoring services office offers study hall and drop-in tutoring options
specifically for SBP students. In addition, SBP students can take advantage of regular
support offered by the office such as requesting to work with a tutor on a weekly basis.
University offices are typically open from 8 a.m. to 5 p.m., which would include counseling
and health services. Recreation services are typically open from 6 a.m. to 9 p.m. Monday
through Friday, 9 a.m. to 7 p.m. on Saturday, and 10 a.m. to 7 p.m. on Sunday.
The SBP staff includes a program coordinator, graduate assistant, administrative
specialist, and approximately twenty to twenty-five student mentors. The program
coordinator has primary oversight of the program and works with the graduate assistant to
plan logistics. They also collaborate to provide training meetings for student mentors, which
take place the spring semester prior to the summer program. All of the mentors are past
participants of the program. Expectations of mentors include establish and maintain open
communication with participants, serve as an academic role model to students, advise
students on college freshman adjustment issues, and be available to listen to student
concerns, questions, and suggestions. Additionally, mentors are required to meet
individually with their assigned students a minimum of once a week for at least 20 to 30
minutes. Mentors must also complete a weekly report, due to the program coordinator,
regarding their interactions with their mentees. A more complete overview of the SBP job
description is provided in Appendix C.
Lastly, to cover all program logistics and staff salaries, the SBP budget is
annually. The graduate assistant receives an annual stipend of $12,000 in addition to tuition
sponsorship, health insurance, and professional development funds to attend a conference.
The student mentors each receive a $600 stipend in addition to housing for the summer.
Purpose of the Study
The purpose of this quasi-experimental study was to reduce bias in the estimates of
the effect of the Summer Bridge Program for first-year students at a public,
research-extensive, coeducational, and land-grant university located in the Southeastern United States.
I compared students participating in SBP to other first-year students at the institution not
participating in any summer bridge program. Because the format of the program has been
most consistent in recent years, I used the 2013 and 2014 cohorts for analysis in this study.
In order to have demographically similar groups, I matched the students on a series of
covariates not affected by participation in SBP to execute propensity score analysis, more
specifically inverse probability weighting. I categorized the covariates as student
demographics, academic preparation, financial aid, college academics, and SAT
Questionnaire.
The concern in conducting propensity score analysis is whether the treatment has an
impact on the intended outcomes. To reduce bias on the estimates and address whether there
first-year fall semester grade point average (GPA), end-of-first-year grade point average,
first-year fall semester credit hours earned, first-year spring semester credit hours earned,
end-of-first-year credit hours earned, and retention to the second year at the university based
on the fall student census date. SBP participants were considered to have an increase in
academic success if their GPAs, credit hours earned, and retention rates were higher than
non-participants. Overall, this study contributes to the knowledge base on summer bridge
programs by providing empirical results on the impact of an open-admissions summer bridge
program on academic success for first-year college students.
In addition, I sought to understand why students decided to participate in SBP. The
open-admissions structure allows any first-year student to opt-in to participate in the
program. However, the reasons students decide to participate in SBP are absent, which is
also reflected broadly in literature on summer bridge programs. Therefore, I also used basic
interpretive qualitative inquiry through past participant interviews to gauge why students
participate, which provides context to the overall focus of the study.
Significance of the Study
As a popular initiative in higher education, it is important that researchers conduct
rigorous research to determine the effectiveness and impact of summer bridge programs. The
results of empirical research may provide substantiated evidence to guide the future of these
programs on college campuses. By conducting a quasi-experimental analysis, this study
addressed a void in the existing body of literature by assessing the impact of a summer bridge
Although the specific format and structure of summer bridge programs vary by
institution, participation typically correlates with a specialized target population other than
just any new student. An evaluation of programs that are open to any first-year student is a
concentration that does not appear prevalent in the existing body of literature. This study
explored a summer bridge program that, although includes marketing efforts to campus
partners working with diverse student populations, is open to any interested incoming
first-year student at the university. This study allowed for research on a summer bridge program
that does not fit the traditional design model.
More specifically, current research evaluates academic outcomes for these summer
bridge programs. Many of these programs target low achieving students who may already be
at a disadvantage in their academic success. Therefore, it was beneficial to see if academic
outcomes were more positive for a program geared toward all first-year students that would
likely have a mixture of students at different academic ability levels.
These areas of significance provided support for an examination of the summer
bridge program at the focus of this study. The findings provide critical information regarding
the impact of an open-admissions style summer bridge program. It also provides information
appropriate for university administrators who would benefit from knowing if these programs
are meeting their target objectives.
Limitations
There were two primary limitations in this study that may influence the interpretation
where students would have the same probability of being assigned to the treatment group
compared to the control group. However, in this study, I was only able to observe intact
groups of students who chose to participate versus those who did not. This means I could not
implement a randomized approach. Therefore, I implemented an alternate strategy via an
observational approach, propensity score analysis, that aims to replicate the conditions of a
randomized design by making treated and control groups look similar. The research design
allowed me to reduce bias in the estimation of the effects.
Second, there are limitations to conducting propensity score analysis. Khandker,
Koolwal, and Samad (2010) state that the validity of propensity score analysis depends on
two conditions: “(a) conditional independence (namely, that unobserved factors do not affect
participation) and (b) sizable common support or overlap in propensity scores across the
participant and nonparticipant samples” (p. 53). As referenced in the first condition, because
propensity score analysis only accounts for the observed covariates included in the model,
error is possible if there are unobserved covariates not included in the model that impact the
treatment and outcome (Caliendo & Kopeinig, 2008). To resolve this potential disadvantage,
I selected an intentional and comprehensive list of preexisting background characteristics to
minimize omitted variable bias (Ho, Imai, King, & Stuart, 2007).
Definition of Terms
The following is a list of terms and phrases defined to ensure clarity and consistency
Academic success: Grade point average, credit hours, and retention are components used to define academic success. I was interested in first-year fall semester and
end-of-first-year grade point averages for this study. Additionally, I considered first-end-of-first-year fall semester,
first-year spring semester, and end-of-first-year credit hours earned. I based retention on
enrollment to the second year of college at the selected university. This study examined
whether SBP participants had higher grade point averages, higher number of credit hours
earned, and higher levels of retention to the second year of college compared to
non-participants. I evaluated outcomes independently from one another because successful
achievement in all three areas did not constitute academic success. Rather, I used academic
success as a categorization for the variables. When comparing SBP participants to
non-participants, positive impacts in any of these components yielded a higher level of academic
success.
First-year student: The phrase “first-year student” is used to describe the population of interest for this study. In alignment with the selected university, I defined first-year
students as first time, full-time freshmen entering the fall semester.
Retention: Retention is the process of continuing enrollment at the university. This study specifically investigated retention to the second year of college, which aligned with the
selected university’s definition of retention rate.
Student census date: The official enrollment date, for the corresponding term, as defined by the university is labeled the student census date. The census date is the tenth day
Summer bridge program: Summer bridge program (lowercase letters unless at the beginning of a sentence) is used to reference the overarching category of programs that occur
over the summer to assist students with their transition into college. These programs are
considered to be a “bridge” from high school to college.
Summer Bridge Program: Summer Bridge Program (with capitalized letters) or SBP will be used as a proper noun to denote the specific program evaluated at the selected
CHAPTER 2: LITERATURE REVIEW
The focus of this study was to evaluate the impact of the Summer Bridge Program, a
specific program designed for entering first-year college students. Before delving into the
data on the program, it was important to get a conceptual foundation of what occurs from
pre-entry to a summer bridge program to post-program outcomes. The literature review
begins by exploring the process of a theory of change model. Through information gathered
about SBP, I created a theory of change model to explore the stages a student may experience
when participating in such a program.
Next, I explored what is known about summer bridge programs. This included
information about the types of programs that exist. Therefore, I explored literature about
program participants and characteristics. This helped support the significance of this study
by highlighting how the similarities and differences of the Summer Bridge Program
compared to what was present in the literature. The lack of information about why students
participate in summer bridge programs fueled the addition of an exploratory study
interviewing past SBP participants to this study.
Lastly, I examined research studies focused on summer bridge programs that also
investigated academic success outcomes. My study focused on a quantitative method not
commonly utilized in educational research. Therefore, I organized past research and findings
by the types of research methods used. This presented a baseline of the results found in
Theory of Change
Interventions such as summer bridge programs are designed by universities with
intended outcomes. Typically the most general outcome is to create an environment where
students have a smoother transition into college and to prepare them for their first year. A
summer bridge program intervention would ideally yield positive results regarding this
outcome. To expand on this outcome, the present study examined the impact of the Summer
Bridge Program on student outcomes pertaining to GPA, credit hours, and retention.
In order to evaluate the impact a summer bridge program has on intended outcomes,
it is first helpful to understand the process of a student’s experience from beginning to end.
Theory of change is a conceptual framework that helps clarify this process. Also referred to
as a logic model or theory of action (Organizational Research Services, 2004), theory of
change “defines long-term goals and then maps backward to identify changes that need to
happen earlier (preconditions)” (Taplin et al., 2013, p. 2). The theory of change process
reflects “causal pathways of outcomes, showing each outcome in logical relationship to all
the others” (Taplin et al., 2013, p. 2).
Background
Typically a theory of change model is mapped graphically through an outcomes map,
“a visual diagram that depicts relationships between initiative strategies and intended results”
(Organizational Research Services, 2004, p. 2). The theory of change process begins with
initiative strategies that outline particular strategies or characteristics of an intervention. The
desired change in condition and could range from short-term to long-term outcomes (Taplin
et al., 2013). From here, the outcomes flow to the intended results, which include the
specific goal or impact of the initiative based on its strategies. The final theory of change
outcomes map represents the causal path over time, explaining how the strategy is connected
to the intended results. It is important to note that the path is likely complex with different
components of the strategy impacting an array of outcomes that ultimately connect to the
intended results.
The conceptual model guiding Cabrera et al.’s (2013) study on the New Start Summer
Program (NSSP) mimics a theory of change model. In the study, the researchers examined
“the impact of NSSP participation on key outcomes after controlling for precollege
preparation and experiences while also taking account of first-year college experiences”
(Cabrera et al., 2013, p. 486). Their strategy was the New Start Summer Program, with
demographics such as race, gender, and socio-economic status serving as precollege factors.
Students experienced a variety of outcomes during their first year including campus racial
climate, peer environment, support networks, and student involvement (Cabrera et al., 2013).
Additionally, they framed intermediate outcomes as student self-evaluations, academic
development, and campus sense of belonging. Finally, their overall goal focused on
first-year GPA and retention (Cabrera et al., 2013). Ideally, participation in the summer bridge
program would positively impact GPA and retention. Cabrera et al.’s (2013) research was
Theory of Change for SBP
In order to provide a framework or conceptual lens to my research, I created a
suggested theory of change conceptual model for SBP (see Appendix A). In considering the
structural components of SBP, the model depicts the relationships the intended impact of the
program has on short-term and long-term student outcomes over time. The causal
relationships shown are based on the information I have gleaned about SBP as well as the
body of literature about summer bridge programs. The model is separated into five segments
including: pre-intervention, Summer Bridge Program, end of summer, first year of college,
and first-year outcomes.
Students enter the intervention with a range of student profile characteristics
highlighted in the pre-intervention segment. These items may impact participation in the Summer Bridge Program but are not affected after participation in the intervention. These
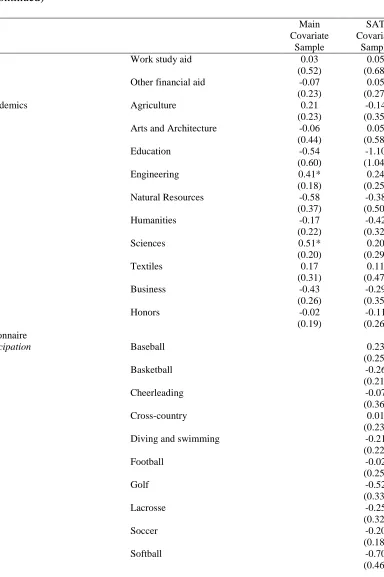
student profile characteristics, which also represent categories of covariates for this study,
include student demographics (i.e., citizenship, race, gender, residency status, and age),
academic preparation (i.e., standardized test score, high school GPA, Advanced Placement
exams, and high school type), financial aid (i.e., type and amount of aid received), college
academics (i.e., first-year academic college and freshman performance placement for an
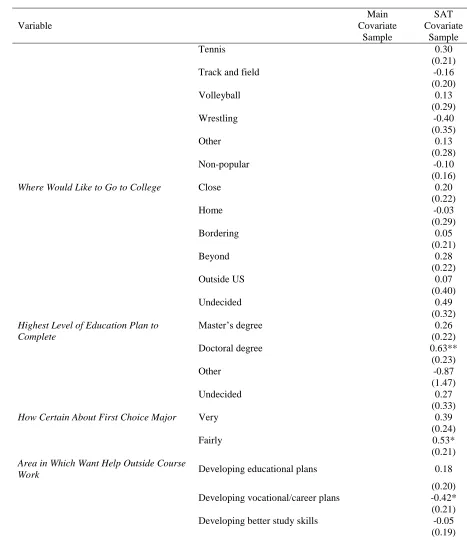
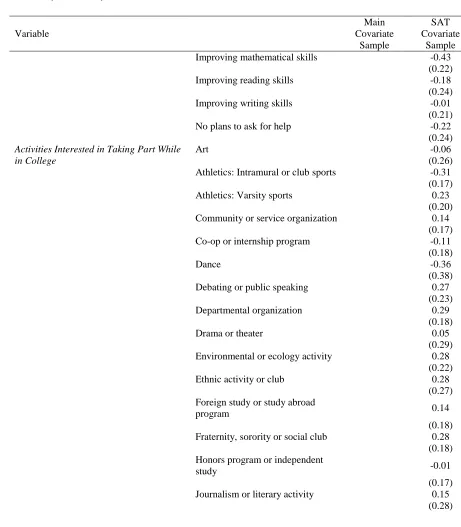
honors program), and college interests and intentions based on responses to a SAT
Questionnaire (i.e., sports participation in high school and intended participation in college,
proximity to home, highest level of education planned to complete, certainty about major
choice, and areas interested in receiving help outside of coursework).
Summer Bridge Program is the next segment in the model that represents the actual intervention. This segment outlines the functional components of SBP that include: SBP
events, on-campus residential component, SBP mentor, and college coursework. All of these
elements are integral to the Summer Bridge Program and were designed to impact student
success with the college experience. From here, the model flows in a causal path across time
and impacts different end-of-summer proximal outcomes.
My interpretation of the impact of the Summer Bridge Program includes several links
to end-of-summer outcomes. The SBP events may cover topics related to physical,
emotional, intellectual, social, environmental, occupational, and spiritual wellness. Sample
events include a resume building workshop and a fitness class. Participation in SBP events
directly impact students’ campus acclimation, knowledge of campus resources and activities,
social exposure/peer network, the faculty/staff network, understanding of academic
expectations, and academic success in summer coursework. These items intersect as the
events allow students to become familiar with the physical elements of campus by exploring
different locations on campus. Additionally, the events introduce students to campus
resources and activities that students may find beneficial as they integrate into the university
community. Some of the events also address skills-based learning, such as study skills or
time management, which may be beneficial toward a student’s academic success. The events
events also allows participants to get to know their peers in smaller settings. The events
allow students to meet various faculty and/or staff members on campus who facilitate the
events and represent various departments.
The on-campus residential component directly impacts campus acclimation alongside
social exposure and developing a peer network. The student participants are able to explore
for the first time what it is like to live on campus in a residence hall. By virtue of living on
campus, they will become more familiar with other buildings and resources on campus.
Living in the residence hall allows students to engage with their peers who live in the same
space as they do.
Each SBP participant is matched with an upperclassman mentor who also entered the
university through the program. The SBP mentor directly impacts knowledge of campus
resources and activities along with social exposure and developing a peer network. The SBP
mentor likely shares with the incoming student lessons learned about the university and may
reinforce the use of campus resources (e.g., tutoring services) and participation in campus
activities (e.g., student organizations) to help students in need of academic and social
engagement. Additionally, the mentor provides a direct connection to peers on campus and
may help students develop meaningful relationships with other first-year students and
upperclassmen students at the university.
College coursework includes tracks offered by academic colleges, general education
courses, and a USC 100 first-year seminar course. The academic college coursework tracks
more flexibility in choosing their classes for the summer. Students are also able to take
introductory courses for their major and necessary prerequisite courses. The general
education coursework may also depend on the academic college as some students have more
flexibility to take courses that satisfy general education coursework for the university. The
USC 100 first-year seminar is designed to assist first-year students with their transition to the
university by covering topics such as cultural awareness, academic adjustment, college
success, social adjustment, and campus resources. All but one academic college,
engineering, provide the opportunity for students to take the USC 100 course.
In all, the college coursework element directly impacts all of the end-of-summer
outcomes. In particular, the first-year seminar would likely impact campus acclimation and
knowledge of campus resources, as this is typically a focus of this type of class. All of the
courses would allow students to build their peer network. For example, students may work
with one another for group projects in class or study together. Students would naturally
interact with various faculty members through the classes, as well. Because the classes are
offered with SBP students in mind, they may allow students to have a smoother transition
with the academic expectations in college classes compared to high school. Ideally, students
would succeed in their summer coursework and be prepared to have a higher level of
proficiency in coursework related to their major.
The next segment of the model is the end of summer outcomes. Each of these outcomes matches the intended outcomes of SBP and impacts student experiences during
engagement. Campus engagement may involve different forms of student connectedness to
the university through academic, social, and community elements. As a student becomes
more acclimated to campus by participation in different activities and engagement with
faculty, staff, and students, they may feel more engaged at the university (Tinto, 1993).
I propose that obtaining knowledge of campus resources and activities would impact
student campus engagement, peer group interactions, and academic performance.
Knowledge of campus resources and activities would allow students to find ways to become
involved on campus such as through a student organization, which would help them become
more engaged and connected at the university. Peer group interactions include opportunities
for students to engage with their university peers both in and outside of the classroom.
Academic performance focuses on students’ performance in their classes. With knowledge
of campus resources, students would have a personal reference guide to know where they can
go if they need assistance in their coursework. For example, knowing about resources to
improve time management may benefit students by helping them more effectively plan how
to be successful in their coursework. This may lead to higher levels of academic
performance. Social exposure/peer network further impacts campus engagement and peer
group interactions. Students’ interactions with their peers help develop their sense of
community on campus. Additionally, building a faculty/staff network impacts faculty/staff
interactions both in and outside of the classroom.
Understanding academic expectations, academic success in summer coursework, and
performance. If students understand academic expectations and have a successful summer
term with their classes, they may be more likely to continue this success in their first year of
college. They may have learned what it would take for them to be personally successful in
their academics and be better prepared to handle a full course load during their first year.
The first year of college segment focuses on student interactions with members of the academic and social systems of the institution as referenced in Tinto’s (1993) integration
framework. This segment of the SBP conceptual model includes campus engagement, peer
group interactions, faculty/staff interactions, and academic performance. Continuing the
causal flow of the SBP intervention, all of these elements impact the final first-year outcomes
of the model: GPA, credit hours, and retention.
The first-year outcomes included in the model represent the intended outcomes of my research study regarding first-year fall semester GPA, end-of-first-year GPA, first-year fall
semester credit hours earned, first-year spring semester credit hours earned, end-of-first-year
credit hours earned, and retention to the second year of college. GPA, credit hours, and
retention may be influenced by all elements of students’ university experience and make
them appropriate distal outcomes to consider within the model. Based on my theory of
change for the Summer Bridge Program, I proposed that the program would impact various
outcomes following a causal flow of elements that impact one another. In the end, the
program would ideally impact GPA, credit hours, and retention in a positive manner with
Types of Summer Bridge Programs
Colleges around the nation have implemented summer bridge programs as an effort to
help students transition into their university communities. Stolle-McAllister (2011) mentions
that summer bridge programs primarily address issues of attrition and persistence as
referenced in the theoretical frameworks of Astin (1993) and Tinto (1993). More
specifically, Stolle-McAllister indicates that, “the overarching goals of summer bridge
programs are to remediate academic skills, inform about campus life, orient to institutional
culture, help develop social networks, focus goals, and help students begin college with a
positive outlook” (p. 12). This provides a good summative description of summer bridge
programs. The degree to which some of these components are a higher priority may depend
on the target audience for the programs.
Summer Bridge Program Participants
Although the focus of this research was a high school to college summer bridge
program at a public four-year institution, these programs exist at varying institutional levels
and types. Sablan (2014) identifies these programs as existing at community colleges as well
as four-year public and private universities. At the community college level, some programs
exist to assist students with the transition into a two-year college (e.g., Evans, 1999;
Wathington et al., 2011) or the transition from the community college to a four-year college
(e.g., Ackermann, 1991). However, more commonly these programs serve incoming
environment with a focus on academics (Sablan, 2014) as well as a retention practice to
ensure their persistence at the university (Habley & McClanahan, 2004; Kezar, 2000).
Organizers of summer bridge programs typically focus participant recruitment and
selection efforts on students within a specific target population based on personal and/or
familial background, majoring in a specified academic field, and/or those needing remedial
or developmental education (Bettinger et al., 2013; Kezar, 2000; Sablan, 2014). More
specifically, researchers have discussed summer bridge programs designed for participants
that identify within groups such as ethnic minority and low-income students (Bettinger et al.,
2013; Cabrera et al., 2013), first-generation college students (Bettinger et al., 2013), female
engineering students (Fletcher, Newell, Newton, & Anderson-Rowland, 2001), African
American students in need of developmental academic assistance (Gold et al., 1992), or
overall students that may be at high risk of dropping out early (Garcia, 1991). All of these
special populations may therefore benefit from the learning and engagement opportunities in
a summer bridge program. Additionally, Raines (2012) mentions that summer bridge
programs may be designed for gifted students as well.
The limited amount of research that exists on summer bridge programs makes it
difficult to draw conclusions or generalizations about the students that participate. Despite
targeted efforts, what drives a student to participate in a summer bridge program?
Researchers have shared demographic profiles of their student participants. However, these
demographics are skewed based on the target populations, which are often students from
In my review of previous research, I found that women frequently outweighed their
men counterparts in summer bridge participation. This does not take into consideration the
summer bridge programs where women are the sole gender group participating. For
example, in Ackermann’s (1991) study of underrepresented and low-income students
participating in a transfer focused summer bridge program, participants were 52% female and
48% male. The institutions evaluated in Barnett et al.’s (2012) study also served more
females than males with one of the institutions, Palo Alto College, having the highest
difference with a 3 to 1 female to male ratio. Additionally, the students included in Evans’
(1999) study were approximately 64% female and 36% male.
It is unclear whether more females intentionally participate in these programs
compared to males or if it simply reflects national trends that more females currently pursue
higher education overall (NCES, 2014). Because this study focused on a particular program,
I used basic interpretive qualitative inquiry to further understand why students became
involved in SBP and to note some of those students’ characteristics. In addition, I also
considered descriptive statistics of demographic covariates when reviewing the institutional
data. Because SBP is open to all students no matter their demographic profile, exploring the
types of students who chose to participate was interesting.
Summer Bridge Program Characteristics
According to Kezar’s (2000) report on the types of summer bridge programs, the
range of activities implemented vary greatly. The primary characteristics pertaining to
assistance needs, orienting to campus life culture, fostering a network of support, and
providing a jump-start on academic coursework (Kezar, 2000). Each of these program
design components may impact the intended outcomes for each individualized campus
program.
According to Stolle-McAllister (2011), an overarching goal of summer bridge
programs is to assist students in need of remediation. Many students enter college
underprepared for the academic rigor involved in college-level courses (Bettinger et al.,
2013). “Administrators, practitioners, and policy makers are responding by redesigning
developmental courses and searching for ways to implement effective remediation programs
more broadly” (Bettinger et al., 2013, p. 93). Addressing developmental needs through a
summer bridge program provides an alternative and innovative approach compared to more
traditional efforts (Barnett et al., 2012). This would provide underprepared students the
opportunity to get the developmental assistance they need during the summer prior to their
first year in college (Bettinger et al., 2013). Additionally, the developmental assistance
would allow students to complete the foundational coursework needed so that they may
progress in college at a similar pace to their peers.
The start of college involves a transition and acclimation period to the collegiate
setting. This is another area in which summer bridge programs are designed to assist
students. Through summer bridge programs, students are introduced to university services
such as tutoring, academic advising, career counseling, and psychological counseling
resources and services provides students with the knowledge of how the university is
structured to assist them in their collegiate journey.
The next characteristic of summer bridge programs is to help participants foster a
network of support. This may be provided by the interactions with university staff or peers
who may serve in a mentoring capacity. Fletcher et al.’s (2001) research showcases this
importance in their evaluation of the Women in Applied Sciences and Engineering (WISE)
Summer Bridge Program. Often, female students encounter a variety of barriers to persist in
the sciences and engineering as these fields typically have a larger percentage of males
(Fletcher et al., 2001). As such, women may face challenges to persistence in these scientific
degree programs due to the lack of gender similar mentors. Therefore, the ability to develop
personal relationships and create a network of support of other female peers can be crucial to
their success (Fletcher et al., 2001).
Finally, the opportunity for students to take college courses that allows them to
jump-start their academic major is common to the majority of summer bridge programs (Garcia,
1991; Raines, 2012; Suzuki et al., 2012). The academic focus of the available courses within
the program may include various subject areas such as math, writing, and other specific
classes related to their academic major (Sablan, 2014). This may provide students with an
initial opportunity to complete college-level coursework while focusing on just a few classes
instead of a full course load. This may help students acclimate to the structure of college
research conducted on summer bridge programs and highlight the results related to academic
success outcomes.
Research on Summer Bridge Programs
My review of the literature on summer bridge programs yielded several research
studies that focused on academic and non-academic related outcomes. I was interested in
probing into these studies to retrieve some baseline results that would help put my study into
context. Those research studies that minimally included GPA, credit hours, or retention as an
outcome were most relevant to the current study and are captured in this section. The
methodological approaches used in these studies varied with the majority only reporting
descriptive analyses of survey research or university data. Based on my interest in
implementing propensity score analysis, this literature review is organized into four
categories: research that reported results on a summer bridge program without creating a
comparison group or making statistical adjustments; research that compared the results of a
summer bridge program to a comparison group; research that implemented a statistical
adjustment (such as regression or correlation analysis); and research that implemented
experimental analysis. I focused most of my attention on academic success related outcomes
within the studies while also highlighting additional results.
No Comparison Group or Statistical Adjustment
I first reviewed three research studies that did not create a comparison group or make
statistical adjustments. Ackermann’s (1991) study on a six-week residential summer bridge
participants at the University of California, Los Angeles (UCLA). The targeted student
population for the program was underrepresented and low-income students. The program
had two primary curricular components on either mathematics or English. Ackermann’s
study focused on the results of the 1988 entering cohort of the Transfer Summer Program
(TSP). The study also mentioned a Freshman Summer Program (FSP), but the results shared
in this article focused more on the Transfer Summer Program. The difference between the
two programs besides the general population of interest was unclear. A total of 645 students
participated in either TSP or FSP during the summer of 1988. This included 75 TSP students
and 570 FSP students (Ackermann, 1991).
Ackermann (1991) tracked the 1988 TSP/FSP students during their first two quarters
at the university and collected attitudinal and academic data. To obtain attitudinal data,
Ackermann distributed a close-ended mail questionnaire. Ackermann based questionnaire
items on a five-point Likert scale. The questionnaire assessed whether the program met the
academic and non-academic goals and objectives, as well as whether the program prepared
students to participate in the classroom (Ackermann, 1991). Additionally, students rated the
quality, availability, and utilization of campus services. There was a 36% response rate for
TSP students answering the questionnaire (Ackermann, 1991).
Based on questionnaire results, students rated the fulfillment of the Transfer Summer
Program’s non-academic goals and objectives (i.e., increasing self-confidence and aiding in
the social and cultural adjustment to university life) higher than the fulfillment of the