EFFECT OF VIBRATION LOADING ON THE FATIGUE LIFE OF PART
–THROUGH NOTCHED PIPE
Rahul Mittal1, P.K.Singh2, D.M.Pukazhendi3,V.Bhasin2, K.K.Vaze2, A.K.Ghosh2 1
Nuclear Power Corporation of India Ltd, Mumbai, INDIA-400094 2
Bhabha Atomic Research Centre, Mumbai, INDIA-400085 3
Structural Engineering research centre, Chennai, INDIA E-mail of corresponding author: [email protected]
ABSTRACT
Experiments and analysis have been carried out to investigate the effect of vibration +cyclic loading on fatigue crack initiation and fatigue crack growth life of piping component. Three Point Bend (TPB) specimens have been tested for evaluation of Paris constants under vibration+cyclic and cyclic loading only as per the ASTM Standard E-647.These constants were used for predicting the fatigue life of the pipe having part through notch. Predicted results show that the life of the notched pipe subjected to vibration+cyclic loading has been reduced by 50% compared to that of cyclic loading only. Predicted results have been validated by carrying out full-scale pipe tests. Experimental results of full-scale pipe tests under vibration+cyclic loading showed the reduction in fatigue life by 70% compared to that of cyclic loading only. The analytical prediction for the crack initiation life and the crack growth behaviour were compared with that of experiments. Fractographic examination using Scanning Electron Microscope (SEM) of the tested specimens shows the higher presence of brittle phases such as martensite (in the form of isolated planar facets) and secondary micro cracks in case of specimen subjected to vibration+cyclic loading. This could be the reason for the reduction of fatigue life in pipe subjected to vibration+cyclic loading.
INTRODUCTION
Piping components are subjected to vibration loading caused by rotary equipments viz. pumps, compressors etc. These vibration loadings are of low amplitudes but extend over the lifetime of plant operation and causes severe mechanical damage that may affect the life of piping components. Vibration induced fatigue may lead to excessive pipe vibration which can cause real problems like loosening of threaded connections, leakage through flanges, knocking off the pipes from their supports. Vibration induced fatigue is a kind of high cycle fatigue that may be caused by stress vibration or thermal fluctuation. S.N.Huang [1] brought out the procedure to assess the fatigue damage of the piping systems and explained the feasibility of the estimation of piping responses resulting from pump-induced vibration with the limited test data. ASME O&M design code [2] calls for qualification of piping system in terms of velocity and deflection of the piping system subjected to the vibration during plant operation. These piping components are also subjected to higher amplitude cyclic loading due to plant startup and shut down. The effect of simultaneous occurrence of cyclic loading along with the vibration loading on piping system is not discussed in ASME.
Fatigue crack initiation has been studied in the past using notched specimens by evaluating local stress or strain at the notch tip considering the stress or strain concentration, equivalent energy density method and low cycle fatigue curve [3]. Number of cycles to crack initiation has also been reported using fracture mechanics approach.
Austenite to martensite transformation has been observed in 300 series stainless steels, which results in a reduced fatigue life [4]. The extent of the martensite transformation depends on several factors such as the chemical composition of the steel and the temperature at which the deformation taking place [5, 6, 7]. The formation of martensite during deformation at the room temperature in austenitic steel such as 304L and 304LN steel has been reported [8-11]. Strain induced martensite has a great influence on the mechanical properties viz. tensile properties, strain hardening behavior and fracture toughness.
In view of this, effect of simultaneous occurrence of vibration and cyclic loading on fatigue life of the piping components is required to be investigated for the safe operation of the plant. In the present paper, a systematic experimental and analytical study has been carried out to investigate the effect of vibration + cyclic loading on fatigue life of piping components.
EXPERIMENTAL DETAILS
The piping material under study is austenitic stainless steel SA312Type SS304LN in solution-annealed condition. The chemical composition of SS304LN is given in Table 1.The Yield strength and ultimate strength of the material is 298MPa and 620MPa respectively. Young modulus and percentage elongation of the SS304LN material is 195GPa and 69%.
Table 1: Chemical composition (in wt %) of pipe material
C Mn Si P S Mo Cr Ni Ti N Nb Cu
0.017 1.76 0.29 0.022 0.0029 0.19 18.9 9.65 0.006 0.08 0.02 0.2
Cyclic stress–strain and low cycle fatigue properties have been obtained following ASTM E606 for different strain ranges at room temperature and air environment [12, 13]. The cyclic stress– strain curve and low cycle fatigue curve are given in Eq. (1) and (2) respectively. The various constants in the equation have been obtained by fitting the test data points and given in Table 2.
/2 = 100 (/2E) + (/2k) 1/n (1)
/2 = f/E (2Ni) b + f (2Ni) c (2)
Table 2: Constants for cyclic stress strain and Low cyclic fatigue curve
k(MPa) n f(MPa) f (%) b c E(GPa)
217.36 0.3248 1116.515 33.3 0.1428 -0.5266 195
where is strain range, is stress range and Ni is the number of cycles required for failure (complete separation).
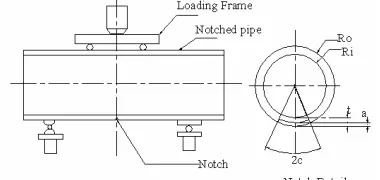
Three Point Bend specimens have been machined as per ASTM E-647 [14] from the pipe of outer diameter 168 mm and thickness 14.3mm with notch in L-C direction (L refer to load in longitudinal direction and C refer to notch in circumferential direction). Location of the specimens and crack plane orientation with respect to pipe is shown in Fig.1.The width (W), thickness (B), initial crack length (ao) TPB specimens are 20 mm, 10 mm and 5 mm respectively. These specimens were having different crack tip radius as 0.2, 0.3 and 0.5mm.
TPB specimens were fatigue tested under constant amplitude sinusoidal vibration+cyclic and cyclic loading only. The loading frequency was 20Hz for vibration loading and 2.5–5 Hz for cyclic loading. The constant amplitude load applied during the test was calculated based on the fact that the initial stress intensity factor for the TPB specimens is same as that of the notched pipe. The details of the load applied during vibration loading and cyclic loading are given in Table 3.
EXPERIMENTAL RESULTS
The fatigue crack initiation life is evaluated considering the effect of notch tip radius for vibration +cyclic loading and cyclic loading only. The details of the fatigue crack initiation results have been shown in Table 4 for TPB and pipe test. No crack initiation has been observed during the vibration loading for TPB specimens. This was confirmed by observing the notch tip of TPB specimen under optical microscope. In case of TPB specimen number of cycles for crack initiation given in Table 4 corresponds to the 0.5mm of crack growth. In case of pipe, crack initiation was assumed to occur where the measured crack growth is 0.1mm.This is the least crack length, which can be measured using the Alternating Current Potential Difference (ACPD) technique, based instruments.
Fatigue initiation life increases with increase in crack tip radius. During the experiments with TPB specimen subjected to vibration+cyclic loading and cyclic loading only, it is found that fatigue life is increased by 45% to 75% if the crack tip radius varies from 0.2-0.5mm. There is a reduction in the fatigue initiation life by 20-50% for specimens subjected to vibration+cyclic loading as compared to specimens subjected to cyclic loading only. During the Fatigue Crack Growth Rate (FCGR) tests, crack length and number of cycles were recorded. The crack length and numbers of cycles recorded for crack initiation are shown in Figs.3 and 4. Difference in fatigue life is due to the variation in crack initiation life. The variation of stress intensity range with crack growth rate is shown in Figs.5 and 6.
Crack length and number of cycles obtained experimentally have been used to calculate the Paris constants using Paris-law relationship between the crack growth rate and the stress-intensity factor range is given by Eq. (3).
da /dN = c(K)m (3)
where, da/dN = Fatigue crack growth rate (m/cycle) and K = Stress intensity factor range (MPam). da/dN and corresponding stress intensity factor ranges (K) at a point have been evaluated for given stress range and crack depth. These data of da/dN and K have been fitted to obtain Paris Law constants ‘c’ and ‘m’. The values of constant c and m obtained for TPB specimens are shown in Table 4.
Number of cycles and crack length obtained from the full scale pipe tests has been shown in Fig. 7 for vibration+cyclic and cyclic loading only. There is a variation in crack initiation life because of the varying crack tip radius. The variation in fatigue crack initiation life with crack tip radius is shown in Fig. 8.
ANALYTICAL RESULTS
Analytical studies have been carried out for fatigue crack initiation and fatigue crack growth for TPB specimen and notched pipe. The effect of the initial notch tip radius on the fatigue crack initiation life has also been considered during evaluation. Analysis involves use of cyclic stress strain curve to evaluate the strain range and corresponding number of cycles to crack initiation. Cyclic stress–strain curve and the low cycle fatigue curve required for analysis are given in Eq. 1 & 2. Two approaches estimation by Creager-Neuber’s Rule and Finite Element Analysis (FEA) have been followed for evaluating strain range () near the crack tip region.
In Creager-Neuber’s estimation scheme, in presence of blunt notch with crack tip radius ‘’ and under the action of remote stress range (o), the approximate value of maximum pseudo elastic stress range (pe), at any distance ' d ' from the notch tip can be calculated by Eq. (4) which is basically Creager's Formula.
pe ( K/ 2 r ) ( 1.0 + /2r) (4)
Where, r = d + /2.The distance d, at which the representative strain range has been evaluated, is called the characteristic distance. The characteristic distance employed in the French A-16 guide [16] is based on the hypothesis that for crack initiation from a blunt notch to occur, finite volume of the material has to undergo damage. After evaluation of pe the corresponding pseudo elastic strain range has been evaluated by Eq. (5), which approximately takes into account the state of tri-axial stress on the pseudo plastic strain range
Table 3: Experimental results for crack initiation
Maximum Applied load (KN)
K (MPam) Specimen Id. No. Type of loading Tip Radius (mm)
PL (KN)
Vibration Cyclic Vibrati on
Cyclic
Cycles (Ni)
TPB_P3 Vibration
+cyclic
0.2 17.4637 1.7464 7.25 5.99 27.39 5000
TPB_R1 Cyclic 0.3 17.4637 1.7464 7.25 5.99 27.39 12000
TPB_R2 Vibration
+cyclic
0.3 17.4637 1.7464 7.25 5.99 27.39 9000
TPB_R3 Cyclic 0.3 17.4637 1.7464 7.25 5.99 27.39 15000
TPB_S1 Vibration
+cyclic
0.5 17.4637 1.7464 7.25 5.99 27.39 20000
TPB_S2 Cyclic 0.5 17.4637 1.7464 7.25 5.99 27.39 24750
Pipe1 Vibration
+cyclic
- 645 55 258 5.99 27.39 1000
Pipe2 Cyclic - 645 55 258 5.99 27.39 5000
Vibration + cyclic means vibration loading followed by cyclic loading, Cyclic means only cyclic loading, Ni is number of
cycles to crack initiation, PL is collapse load
Table 4: Paris’s constants for TPB specimens
7500 15000 22500 30000 37500 45000 4 6 8 10 12 14 16 C ra ck g ro w th i n m m
No of Cycles TPB_P3
TPB_R2 TPB_S1
10000 20000 30000 40000 50000
4 6 8 10 12 14 C ra ck G ro w th i n m m
No. of cycles TPB_R1
TPB_S1
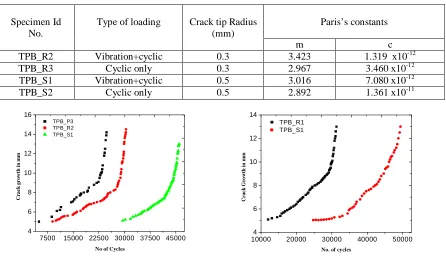
Fig.3: FCGR curve under vibration + cyclic loading Fig.4: FCGR curve under cyclic loading only Paris’s constants Specimen Id
No.
Type of loading Crack tip Radius (mm)
m c
TPB_R2 Vibration+cyclic 0.3 3.423 1.319 x10⁻¹²
TPB_R3 Cyclic only 0.3 2.967 3.460 x10⁻¹²
TPB_S1 Vibration+cyclic 0.5 3.016 7.080 x10⁻¹²
Fig.5: FCGR curve for 0.3mm crack tip radius Fig.6: FCGR curve for 0.5mm crack tip radius
o.2 0.3 0.5
4000 8000 12000 16000 20000 24000 N o . o f c y c le s f o r in it ia ti o n
Crack tip radius in mm under cyclic loading under vibration+cyclic loading
Fig.7: FCGR curve for notched pipe Fig.8: Effect of crack tip radius on crack initiation life
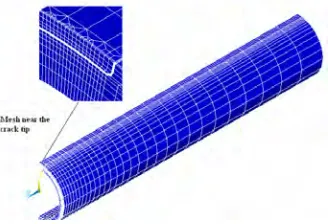
Non-linear finite element analysis was carried out on the three-dimensional (3D) solid model of notched pipe specimen. 20-noded Hexahedron Elements were used to discretize the notched pipe specimen. Only one-fourth symmetric domain was modeled. Applying normal stress boundary condition at the free edges simulated the pure bending moment. Finite element analysis was performed to evaluate distribution for the applied cyclic load. The FE model of pipe specimen is shown in Fig. 9. The force was distributed on number of nodes in order to avoid local yielding at the point of application of load. In a similar manner, support constraints were applied at a number of nodes to confirm model requirements.
The equivalent elastic-plastic strain is evaluated either from FE analysis or from the Creeger’s hypothesis as mentioned above at different’d’ distance ahead of the notch tip. The distance, at which the number of cycles corresponding to effective elastic plastic strain amplitude matches with the experimental value, is termed as ‘characteristic distance’ 10 100 1E-7 1E-6 1E-5 Vibration+Cyclic loading Cyclic loading d a/ d N ( m /c y cl e)
K, MPa-m1/2
TPB_R1_m=2.967,c=3.460 x10⁻¹² TPB_R2_m=3.423,c=1.319 x10⁻¹²
10 100 10-8 10-7 10-6 Vibration+Cyclic loading cyclic loading d a/ d N ( m /c y cl es )
K , MPa-m1/2
TPB_S1_m=3.016,c=7.080 x10⁻¹² TPB_S2_m=2.892,c=1.361 x10⁻¹¹
0 10000 20000 30000 40000 50000
2 4 6 8 10 12 14 16 C ra c k g ro w th i n m m
No of cycle
SSPB6-16 Pipe under vibration with cyclic loading
Fig.9: Finite element model of pipe specimen
No of cycles for fatigue crack initiation for vibration and cyclic loading as determined through FEA/creeger’s estimation are combined and compared with experimental result using the miner’s rule to determine the characteristic distance’d’. The Comparison of characteristic distance calculated from FEA and Creager’s estimation scheme (A-16) for notched pipe with crack tip radius () 0.1 mm has been tabulated in Table 5.The characteristic distance has been found to vary from 75 µm to 85 µm for pipe subjected to vibation+cyclic loading and characteristic distance varies from 110-120 µm for pipe subjected to cyclic loading only.
Table 5: Comparison of characteristic distance calculated from A-16 and FEA
Load(KN) Characteristic
Distance d (µm)
Specimen Id. No
a/t 2c/a
Max. Min.
Ni
A-16 FEA
-55 (V) -5.5 1000000
Pipe1 0.25 10
-258 (C) 25.8 1000
78 65
-55 (V) -5.5 1000000
Pipe2 0.25 10
-258 (C) 25.8 2000
85 78
Ni is number of cycle for fatigue crack initiation (Experimental data). V-Vibration, C-Cyclic
Crack growth in notched pipe has been evaluated using Paris-law relationship between the crack growth rate and the stress-intensity factor range, is given by equation (3). Paris constants obtained from TPB specimens has been used for calculating the crack growth in notched pipe. Analytical results for crack growth and number of cycles for notched pipe subjected to cyclic only and vibration+cyclic loading are shown in Figs.10 and 11.
Fig.10 comparison of FCGR for cyclic loading Fig.11 Comparison of FCGR for vibarion+cyclic loading
DISCUSSION
Fatigue crack initiation depends on the crack tip radius and characteristic distance as per the A16 approach [15]. Crack initiation in a material involves nucleation and formation of fine cracks. The formation of the slip planes
0 15000 30000 45000 60000
4 6 8 10 12
C
ra
c
k
G
ro
w
th
,
m
m
No. of cycles
Experiment Analytical TPB_R3 with m=2.967,c=3.46E-12
0 10000 20000 30000 40000 50000 60000 2
4 6 8 10 12
C
ra
c
k
G
ro
w
th
,
m
m
No of cycles Experiment
TPB_R2,m=3.432,c=1.319 E-12 TPB_S1,m=3.016,c=7.087 E-12 TPB_R3,m=2.967,c=3.460 E-12
Analyti
cal
Analyti
cal
Experimental
resistance reduction in the material depends on the product of stress range and number of cycles. If this product is more fracture resistance reduction would be more. Although applied load amplitude is low but the number of applied cycles during the vibration loading is large enough to cause reduction in the fracture resistance of the material [3]. Reduction in fracture resistance will lead to higher crack growth rate. The experimental and analytical results for pipes subjected to vibration+cyclic loading have been found to be in agreement, for a characteristic distance ranged from 75-85µm while it is 110-120 µm for pipe subjected to cyclic loading only.
The experimental and analytical results for crack growth in the thickness direction have been found to be in good agreement for the pipes subjected to cyclic loading. In this case, Paris constants m=2.967 and C=3.460 x10⁻¹² has been used. In case of vibration+cyclic loading, Paris constants m=3.016 and C=7.087x10⁻¹² has been used. During the fatigue test on the pipe it is found that the fatigue life of the pipe with vibration loading prior to the fatigue loading reduces. Fatigue life of the pipe using Paris constants obtained from standard specimen with vibration+cyclic loading is 20,000 cycles, which is 50% less than that of using Paris constants of specimen with cyclic loading only. This indicates that vibration loading affects the fatigue life. Paris law constants evaluated from virgin pipe will give non-conservative results if used, for pipe subjected to vibration loading. Fatigue Crack growth life using Paris constants from TPB specimens subjected to vibration+cyclic loading gives better prediction when the pipe is subjected to both low amplitude vibration loading and high amplitude cyclic loading, compared to that of cyclic loading.
Fractographic examination of the fracture surfaces of tested TPB specimens under vibration+cyclic and cyclic loading only, have been carried out under Scanning Electron Microscope (SEM) Fracture surface revealed the presence of isolated planar facets (dark patch marks). Typical fractographs of fracture surface exhibiting such features in both cases are shown in Fig.12 and Fig.13. These features basically indicate occurrence of brittle modes of fracture at local regions originating from presence of brittle phases such as martensite. This observation suggests that the martensitic transformation must have occurred during deformation at the crack tip due to cyclic loading and the formation of martensite is more dominant in the specimen subjected to vibration+cyclic loading. Fractographic examination also revealed the presence of the secondary micro cracks near the crack tip in the specimens subjected to vibration+cyclic loading as shown in Fig. 14 & 15. Finally faster crack growth in the specimen subjected to vibration+cyclic loading is attributed to the martensite formation and the secondary micro cracks.
Fig.12: Martensite phases for specimen Fig.13: Martensite phases for specimen under vibration+cyclic loading under cyclic loading only
CONCLUSIONS
The analytical and experimental results are found to be in good agreement for a characteristic distance that varies from 75 µm to 85 µm for pipe subjected to vibration+cyclic loading. Fatigue initiation life increases with increase in crack tip radius. There is a reduction in the fatigue initiation life by 20-50% for specimens subjected to vibration+cyclic loading as compared to specimens subjected to cyclic loading only.
Fatigue life of the pipe using Paris constants obtained from standard specimen with vibration +cyclic loading is 20,000 cycles, which is 50% less than that of using Paris constants of specimen with cyclic loading only. Paris law constants evaluated from virgin pipe will give non-conservative results if used, for pipe subjected to vibration loading. Fatigue life of the notched pipe subjected to vibration+cyclic loading has been found to be 70 % lower to that of notched pipe subjected to cyclic loading only. Fractographic examination confirmed the fatigue crack growth observed during test by measuring the striation spacing. Fracture surface examination also revealed that fast crack growth in the specimen subjected to vibration+cyclic loading is due to the martensite formation and the secondary micro cracks.
ACKNOWLEDGMENT
The authors wish to thank Shri Sunil Kumar, PIED, BARC for measurement of striation spacing by taking the photographs of the fatigue fracture surface under SEM, which helped in comparing the measured crack growth rate by ACPD.
REFERENCES
[1] S. N. Huang, Fatigue Evaluation of Piping Systems with Limited Vibration Test data, American standards for mechanical engineers, pressure vessel & piping conference, 1991.
[2] ASME/ANSI OMa, Standards and guides for operation and maintenance of nuclear power plants, 1987.
[3] P.K. Singh, K.K. Vaze, V. Bhasin, H.S. Kushwaha, P. Gandhi, D.S. Ramachandra Murthy, Crack initiation and growth behaviour of circumferentially cracked pipes under cyclic and monotonic loading , Int. J. of Pressure vessel and Piping, 2003 P.629–640.
[4] Klensil M. and Lukas, Fatigue of metallic material,Elsvier,Amstrerdam,1980
[5] Talonen j, Nenonen pertti, pape Gersom, hanninen Hannu, Effect of strain rate on the strain induced γ-α
marensite transformation and mechanical properties of austenite stainless steel. Met trans .36A:A421-32, 2005.
[6] Somjeet Biswas , S. Sivaprasad , N. Narasaiah , S. Tarafder , P.C. Chakraborti, Load history effect on FCGR behavior of 304LN stainless steel ,Int. J of fatigue 29, 2007, pp786-791.
[7] Paul G.Shewmon, Transformation in metals, McGraw-Hill, New York, NY, 1969, pp394.
[8] Andrade MS, Gomes OA, Vilela JMC, Serrano ATL, De Moraes JMD, Formability evaluation of two austenitic stainless steel, J. Braz Soc Mech Sci & Engg, 2004, XXVI: 47-50.
[9] Lee WS, Lin CF. Impact properties and microstructure evolution of 304L stainless steel. Mater Sci Engg ,A 2001; A308:124–35.
[10] Mei Z, Morris Jr JW. Influence of deformation induced martensite on fatigue crack propagation in 304 type steels. Met Trans 1990; 21A:3137–52.
[11] X. F. Fang and W. Dahl, Strain hardening and transformation mechanism of deformation induced martensite transformation in metastable austenitic stainless steels, mat. Science and metallurgy, A141, 1991, pp 189-198.
[12] J.S.Dubey, J.K.Chakarbati, D.N.Shah, Deformation, fatigue and fracture behaviour of type304LN stainless steel and weld, Int. conference of Pressure vessel and piping, Chennai, Feb7-9,2006