University of Windsor University of Windsor
Scholarship at UWindsor
Scholarship at UWindsor
Electronic Theses and Dissertations Theses, Dissertations, and Major Papers
2012
Investigating the Susceptibility of Jarosite Minerals to Reductive
Investigating the Susceptibility of Jarosite Minerals to Reductive
Dissolution by a Dissimilatory Metal Reducing Bacterium
Dissolution by a Dissimilatory Metal Reducing Bacterium
(Shewanella putrefaciens CN32)
(Shewanella putrefaciens CN32)
Christina Smeaton
University of Windsor
Follow this and additional works at: https://scholar.uwindsor.ca/etd
Recommended Citation Recommended Citation
Smeaton, Christina, "Investigating the Susceptibility of Jarosite Minerals to Reductive Dissolution by a Dissimilatory Metal Reducing Bacterium (Shewanella putrefaciens CN32)" (2012). Electronic Theses and Dissertations. 450.
https://scholar.uwindsor.ca/etd/450
This online database contains the full-text of PhD dissertations and Masters’ theses of University of Windsor students from 1954 forward. These documents are made available for personal study and research purposes only, in accordance with the Canadian Copyright Act and the Creative Commons license—CC BY-NC-ND (Attribution, Non-Commercial, No Derivative Works). Under this license, works must always be attributed to the copyright holder (original author), cannot be used for any commercial purposes, and may not be altered. Any other use would require the permission of the copyright holder. Students may inquire about withdrawing their dissertation and/or thesis from this database. For additional inquiries, please contact the repository administrator via email
Investigating the Susceptibility of Jarosite Minerals to Reductive Dissolution by a
Dissimilatory Metal Reducing Bacterium (Shewanella putrefaciens CN32)
by
Christina M. Smeaton
A Dissertation
Submitted to the Faculty of Graduate Studies
through the Great Lakes Institute for Environmental Research
in Partial Fulfillment of the Requirements for
the Degree of Doctor of Philosophy at the
University of Windsor
Windsor, Ontario, Canada
2012
Investigating the Susceptibility of Jarosite Minerals to Reductive Dissolution by a Dissimilatory Metal Reducing Bacterium (Shewanella putrefaciens CN32)
by
Christina M. Smeaton
APPROVED BY:
______________________________________________ Dr. G. Southam, External Examiner
Department of Earth Sciences, University of Western Ontario
______________________________________________ Dr. C. Macdonald
Department of Chemistry and Biochemistry
______________________________________________ Dr. K. Drouillard
Great Lakes Institute for Environmental Research
______________________________________________ Dr. J. Gagnon
Great Lakes Institute for Environmental Research
______________________________________________ Dr. C. Weisener, Co-Advisor
Great Lakes Institute for Environmental Research
______________________________________________ Dr. B. Fryer, Co-Advisor
Great Lakes Institute for Environmental Research
______________________________________________ Dr. Daniel J. Britten, Chair of Defense
Mathematics and Statistics
iii DECLARATION OF CO-AUTHORSHIP / PREVIOUS PUBLICATION
I. Co-Authorship Declaration
I hereby declare that this thesis incorporates material thatis the result of joint
research, as follows:
This thesis incorporates the outcome of joint research undertaken in collaboration
with Karen Hudson-Edwards, Adrian Smith, William Dubbin, Andrew Beale under the
supervision of Christopher Weisener and Brian Fryer. The collaboration is covered in
Chapter 3 of this dissertation. In all cases, the key ideas, primary contributions,
experimental designs, data analysis and interpretation, were performed by the author, and
the contribution of co-authors was primarily through the provision of samples and
comments on earlier drafts of the manuscript. The only exception is the EXAFS
methodology and data analysis presented in the Supporting Information Section in
Chapter 3, which was provided by Andrew Beale to provide background information
regarding the experimental sample (2nd paragraph of S3.4, S3.6, Figure S3.11).
I am aware of the University of Windsor Senate Policy on Authorship and I
certify that I have properly acknowledged the contribution of other researchers to my
thesis, and have obtained written permission from each of the co-author(s) to include the
above material(s) in my thesis.
I certify that, with the above qualification, this thesis, and the research to which it
iv
II. Declaration of Previous Publication
This thesis includes 3 original papers that have been previously published/submitted for publication in peer reviewed journals, as follows:
Thesis Chapter Publication title/full citation Publication status*
Chapter 2 Smeaton, C. M.; Fryer, B. J.; Weisener, C. G.,
Intracellular Precipitation of Pb by Shewanella
putrefaciens CN32 during the Reductive Dissolution of Pb-Jarosite. Environ. Sci. Technol. 2009,43, (21), 8091-8096.
Published
Chapter 3 C.M. Smeaton, G.E. Walshe, A.M.L. Smith,
K.A. Hudson-Edwards, W.E. Dubbin, K. Wright, A.M. Beale, B.J. Fryer and C.G. Weisener. Simultaneous reduction of Fe and As during the reductive dissolution of Pb-As
jarosite by Shewanella putrefaciens CN32
Submitted to Environmental
Science & Technology
Chapter 4 C.M. Smeaton, G.E. Walshe, B.J. Fryer and
C.G. Weisener. Reductive dissolution of
Tl(I)-jarosite by Shewanella putrefaciens: Providing
new insights into Tl biogeochemistry
Submitted to Environmental
Science & Technology
I certify that I have obtained a written permission from the copyright owner(s) to
include the above published material(s) in my thesis. I certify that the above material
describes work completed during my registration as a graduate student at the University
of Windsor.
I declare that, to the best of my knowledge, my thesis does not infringe upon
v
quotations, or any other material from the work of other people included in my thesis,
published or otherwise, are fully acknowledged in accordance with the standard
referencing practices. Furthermore, to the extent that I have included copyrighted
material that surpasses the bounds of fair dealing within the meaning of the Canada
Copyright Act, I certify that I have obtained a written permission from the copyright
owner(s) to include such material(s) in my thesis.
I declare that this is a true copy of my thesis, including any final revisions, as
approved by my thesis committee and the Graduate Studies office, and that this thesis has
vi ABSTRACT
Jarosite-group minerals (AFe3(TO4)2(OH)6)typically form under acidic (pH <
3.5), oxidizing, ferric and sulfate rich conditions and commonly occur in the oxidized
portion of sulfide deposits, hydrometallurgical wastes, acid sulfate soils and
environments contaminated by acid rock or acid mine drainage. Jarositic wastes are
typically stored in disposal ponds under circum-neutral conditions, thereby rendering the
mineral phase unstable and susceptible to reductive dissolution through Fe(III) reduction
by microbial populations under reducing conditions. The primary goal of this dissertation
was to examine the susceptibility of a variety of jarosite-group minerals to microbial
Fe(III) reduction and to examine the potential for enhanced metal release as compared to
control samples during dissolution.
Experiments were conducted by incubating a variety of synthetic and natural
jarosites with the facultative anaerobe, Shewanella putrefaciens strain CN32 using lactate
as the sole electron donor. Incubations ranged from 336 to 900 hours and solution
chemistry, including elemental concentrations, Fe and As oxidation state, Eh and pH
were monitored over time. Changes in solid phase, including secondary precipitation,
were characterized using environmental scanning electron microscopy (ESEM) and
transmission electron microscopy (TEM) coupled with energy dispersive spectroscopy
(EDS). X-ray absorption spectroscopy (XAS) was also used to examine simultaneous Fe
and As reduction during the reductive dissolution of a Pb-As jarosite.
Results revealed that abiotic and biotic dissolution of jarosites are both
incongruent reactions with the former consuming H+ and the latter producing H+. Fe(II)
vii
jarosites to microbial Fe(III) reduction was influenced primarily by structure with
susceptibility increasing in monovalent A-site substituted jarosites (K, Tl and Na).
Moreover, parallel experiments with synthetic and natural jarosites demonstrated that
reductive dissolution was greater in the synthetic samples. Enhanced release of structural
constituents, such as Tl, Sr and As, was observed in inoculated samples as compared to
control samples. Based on the instability of jarosite-group minerals under anaerobic
circum-neutral conditions, however, it is expected that both abiotic and biotic processes
will contribute to the release of structural constituents such as Tl and As into the
viii DEDICATION
This dissertation is dedicated to my wonderful husband, Steve, who has seen the first year
of our marriage consumed by my thesis writing turmoil. His unconditional love, sense of
humour, support and patience has provided me with the strength and perseverance to
ix ACKNOWLEDGEMENTS
I read once that it takes a village to raise a Ph.D. student and I couldn't agree
more. I've benefited tremendously through my interactions with various people
throughout my years at GLIER for which I am eternally grateful. All of this would not be
possible without the continuous guidance, patience and support of my advisors Brian
Fryer and Chris Weisener. I am also sincerely grateful to my committee members Dr.
Ken Drouillard, Dr. Joel Gagnon and Dr. Charles Macdonald for their support. Thank
you to Paul Pohwat at the Smithsonian National Museum of Natural History for
providing the natural jarosite samples. I would also like to thank Marcia Reid, Carmen
Andrei and Andreas Korinek at McMaster University for their assistance with TEM
sample preparation and analyses. A special thank you to Dale Brewe, Robert Gordon,
Steve Heald and Mike Pape for their assistance at the PNC/XSD 20BM beamline at the
Advanced Photon Source at Argonne National Laboratory. Thank you to Karen
Hudson-Edwards at the Birbeck, University of London for providing the Pb-As sample (Chapter
3) and for her insightful comments and help with Chapter 3.
During my years at GLIER I've been fortunate to meet and work with a lot of
wonderful people whom I will miss dearly. I thank Sharon Lackie for all of her help with
the SEM and BET and for her friendship over the years. I am also indebted to J.C.
Barrette for his timely ICP-OES analyses of my 1000+ samples. Thank you to Mary Lou
Scratch for all of her administrative help and pep talks. I have no idea what GLIER
would do without her. I also express my appreciation to all of my friends and lab mates
at GLIER who helped keep me sane both in and out of the lab all of these years and
x
Shaheen, Zhaoping Yang, Bailey McMeans, Sandra Ellis, Desiree Chevalier, Kyle
Wellband, Gillian Walshe, Nadine Loick, Matt Smith, Ernest Chi Fru, Lei Zhang and
Eric Buan. An additional thank you to all of the undergraduates who have passed through
the Weisener Lab over the years and have given their time (and weekends) to help me
including: Michael Babechuk, Steve Holland, Matt Brzozowski, Siddarth Joshi, Candace
McCort, Michael Dufour, and Megan Goetz. A special thank you to my cat, Cheeky, and
my dog, Ella Muffin, for helping to keep me sane during the long dark days of writing. I
am also grateful to Geoff (my first chemistry professor) and Marelene Rayner-Canham,
for their undying support over the years. Lastly and with no less importance, I would like
to thank my family for their patience, I know to them it seems like I've been in school
forever (and I have) and I've missed many recent special occasions but their love,
understanding and unwavering support has made it that much more possible to make this
dream a reality. An extra special thank you to my mother Valerie Smeaton who has
always believed in me and despite her own health battles, continually instilled in me from
xi TABLE OF CONTENTS
DECLARATION OF CO-AUTHORSHIP / PREVIOUS PUBLICATION ... iii
ABSTRACT ... vi
DEDICATION ... viii
ACKNOWLEDGEMENTS ... ix
LIST OF TABLES ... xiv
LIST OF FIGURES ... xvii
CHAPTER 1- Introduction ... 1
1.1 JAROSITE STRUCTURE ... 2
1.2 JAROSITE FORMATION ... 4
1.3 JAROSITES AND THE ZINC INDUSTRY ... 5
1.4 MARTIAN JAROSITE ... 6
1.5 JAROSITE AND THE ENVIRONMENT ... 8
1.6 DISSIMILATORY METAL REDUCTION ... 9
1.7 REDUCTIVE DISSOLUTION OF JAROSITES ... 11
1.8 THESIS OUTLINE ... 12
1.9 REFERENCES ... 17
CHAPTER 2 -Intracellular precipitation of Pb by Shewanella putrefaciens CN32 during the reductive dissolution of Pb-jarosite...25
2.1 INTRODUCTION ... 26
2.2 MATERIALS AND METHODS ... 27
2.2.1 Preparation of the Pb-jarosite/ cell suspensions and sampling procedures. ... 27
2.2.2 Cell Viability ... 29
2.3 RESULTS AND DISCUSSION ... 29
2.3.1 Control Experiments. ... 29
2.3.2 Microbial reduction of Pb-jarosite. ... 30
2.3.3 Fate of Pb. ... 33
2.4 SUPPORTING INFORMATION ... 43
2.5 REFERENCES ... 56
xii
Pb-As jarosite by Shewanella putrefaciens CN32 ... 61
3.1 INTRODUCTION ... 62
3.2 MATERIALS AND METHODS ... 64
3.2.1 Preparation of Pb-As-jarosite/Cell Suspensions and Sampling Protocol. ... 64
3.2.2 Solid phase characterization. ... 65
3.2.3 Aqueous phase analysis. ... 66
3.2.4 Thermodynamic Modeling ... 66
3.2.5 Calculation of ΔG°f for Pb-As jarosite, ΔG°rxn and ΔG for the redox couples 67 3.3 RESULTS AND DISCUSSION ... 68
3.3.1 Control Samples. ... 68
3.3.2 Inoculated Samples. ... 70
3.3.3 Standard versus Reaction state Thermodynamic Favorability. ... 73
3.3.4 Arsenate reduction mechanism. ... 75
3.3.5 Fate of As and Pb... 78
3.3.6 Environmental Implications. ... 79
3.4 SUPPORTING INFORMATION ... 85
3.5 REFERENCES ... 107
CHAPTER 4 - Reductive dissolution of Tl(I)-jarosite by Shewanella putrefaciens: Providing new insights into Tl biogeochemistry ... 113
4.1 INTRODUCTION ... 114
4.2 MATERIALS AND METHODS ... 117
4.2.1 Preparation of Tl-jarosite/Cell Suspensions and Sampling Protocol. ... 117
4.2.2 Tl sorption and toxicity experiment... 119
4.3 RESULTS AND DISCUSSION ... 119
4.3.1 Tl sorption experiment... 119
4.3.2 Tl-jarosite Control Samples. ... 124
4.3.4 Microbial Reduction of Tl-jarosite. ... 128
4.3.5 Influence of pH. ... 131
4.3.6 Environmental Implications. ... 132
4.4 SUPPORTING INFORMATION ... 137
xiii
CHAPTER 5 - Comparing the susceptibility of natural and synthetic jarosite-group
minerals to reductive dissolution by Shewanella putrefaciens CN32 ... 157
5.1 INTRODUCTION ... 158
5.2 MATERIALS AND METHODS ... 161
5.2.1 Jarosite Synthesis and Natural Jarosite Information... 161
5.2.2 Characterization of Jarosites ... 162
5.2.3 Preparation of Jarosite/Cell suspensions ... 163
5.2.4 Sampling Protocol. ... 164
5.3 RESULTS ... 164
5.3.1 Characterization of Synthetic and Natural Jarosites ... 164
5.3.1.2 Natural Jarosites. ... 166
5.3.2 Abiotic and Reductive Dissolution of Synthetic and Natural Jarosites ... 168
5.4 DISCUSSION ... 177
5.4.1 Surface area. ... 177
5.4.2 Structural Constraints on Fe reduction. ... 179
5.4.3 Toxicological Constraints on Fe reduction. ... 180
5.4.4 Additional Factors. ... 181
5.5 CONCLUSIONS ... 182
5.6 REFERENCES ... 196
CHAPTER 6 - Discussion and Conclusions ... 201
6.1 SUMMARY ... 202
6.2 DISCUSSION ... 205
6.3 CONCLUSIONS ... 208
6.4 REFERENCES ... 213
APPENDIX A ... 214
xiv LIST OF TABLES
Table 1.1 Minerals of the jarosite subgroup and their corresponding synthetic analogues
...15
Table S2.1 Measured chemical parameters used in React (GWB 7.01) for the control
experiments at Time 0 and 48 hours...48
Table S2.2 Predicted saturation indices (log Q/K) of hematite, goethite and Fe(OH)3
during the abiotic dissolution of Pb-jarosite at 0 and 48 hours...48
Table S2.3 Measured chemical parameters used in React (GWB 7.01) for the biotic
experiments at 0, 48 and 768 hours...48
Table S2.4 Predicted saturation indices (log Q/K) during the microbial dissolution of
Pb-jarosite at 0, 48 and 768 hours...49
Table S2.5 Relative elemental concentrations (wt %) corresponding to locations denoted
as 1-5 in Figure 4A...49
Table 3.1 Standard State Gibbs Free Energy for Pertinent Redox Reactions...81
Table S3.1 Gibbs Free Energy of Formation for Reaction Constituents...91
Table S3.2 Measured chemical parameters and log activities used in React (GWB 7.01)
for the control and inoculated Pb-As jarosite samples at 336 hours...91
Table S3.3 Predicted saturation indices (log Q/K) of potential secondary precipitates
using calculated activities of control and inoculated Pb-As jarosite samples at
336 hours...92
Table S3.4 GWB predicted moles of Pb and As aqueous and surface species...92
Table S3.5 Locations of spectra collected during TEM-EDX analysis and corresponding
xv
Table S3.6 SEM-EDS Analysis of relative elemental weight percent and standard
deviation (n=3) of bulk Pb-As jarosite at randomly selected areas over time
...93
Table S3.7 Parameters derived from the EXAFS fitting of the Fe and As K-edges shown
for the Pb-As jarosite sample...93
Table S4.1 Initial, final and differences in concentrations of Tl in the control (i.e., no
cells), autoclaved cells and viable cells at pH ~ 5 and 6. The variation of
differences among the treatments were analyzed were not significant
(ANOVA, p < 0.05) pH 7, p = 0.333 and pH 6 , p= 0.948...140
Table S4.2 Measured chemical parameters and log activities used in React (GWB 7.01)
for the control and inoculated experiments at 893 hours...140
Table S4.3 Predicted saturation indices (log Q/K) of hematite, goethite, Fe(OH)3 and
thallium jarosite during the abiotic dissolution Tl-jarosite at 853
hours...141
Table S4.4 Predicted saturation indices (log Q/K) of hematite, magnetite,
schwertmannite, goethite and Fe(OH)3 at 893 hours during the biotic
dissolution Tl-jarosite...141
Table 5.1 Identity of jarosite samples determined by X-ray powder diffraction analysis
and calculated chemical formulas of jarosites...183
Table 5.2 Potential % occupancy of the A, B and T sites within the jarosite-group
minerals based on the formula: A1-x(H3O)xB3-y(OH)6-3y(H2O)3y(TO4)2 whereby
xvi
potential constituent concentrations are normalized to molar S concentrations
as determined by ICP-OES...183
Table 5.3 Elemental Concentrations (ppm) of 50 mg of acid digested jarosite minerals
...184
Table 5.4 BET surface area, Fe(II)aq release rate and % Total Fe reduction of Syn1,
Syn2, Nat1 and Nat2 samples...184
Table 5.5 Relative elemental concentrations (wt%) from EDS analysis of randomly
selected Syn1 (n=5), Syn2 (n=6), Nat1(n=4) and Nat2 (n=4) crystals...185
Table 6.1 Fe(II) production rates based on linear regression analysis of measured Fe(II)
concentrations in the first 72 hours normalized to initial ATP concentrations
xvii LIST OF FIGURES
Figure 1.1 Crystal structure of K-jarosite...2
Figure 1.2 pe-pH diagram for Fe-S-K-O-H system at 25°C...16
Figure 2.1 (A) Aqueous Fe(II) and Fe(III) release in the control and inoculated
Pb-jarosite samples as a function of time; (B) Aqueous Pb release in the control
and inoculated Pb-jarosite samples as a function of time. Error bars represent
standard error (n=3)...40
Figure 2.2 BSE-SEM images of control Pb-jarosite (left) and inoculated Pb-jarosite
(right) as a function of time; (A) and (B) =0 h, (C) and (D) = 16 h, (E) and
(F) = 768 h...41
Figure 2.3 A) TEM images of a cross section of Shewanella putrefaciens. Numbers 1-5
denote areas of EDS analysis. B) HR-TEM image of an electron dense
intracellular precipitate. Square denotes area of crystallinity...42
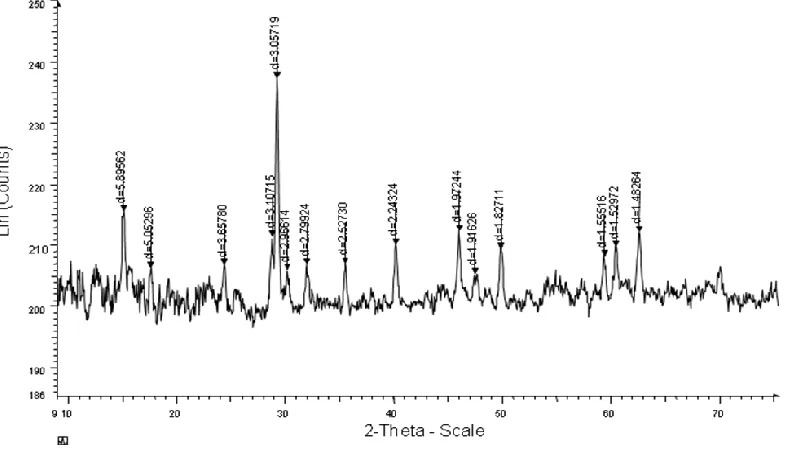
Figure S2.1 XRD pattern for synthesized Pb-jarosite. The reference D-spacings for
synthetic Pb-jarosite (ICCD PDF 37-0759) are indicated on the graph.
...50
Figure S2.2 BSE image of secondary mineral precipitates associated with A) control
Pb-jarosite and B) inoculated Pb-Pb-jarosite at 408 hours...51
Figure S2.3 BSE-SEM image of inoculated Pb-jarosite at 408 h taken at 25 kV; (A)
Cross hair denotes location of EDX analysis and is representative of the
surface of the Pb jarosite (i.e. in the absence of secondary precipitate); (B)
xviii
thickest part of the secondary precipitate; (C) EDX spectra of chosen area
(cross hair) in A, inlaid table is the relative wt% and at% elemental
concentrations of O, S, Fe and Pb. (D) EDX spectra of chosen area (cross
hair) in B, inlaid table is the relative wt% and at% elemental concentrations
of O, S, Fe and Pb. ...52
Figure S2.4 Redox potential (Eh) as a function of time. Error bars represent standard
error. n = 3 for samples containing Pb-jarosite. n=2 for control and
inoculated media sample...53
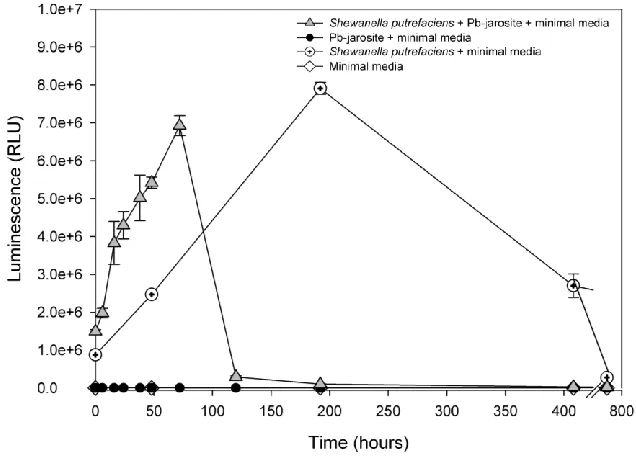
Figure S2.5 Luminescence (RLU) as a function of time. Luminescence is used as a proxy
for cell viability (see S4 in Supplemental Information for more details).
Error bars represent standard error. n= 3 for samples containing Pb-jarosite.
n=2 for control and inoculated media samples...54
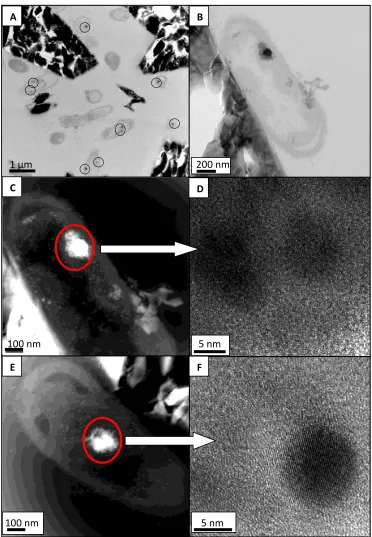
Figure S2.6 A) TEM image of S. putrefaciens CN32 associated with Pb-jarosite at 48
hours. Black circles highlight intracellular Pb precipitates; B) TEM image of
S. putrefaciens associated with the surface of Pb-jarosite; C) Corresponding
STEM image of image B; D) HR-TEM image of the electron dense
crystalline intracellular precipitate denoted with a circle in image C; E)
STEM image of S. putrefaciens associated with the surface of Pb-jarosite; F)
HR-TEM image of the electron dense intracellular precipitate denoted with
a circle in image E...56
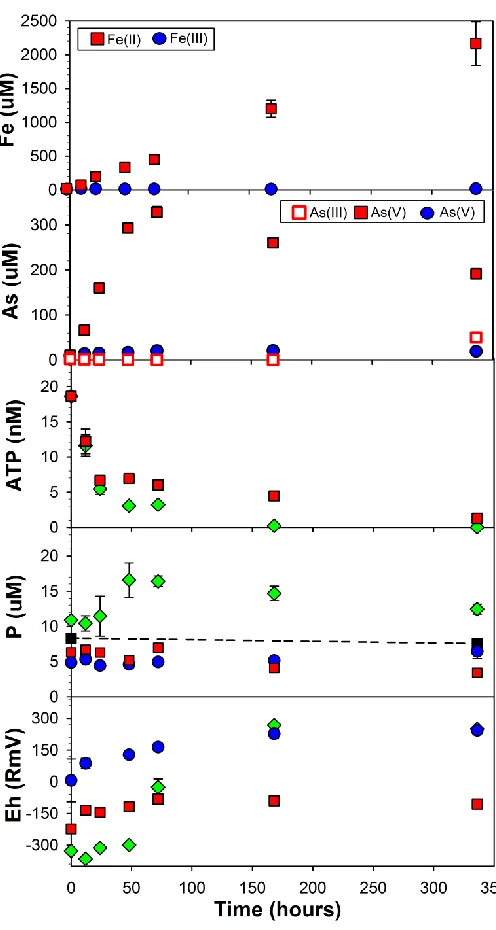
Figure 3.1 Redox potential, ATP concentrations and release of aqueous Fe (II/III),
xix
Pb-As jarosite control, and inoculated Pb-As jarosite over time. Error bars
represent standard error (n=3)...82
Figure 3.2 Normalized A) absorbance As K-edge and B) first derivative Fe K-edge
XANES spectra for inoculated Pb-As jarosite samples over time...83
Figure 3.3 A) SE-SEM image of secondary mineral precipitates associated with
inoculated Pb-As jarosite at 336 hours, and TEM images of B) S. putrefaciens
associated with secondary minerals at 72 hours; C) secondary precipitates at
336 hours and the ; D) corresponding HR-TEM image of the precipitate; E)
and F) TEM-EDS Pb and As maps of a cross sectioned S. putrefaciens cell at
336 hours. Maps of P, Fe and O of the same cell are found in SI Figure S10.
...84
Figure S3.1 Comparison of A) As-K and B) Fe K-edge XANES spectra on standards
(red line), inoculated (black line) and control (blue line) Pb-As jarosite
samples over time. Red arrows in (A) mark the shift in the As-K edge in
inoculated samples and the emergence of an As(III) shoulder at 168 and 336
hours. Note: the inoculated data corresponds to the same spectra presented in
Figure 3.2 of the main document...94
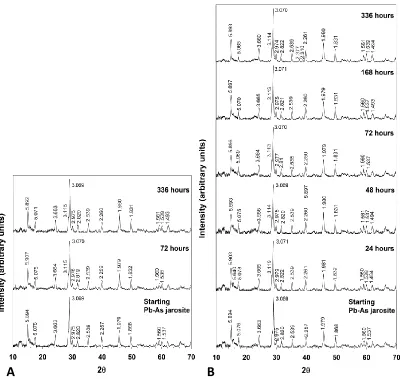
Figure S3.2 Powder X-ray diffraction patterns of A) control, and B) inoculated Pb-As
jarosite samples taken at selected time intervals...95
Figure S3.3 TEM images of control Pb-As jarosite samples at 336 hours. Ovals
correspond to the area of secondary precipitates magnified in images B and D.
Spectrum numbers in B and D denote areas of EDS analysis corresponding to
xx
Figure S3.4 Corresponding EDS spectra of areas denoted as Spectrum 1, 2, 3 and 4...97
Figure S3.5 ΔGrxn calculated for aqueous As(V), structural and aqueous Fe(III)
coupled to lactate oxidation based on experimental conditions over time.
...98
Figure S3.6 A) BSE-SEM image of inoculated Pb-As jarosite at 0 h and B) SE-SEM
image of inoculated Pb-As jarosite at 336 hours...99
Figure S3.7 TEM-EDS elemental maps of secondary precipitates in the inoculated
Pb-As jarosite sample at 336 hours...100
Figure S3.8 A) STEM image of secondary precipitate taken at 336 hours, and B) EDS
spectra of area labeled Spectrum 1 and the inlaid table is the relative wt%
and at% elemental concentrations of O, P, Fe and As. Note: C and Cu peaks
at 1 and 8.01 keV were not labeled due to contribution from formvar grids
and carbon coating...101
Figure S3.9 TEM-EDS elemental maps of a cross sectioned S. putrefaciens cell at 0
hours...102
Figure S3.10 TEM-EDS elemental maps of a cross sectioned S. putrefaciens cell
at 336 hours...103
Figure S3.11 (a) Fitted Fe K-edge EXAFS and (b) associated FT. In (c) and (d) are
shown the fitted As K-edge EXAFS and FT...104
Figure 4.1 SP, CF and AC denotes viable S. putrefaciens cells, cell-free and autoclaved
cell samples, respectively. A) Intracellular ATP in viable S. putrefaciens +
minimal media Tl-free and Tl-spiked sorption samples at pH ~ 5 and 6 as a
function of time; B) Redox potential (Eh) and pH in viable S. putrefaciens,
xxi
cell-free and autoclaved S. putrefaciens Tl-jarosite samples over time; C)
Aqueous Tl concentrations in Tl-jarosite samples containing viable S.
putrefaciens and intracellular ATP concentrations in viable S. putrefaciens +
minimal media (MM) and viable S. putrefaciens + Tl-jarosite samples over
time; and D) Aqueous Tl and Fe(II) concentrations in viable S. putrefaciens,
cell-free and autoclaved S. putrefaciens Tl-jarosite samples over time. Error
bars represent standard error (n=3)...134
Figure 4.2 Backscattered-electron (BSE) image of the inoculated (viable) Tl-jarosite
samples at (A) 0 and (C) 893 hours; and the control (cell-free) Tl-jarosite
samples at (B) 0 and (D) 893 hours...135
Figure 4.3 Backscattered-electron (BSE) images of S. putrefaciens associated with the
surface of Tl-jarosite samples and secondary mineral precipitates at (A) 493
and (B),(C) 893 hours; and (D) a secondary Tl precipitate at 893 hours
identified as a thallium sulfate...136
Figure S4.1 Optical density (OD600) in the inoculated Tl-free control and Tl-spiked
sorption samples at pH ~ 5 and 6 as a function of time. Error bars represent
standard error (n=3)...142
Figure S4.2. Release of K, Mg and Ca over time...143
Figure S4.3 Digital photographs of: A) autoclaved cells and Tl-jarosite, B) Tl-jarosite
and S. putrefaciens and C) cell-free Tl-jarosite at 893 hours...144
Figure S4.4 A) Backscattered-electron (BSE) image of the cell-free Tl-jarosite control
samples taken at 10 kV at 168 hours and; B) 893 hours C) Magnified BSE
image of area denoted as a white square in image A; and D) Corresponding
xxii
Figure S4.5 (A) BSE-SEM image of a secondary precipitate in the cell-free inoculated
Tl-jarosite at 893 h taken at 25 kV, red square denotes location of EDX
analysis and (B) EDX spectra of chosen area (red square) in A, inlaid table is
the relative wt% and at% elemental concentrations of O and Fe...146
Figure S4.6 (A) BSE-SEM image of a secondary precipitate in the inoculated (viable)
Tl-jarosite at 893 h taken at 25 kV, red square denotes location of EDX
analysis and (B) EDX spectra of chosen area (red square) in A, inlaid table
is the relative weight % and atomic % elemental concentrations of O and Fe.
...147
Figure S4.7 BSE-SEM image of secondary mineralization associated with the inoculated
(viable cells) Tl-jarosite at 10 kV taken at : (A) 493 hours and (B) 893
hours. White square denoted location of EDX analysis ; and (C) EDX
spectra taken at 25 kV of chosen area (white square) from image (A), inlaid
table is the relative atomic % elemental concentrations; (D) EDX spectra
taken at 25 kV of chosen area (white square) in B, inlaid table is the relative
atomic at% elemental concentrations. The Na and Cl peaks are likely
contributed by the background minimal media...148
Figure 5.1 Powder X-ray diffraction spectrum of A) synthetic jarosite (Syn1); B)
synthetic K- jarosite (Syn2); C) natural jarosite (Nat1); and D) natural jarosite
(Nat 2)...186
Figure 5.2 Back-scattered scanning electron (BS-SEM) images of the jarosite-group
xxiii
Figure 5.3 A) BSE-SEM image of a secondary mineral phase associated with natural
jarosite, Nat1 taken at 30 kV; B) Relative elemental concentrations (wt %) of
spectra taken from the locations denoted as 1, 2 and 3 in A; (C) EDS spectra
taken at 30 kV of area denoted as 1 from image A; and (D) EDS spectra taken
at 30 kV of area denoted as 3 in A...188
Figure 5.4 A and B) BSE-SEM image of accessory minerals associated with natural
sample, Nat2. Red cross-hair denotes the accessory mineral and the area of
location of EDS analysis; and (C) EDX spectra taken at 30 kV from the
location denoted by red cross-hair in image A, inlaid table is the relative
elemental concentrations (wt %); (D) EDX spectra taken at 30 kV from the
location denoted by the red cross-hair in image B, inlaid table is the relative
elemental concentrations (wt %)...189
Figure 5.5 SP denotes samples inoculated with S. putrefaciens. pH in A) control; and B)
inoculated jarostite samples over time. Redox potential (Eh) in C) control;
and D) inoculated jarosite samples over time. Error bars represent standard
error (n=3)...190
Figure 5.6 SP denotes samples inoculated with S. putrefaciens. Aqueous S
concentrations in A) control; and B) inoculated samples over time. Aqueous
K concentrations in C) control; and D) inoculated jarosite samples over time.
Redox potential (Eh) in C) control; and D) inoculated jarosite samples over
time; E) Aqueous Fe(II) production in inoculated samples over time. Error
xxiv
Figure 5.7 SP denotes samples inoculated with S. putrefaciens. Aqueous A) Sr; B) As;
C) P; D) Ba; and E) Zn concentrations in control and inoculated samples over
time. Note the different scales; F) ATP concentrations in inoculated samples
over time. Error bars represent standard error (n=3)...192
Figure 5.8 BS-SEM images of inoculated jarosites at A,C,E,G) Time 0 and; B, D, F, H)
720 hours. Note: sample code is indicated on the image. ...193
Figure 5.9 BS-SEM images of inoculated jarosites of A) Syn1; B) Syn2; C) Nat1; and D)
Nat2 at 720 hours...194
Figure 5.10 BS-SEM images of inoculated Nat1 at 720 hours. Note the electron dense
precipitate associated with the cell...195
Figure 6.1 Aqueous A) Fe(II) concentrations; and B) Elemental substituents released
over time across the jarosites studied. Values were normalized to initial ATP
concentrations and mass of jarosite samples and error bars represent standard
error (n =3) and take into account variation from initial ATP concentrations,
sample mass and ICP-OES measurements...211
Figure 6.2 pH of A) inoculated jarosites; and B) control jarosites over time across the
suite of jarosite samples studied. Error bars represent standard error (n =3)
1 CHAPTER 1
2 1.1 JAROSITE STRUCTURE
Jarosite, KFe3(SO4)2(OH)6, was first described in 1852 by the German
mineralogist August Breithaupt in Barranco del Jaroso (Jaroso Ravine) in the Sierra
Almagrera mountain range along the southeastern coast of Spain.1 Jarosite is an iron
hydroxysulfate mineral and is a member of the isostructural alunite-jarosite mineral
super group with a general formula of AB3(TO4)2(OH)6. The A sites are occupied by
monovalent (e.g. K+, Tl+ and Na+ ) and divalent cations (e.g. Ca2+ and Pb2+) with
coordination numbers ≥ 9. B represents cation sites with octahedral (O) coordination,
typically Al3+ or Fe3+ , while the T position corresponds to tetrahedral (T) coordination
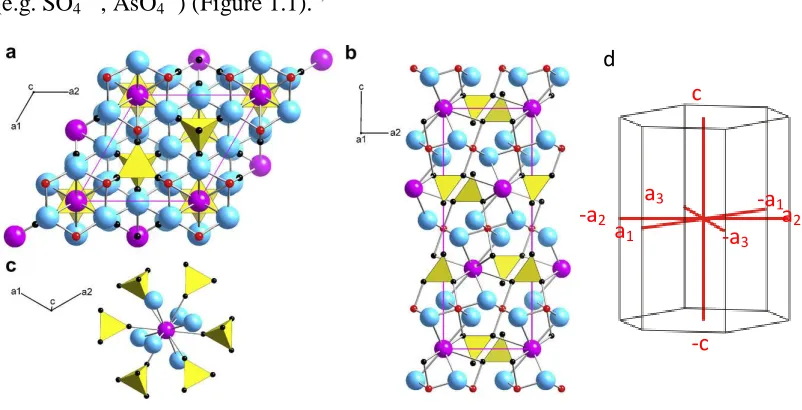
(e.g. SO42- , AsO43-) (Figure 1.1).2,3
Figure 1.1. Crystal structure of K-jarosite.
The A site is represented by magenta (K) atoms, B site by red (Fe3+) atoms, T site by
yellow (SO42-) tetrahedra. Oxygen atoms are represented by black and hydroxyl groups
are blue spheres. The unit cell is outlined in magenta. (a) Projection down the c-axis, (b)
Projection down the a-axis, (c) The A site, separated from the crystal structure, (d)
c
-a3
-c
a3 -a1
a1 a2
3
Jarosite trigonal-pyramidal crystal system and axial configurations. Modified from
Burger et al. (2009)4 and webmineral.com.
Jarosite is commonly referred to as an elemental "garbage bucket" because it can
incorporate a large number of elements into its structure and can undergo solid phase
substitution with respect to its chemical composition. With these attributes, it is often
expected to reflect the chemical signature of the fluids from which it was formed.1 The
relative environmental stability of synthetic jarosites over other potential waste mineral
hosts, such as apatites and pyrochlores, has made synthetic jarosites a potential
candidate for the long term disposal of toxic metals such as As, Pb, Bi, Hg, Tl, Sb, Cr,
Se and radioactive isotopes of K, Sr, Th, U and rare earth elements (REE).5,6 A list of
several jarosite-group minerals and their synthetic counterparts are listed in Table 1.2.
Jarosite minerals exhibit a rhombohedral symmetry, space group R3m, with a hexagonal
cell and parameters a ~ 7 Å, c ~ 17 Å.7
The stability and reactivity of jarosites is related to the degree of substitution in
the A and B structural sites. Deficiencies in the A (e.g., K+) and B (e.g., Fe3+) sites
result in a lack of positive charge. Therefore, deficiency in the A site is balanced by
incorporation of hydronium ions (H3O+) and is reported to occur in most natural
potassium and sodium jarosites.8 Incorporation of the larger H3O+ cation increases
solubility in jarosite minerals by increasing the c-parameter of the crystallographic
structure thereby decreasing stability and increasing reactivity. 9,10 Other A-site
substitutions include but are not limited to: Rb, Pb, Ca, Sr, and the REE. Typically,
substitution of larger monovalent cations into the A-site results in expansion of the c
4
relationship between A site cations and dissolution rates in synthetic jarosites increases
in the order K(Fe, Cr)- > K- > Na- > H3O-jarosite. Deficiency in the B site is balanced
by protonation of the hydroxyl groups in the structure to form water molecules and is
described by the following chemical formula developed by Kubisz (1970): A1-x(H3O) x
Fe3-y (OH)6-3y(H2O)3y (SO4)2.12,13 Substitution of divalent cations such as Pb2+ and Cu2+
into the A-site also requires charge balancing. For example, for every K+ cations in the
K-jarosite formula there are 0.5 Pb2+ cations in the Pb-jarosite formula. The Pb2+ cation
and the A site vacancies are ordered resulting in the doubling of the unit cell. 14
Moreover, arsenate (AsO43-) will substitute for SO42- in the T-site in K-jarosite minerals
to charge balance Pb2+ substitution in the A-site.7,15 Despite extensive elemental
substitution into jarosites, the relative stability of these substitutions is not well studied
from both a biotic or abiotic perspective.
1.2 JAROSITE FORMATION
Figure 1.2 shows the pe/pH diagram for K-jarosite, which illustrates that
jarosites form under oxidizing, ferric and sulfate rich acidic (pH < 2.5) conditions.11,16
At higher pH, jarosites dissolve to form goethite (FeO(OH)) or metastable phases, such
as schwertmannite (Fe8O8(OH)6SO4) or ferrihydrite.17,18 Consequently, jarosite-group
minerals commonly form in acid-sulfate soils, such as on the north coast of New South
Wales, Australia, whereby the dissolution of jarosite during events such as flooding
represents a major potential source of acidity to the region through the following
reaction:19
5
Moreover, dissolution of jarosite under acidic conditions (pH > 3) will produce soluble
ferric iron instead of iron (III) hydroxides and catalyze pyrite oxidation and enhance H+
production, as demonstrated in the following reaction:
FeS2 + 14Fe3+ + 8H2O → 15Fe2+ + 2SO42- + 16H+ (Reaction 2)
Jarosites are also found in hypersaline lakes such as Lake Tyrell in Australia and in the
Antarctic.20,21 Jarosites are also common constituents in mine wastes across the globe
with some of the best studied areas such as Rio Tinto, Spain and Kidd Creek, Timmins,
Canada.7,22-24
1.3 JAROSITES AND THE ZINC INDUSTRY
Over the past 30 years, the Zn industry has capitalized on the stability of jarosite
minerals and synthetic jarosites, which are purposely precipitated to remove unwanted
impurities during processing, such as Fe, sulfates, alkalis and other metals (e.g., Pb, Ag).
Precipitates are easily filtered and give low losses of Zn metal, therefore, this process
accounts for 80% of all Zn extracted worldwide (8 Mt/yr).7 While the jarosite process is
a highly efficient and economical method to optimize Zn recoveries, it also produces
large volumes of waste. For example, a plant annually producing 150,000 tonnes of
metallic Zn will generate approximately 125,000 tonnes of jarosite.7 Jarositic wastes are
not easily recyclable and may contain elevated concentrations of toxic metals such as
Pb, As, Tl, and therefore the safe disposal of these wastes is of paramount concern.
Past disposal methods have included deep sea disposal, underground storage and
co-surface tailing impoundments, all of which have proven ineffective at containing
jarositic wastes. For example, from 1973 to1997, Pasminco EZ Metals disposed of 4
6
concentrations of Zn (6.5%), Pb (2.4%) and As (0.95%) at an offshore disposal site off
the southern coast of Tasmania at depths of 200 m. Consequently, Harris et al. (1999)
demonstrated downslope dispersal of these sediments at depths greater than 3000 m.25 In
Odda, Norway disposal of jarosite residues in a granitic mountain cavern resulted in
metal seepage near the containment area.7,26 Recent advances in the hydrometallurgical
industry in collaboration with the Canadian government (CANMET) has led to a
promising long-term jarosite disposal process called Jarofix, whereby precipitates are
stabilized using a mixture of Portland cement, lime and water and may serve to alleviate
some of the issues surrounding disposal.27
1.4 MARTIAN JAROSITE
Overall, the use of jarosite precipitation in the Zn industry led to an increase in
hydrometallurgical-focused jarosite research in the 1970s, which continues to the
present and is led by J.E. Dutrizac (CANMET), whereby the stability and factors
affecting the synthesis of various jarosites were studied extensively.2 However, it was
NASA's 2004 announcement of the discovery of jarosite on Mars, as detailed in the
seminal Science paper by Klingelhöfer et al. (2004), that brought the relatively unknown
mineral to the headlines and to the forefront of mineralogical research mandates.28 The
Mars discovery created a major surge in jarosite research. An ISI Web of Science
Survey conducted in April 2012 of the 38 years (1965-2003) prior to the Mars
announcement showed that there were only 177 journal articles published featuring
"jarosite" in the title. In the last 8 years, however, since the announcement there were
138 articles published accounting for 44% of all jarosite titled publications over the last
7
The discovery of jarosite on Mars had two important astrobiological
implications: 1) as an OH- and SO42- anion bearing mineral, jarosite provided
mineralogical evidence for aqueous acid sulfate processes under oxidizing conditions,
and 2) as a K-bearing mineral, jarosite could potentially be used as a reliable
geochronometer using the 40Ar/39Ar method to identify when water was present on
Mars.29-31 Moreover, evidence of amino acid preservation of glycine and other organics
in terrestrial jarosite samples has rendered the mineral a potential preserver of biological
signatures of life on Mars.31-33
The potential influence of microbial processes on jarosite formation is not a new
concept. In 1973, Ivarson was the first to demonstrate jarosite and ammoniojarosite
formation through the oxidation of ferrous sulfate by Thiobacillus ferroxidans.34 Indeed,
since 1973 several studies have documented the role of microbial processes on jarosite
formation through the oxidation of both aqueous and solid phase Fe2+ and sulfide by
bacteria, such as T. ferroxidans, Acidiphilium ruburum and Acidthiobacillus
ferrooxidans.35-39
The focused attention and resulting publications on jarosite spurred by the Mars
announcement also benefited other fields of jarosite research and on acid mine wastes in
particular. Increased interest into jarositic mine waste and their respective formation
locations was partially motivated by the search for terrestrial Mars analogues, such as at
Rio Tinto, Spain but it also served to indirectly increase awareness of the potential
8 1.5 JAROSITE AND THE ENVIRONMENT
During the late 1990s and early 2000s, studies had already demonstrated
formation and incorporation of toxic metals such as Pb and As into jarosites at several
acid mine drainage (AMD) sites (including Rio Tinto) and suggested that jarosites
served as sinks and helped immobilize metals, particularly Pb and As.24,41-43 Therefore,
current jarosite research is focused on determining the stability of jarosites and the
geochemical conditions influencing the structural release of potentially toxic metals,
such as Pb, As and Tl, into the environment.19,22,44-48 Recent studies using laboratory
batch tests demonstrated that abiotic dissolution of K-jarosite, Pb-jarosite and Pb-As
jarosite is an incongruent reaction controlled by selective dissolution at the A and T
sites. During dissolution and in the absence of Fe(III) complexation, Fe(III) hydroxides
will precipitate at the surface, which may serve to resorb metals such as Pb and
As.46,49,50
Many of the underlying mechanisms regulating metal release and uptake onto
secondary precipitates associated with jarosites, however, remain to be elucidated. For
example, co-disposal of natrojarosite, NaFe3(OH)3(SO4)2, and base-metal sulphide
tailings at Kidd Creek, Timmons, Canada at neutral pH (6.5 to 6.8) and low Eh (94 to
117 mV) demonstrated increased concentrations of Zn, Pb and As in pore waters
associated with the jarosite disposal zone of the tailings pile which was attributed to
enhanced dissolution of jarosites.22 In mine waste tailings ponds, Fe minerals such as
jarosites may also form crusts or hardpans. In Crimea, Ukraine metals such as Cr, As
and Ti are immobilized in a 10 to 50 cm natrojarosite layer 42 km2 wide.51,52 The
9
underlying materials, thereby promoting anoxic conditions and creating the potential for
dissimilatory metal reduction.
Despite the potential for the reductive dissolution of jarosites by natural
microbial consortia, surprisingly few studies have evaluated the potential for microbial
dissolution by dissimilatory metal reducing bacteria.46-48,53,54 Therefore, the focus of this
dissertation is to examine the susceptibility of several synthetic and natural jarosites
under circumneutral, anaerobic conditions to reductive dissolution by the dissimilatory
metal reducing bacterium, Shewanella putrefaciens strain CN32.
1.6 DISSIMILATORY METAL REDUCTION
Dissimilatory metal reduction refers to an enzymatic process whereby a metal
such as Fe or Mn is reduced but is not incorporated into the cell for the purpose of
biosynthesis during respiration.55 During this process, bacteria gain energy for growth
by coupling the oxidation of a carbon source to the reduction of a terminal electron
acceptor such as Fe(III). Microbial Fe(III) reduction results in release of aqueous Fe(II)
and the subsequent precipitation of Fe(II)-bearing minerals, including siderite (FeCO3),
vivianite (Fe3PO4·8H2O), and mixed-valence Fe(II)-Fe(III) minerals, such as magnetite
and green rusts.56 Based on thermodynamic energy yield, bacteria generally use terminal
electron acceptors in the following sequence of decreasing energy yield: O2 > NO3- >
MnO2 > FeOOH > SO42-. 57,58 The Shewanella sp. and Geobacter sp. genera are the most
commonly studied iron reducing bacteria. In 1988, Geobacter metallireducens GS-15
was the first bacterial species reported to show dissimilatory Fe reduction by coupling
the oxidation of acetate to the reduction of an amorphous Fe(III) oxide.59 Reports of
10
the era of Shewanella sp. research began.60,61 As a facultative anaerobe, Shewanella sp.
has shown remarkable anaerobic versatility and is capable of reducing a variety of other
terminal electron acceptors such as nitrate, nitrite, thiosulfite, sulfite, arsenate, uranium,
chromate, iodate, technetium, neptunium, plutonium, selenite (see ref. 46 and all refs.
therein).55,62
The insolubility of Fe(III) at pH > 4 creates a metabolic quandary for bacteria
utilizing Fe(III) minerals as terminal electron acceptors. Various microbial strategies
have been proposed to facilitate the transfer of electrons to Fe(III) oxide minerals and
include: 1) direct contact; 2) electrically conductive nanowires; 3) electron shuttles; and
4) metal chelators/siderophores .56 Direct contact between Shewanella sp.and Fe-oxide
surfaces is considered the prevalent strategy to ensure effective electron transfer (see 55
and all refs. therein).63 The ability of dissimilatory metal reducing bacteria to reduce
iron oxides is well documented and is dependent on several factors including particle
size, surface area, and crystallinity. 64,65 Generally, the rate of Fe reduction increases
with increasing surface area, but is inversely related to particle size and crystallinity.
Accordingly, Munch and Ottow (1983) showed that reactivity towards microbial iron
reduction decreased in the following order: amorphous Fe(III) hydroxides >
lepidocrocite (γFeO(OH)) > hematite (Fe2O3) > goethite (αFeO(OH)).66 More recently,
Bonneville et al. (2004, 2009) demonstrated that Fe(III) reduction by S. putrefaciens was
related to mineral solubility, whereby Fe(III) reduction was positively correlated to the
11 1.7 REDUCTIVE DISSOLUTION OF JAROSITES
In comparison to Fe(III) hydroxides, the reductive dissolution of jarosites are not
well-studied. The presence of both Fe(III) and SO42- presents two terminal electron
acceptors available for reduction. Ivarson and Hallberg (1976) were the first to
demonstrate the reductive dissolution of biogenic K-jarosite followed by the formation
of mackinawite (FeS)using the sulfate-reducing bacterium, Desulfovibrio desulfuricans,
under circumneutral anaerobic conditions.69 Twenty-four years later, Fe(III) reduction
by Acidiphilium SJH (pH 2 -3) was investigated across a suite of Fe(III) minerals
including biogenic jarosite and natrojarosite.53 Results showed that Acidiphilium SJH
was able to reductively dissolve all of the minerals tested except hematite in the
following order of decreasing reactivity: soluble Fe3+ > amorphous Fe(OH)3 >
magnetite > goethite > natrojarosite > akageneite > jarosite. To examine jarosites from a
mine waste perspective, Jones et. al (2006) used Geobacter metallireducens GS15 and a
mine site isolate, Geobacter sp. ENN1, to examine Fe(III) reduction at neutral pH from
synthetic schwertmannite and two natural jarosite samples. One of the jarosite samples
originated from an AMD site, while the other was purchased as a lithified mineral
specimen. Both strains were able to reduce Fe(III) from the 2 jarosites, however,
neither bacterium reduced Fe(III) from schwertmannite. Results also showed that the
lithified mineral specimen was more resistant to Fe(III) reduction and corroborated
mineralogical studies, which demonstrate that mine waste jarosites are less stable as
opposed to older, stoichiometric jarosites.9,10
To examine the potential for structural metal release from the A-site, Weisener
12
(AgFe3(SO4)2(OH)6) and showed reduction of both Fe and Ag by Shewanellla
putrefaciens CN32. 54 To examine sulfate reduction, Gramp et al. (2009) used
Acidiothiobacillus ferrooxidans to precipitate K-jarosite and schwertmannite
(Fe8O8(OH)6SO4).70 The solid phases were then used as electron acceptors at pH 6.5 for
mesophilic (22 °C) and thermophilic (45 and 60°C) sulfate reducing bacteria isolated
from an AMD mine site and a commercial compost pile, respectively. After 2 weeks,
greigite (Fe3S4) was formed at 60 °C in both schwertmannite and K-jarosite, however,
the greigite formed from the reduction of jarosite was less abundant. The greater S
reduction from schwertmannite was likely due to its poor crystallinity and relative
instability as compared to the more crystalline jarosite. Most recently, Coggon et al.
(2012), demonstrated the reduction of Fe(III) and sulfate in AMD sediment amended
with natrojarosite using a natural microbial consortia from the AMD site and also
showed increased pH relative to controls due to H+ consumption during Fe/S reduction.71
The increase in pH suggests the potential for jarosite to be used to attenuate AMD
environments. Aside from the Weisener (2008) study, there are no other studies that
examine the potential role that reductive dissolution of jarosites may play in the
mobilization of metals, such as As and Tl, into the environment.
1.8 THESIS OUTLINE
This dissertation examines the relative influence of jarosite structure on the
abiotic and reductive dissolution of synthetic and natural jarosites using batch
incubations under anaerobic circum-neutral conditions. Shewanella putrefaciens was
used as the metal reducing bacterium because it is a well characterized, model
13
dissimilatory metal reduction.65,72-74 S. putrefaciens was originally isolated from a
subsurface core sample (250 m) obtained from the Morrision Formation, a
shale-sandstone sequence in north western New Mexico mined extensively for uranium.60
The central hypothesis that forms the basis of this dissertation is: Shewanella
putrefaciens CN32 will reductively dissolve jarosites and the degree of dissolution will
be influenced by elemental substitution within the jarosite structure. The results
comprise 4 Chapters (2 to 5) (in manuscript format) and encompass the reductive
dissolution of several synthetic and natural jarosites.
Chapter 2 investigates the reductive dissolution of synthetic Pb-jarosite,
PbFe6(SO4)4(OH)12, by S. putrefaciens. The objective of this study was to examine the
influence of the divalent Pb2+ cation in the A-site on the susceptibility of jarosite phase
to Fe(III) reduction. Pb-jarosite was used because it is suggested to control aqueous Pb
mobility in AMD environments and is also a common waste product of the Zn mining
industry. 24,41,75 In addition to solution chemistry, scanning electron microscopy (SEM)
and transmission electron microscopy (TEM) were used to examine the intracellular
accumulation of Pb demonstrated by S. putrefaciens during the experiment.
Chapter 3 examines the relative order and extent of As(V) and Fe(III) reduction
in a synthetic Pb-As jarosite (H3O)0.68Pb0.32Fe2.86(SO4)1.69(AsO4)0.31(OH)5.59(H2O)0.41) by
S. putrefaciens. In this structure, Pb is at the A site and AsO43- partially substitutes for
SO42- in the T site. Solid phase As and Fe speciation was examined using X-ray
Absorption Spectroscopy (XAS) at Argonne National Laboratory. Additionally, we
14
dissolution of Pb-As jarosite using solution chemistry, geochemical modeling, HR-TEM
and SEM.
In Chapter 4, the reductive dissolution of Tl-jarosite,
(H3O)0.29Tl0.71Fe2.74(SO4)2(OH)5.22(H2O)0.78 was examined. This chapter differs from the
previous 2 chapters because Tl+ is a monovalent cation occupying the A site and the
structure is expected to be less stable. Although highly toxic and mobile in the
environment, Tl has received very little scientific attention as compared to other metals
such as Pb, Hg and Cd. The role of S. putrefaciens in Tl sorption was also examined in
order to provide greater insight into Tl + bacteria interactions, which is currently lacking
in the scientific literature.76-79
The primary objective of Chapter 5 was to determine if there are any differences
between the reductive dissolution of synthetic and natural jarosites. Synthetic jarosite is
often used as a proxy for natural jarosites, which may potentially underestimate or
overestimate dissolution. Therefore, the reductive dissolution of 2 synthetic K-jarosites
and 2 natural jarosites was compared. By using different jarosite synthesis methods, the
influence of particle size and surface area on reductive dissolution was also examined.
Lastly, the potential influence of S. putrefaciens on the release of metals from the natural
jarosite phases was evaluated.
In Chapter 6, the data from the preceding chapters is amalgamated and the
15
Table 1.1. Minerals of the jarosite subgroup and their corresponding synthetic analogues
Formula Mineral Name Synthetic Equivalent
KFe3(SO4)2(OH)6 jarosite potassium jarosite
NaFe3(SO4)2(OH)6 natrojarosite sodium jarosite
(H3O)Fe3(SO4)2(OH)6 hydronium jarosite hydronium jarosite
RbFe3(SO4)2(OH)6 no mineral equivalent rubidium jarosite
AgFe3(SO4)2(OH)6 argentojarosite silver jarosite
(NH4)Fe3(SO4)2(OH)6 ammoniojarosite ammonium jarosite
TlFe3(SO4)2(OH)6 dorallcharite thallium jarosite
PbFe6(SO4)4(OH)12 plumbojarosite lead jarosite
HgFe6(SO4)4(OH)12 no mineral equivalent mercury jarosite
Pb(Fe,Cu)3(SO4)2(OH,H2O)6 beaverite lead-copper-jarosite
16
Figure 1.2. pe-pH diagram for Fe-S-K-O-H system at 25°C. Total log activities of
Fe2+= -3.47; Fe3+= -3.36 or -2.27; SO42- = -2.32, K+= -3.78. pe= Eh(mV)/59.2
Where Jt =jarosite, Sh= schwertmannite, Fh=ferrihydrite, Gt=goethite and Py=pyrite.
Single-hatched areas demonstrate expansion of K-jarosite and ferrihydrite fields if lower
17 1.9 REFERENCES
1. Swayze, G. A.; Desborough, G. A.; Smith, K. S.; Lowers, H. A.; Hammarstrom,
J. M.; Diehl, S. F.; Leinz, R. W.; Driscoll, R. L., Understanding Jarosite- From Mine Waste to Mars. In U.S. Geological Survey Circular: 2009; Vol. 1328, pp 8-13.
2. Dutrizac, J. E.; Kaiman, S., Synthesis and Properties of Jarosite-type
Compounds. Can. Mineral. 1976,14, 151-158.
3. Jambor, J. L., Nomenclature of the alunite supergroup. Can. Mineral. 1999,37,
1323-1341.
4. Burger, P. V.; Papike, J. J.; Shearer, C. K.; Karner, J. M., Jarosite growth zoning
as a recorder of fluid evolution. Geochim. Cosmochim. Acta 2009,73, (11), 3248-3259.
5. Sunyer, A.; Vinals, J., Arsenate substitution in natroalunite: A potential medium
for arsenic immobilization. Part 1: Synthesis and compositions. Hydrometallurgy 2011,
109, (1-2), 54-64.
6. Kolitsch, U.; Pring, A., Crystal chemistry of the crandallite, beudantite and
alunite groups: a review and evaluation of the suitability as storage materials for toxic
metals. Journal of mineralogical and petrological sciences 2001,96, (2), 67-78.
7. Dutrizac, J. E.; Jambor, J. L., Jarosites and their application in hydrometallurgy.
In Sulfate Minerals - Crystallography, Geochemistry and Environmental Significance, 2000; Vol. 40, pp 405-452.
8. Drouet, C.; Navrotsky, A., Synthesis, characterization, and thermochemistry of
K-Na-H3O jarosites. Geochim. Cosmochim. Acta 2003,67, (11), 2063-2076.
9. Desborough, G. A.; Smith, K. S.; Lowers, H. A.; Swayze, G. A.; Hammarstrom,
J. M.; Diehl, S. F.; Leinz, R. W.; Driscoll, R. L., Mineralogical and chemical
characteristics of some natural jarosites. Geochim. Cosmochim. Acta 2010,74, (3),
1041-1056.
10. Desborough, G. A.; Smith, K. S.; Lowers, H. A.; Swayze, G. A.; Hammarstrom,
18
11. Stoffregen, R.; Alpers, C.; Jambor, J. L., Alunite-jarosite crystallography,
thermodynamics, and geochronology. Reviews in mineralogy and geochemistry 2000,
40, (1), 453.
12. Ripmeester, J. A.; Ratcliffe, C. I.; Dutrizac, J. E.; Jambor, J. L., Hydronium ion
in the alunite-jarosite group. The Canadian Mineralogist 1986,24, (3), 435-447.
13. Kubisz, J., Studies on synthetic alkali-hydronium jarosites. I. Synthesis of
jarosite and natrojarosite. . Mineralogia Polonica 1970,1, 47-57.
14. Szymanski, J. T., The Crystal-Structure of Plumbojarosite Pb[Fe3(So4)2(Oh)6]2.
Can. Mineral. 1985,23, 659-668.
15. Savage, K. S.; Bird, D. K.; O'Day, P. A., Arsenic speciation in synthetic jarosite.
Chem. Geol. 2005,215, (1), 473-498.
16. Dutrizac, J. E., The behavior of thallium during jarosite precipitation.
Metallurgical and Materials Transactions B 1997,28, (5), 765-776.
17. Bigham, J.; Nordstrom, D. K., Iron and aluminum hydroxysulfates from acid
sulfate waters. Reviews in mineralogy and geochemistry 2000,40, (1), 351.
18. Bigham, J.; Schwertmann, U.; Traina, S.; Winland, R.; Wolf, M.,
Schwertmannite and the chemical modeling of iron in acid sulfate waters. Geochim.
Cosmochim. Acta 1996,60, (12), 2111-2121.
19. Welch, S. A.; Kirste, D.; Christy, A. G.; Beavis, F. R.; Beavis, S. G., Jarosite
dissolution II-Reaction kinetics, stoichiometry and acid flux. Chem. Geol. 2008,254,
(1-2), 73-86.
20. Long, D.; Fegan, N.; McKee, J.; Lyons, W.; Hines, M.; Macumber, P.,
Formation of alunite, jarosite and hydrous iron oxides in a hypersaline system: Lake
Tyrrell, Victoria, Australia. Chem. Geol. 1992,96, (1-2), 183-202.
21. Gore, D. B.; Creagh, D.; Burgess, J.; Colhoun, E.; Spate, A.; Baird, A.,
Composition, distribution and origin of surficial salts in the Vestfold Hills, East Antarctica. Antarctic Science 1996,8, (01), 73-84.
22. Al, T. A.; Blowes, D. W.; Jambor, J. L.; Scott, J. D., The Geochemistry of
Mine-Waste Pore-Water Affected by the Combined Disposal of Natrojarosite and Base-Metal
Sulfide Tailings at Kidd Creek, Timmins, Ontario. Can. Geotech. J. 1994,31, (4),
19
23. Basciano, L. C.; Peterson, R. C., Jarosite-hydronium jarosite solid-solution series
with full iron site occupancy: Mineralogy and crystal chemistry. American Mineralogist
2007,92, (8-9), 1464-1473.
24. Hudson-Edwards, K. A.; Schell, C.; Macklin, M. G., Mineralogy and
geochemistry of alluvium contaminated by metal mining in the Rio Tinto area,
southwest Spain. Appl. Geochem. 1999,14, (8), 1015-1030.
25. Harris, P. T.; O'Brien, P. E.; Quilty, P.; McMinn, A.; Holdway, D.; Exon, N. F.;
Hill, P. J.; Wilson, C. W., Sedimentation and continental slope processes in the vicinity
of an ocean waste-disposal site, southeastern Tasmania. Australian Journal of Earth
Sciences 1999,46, (4), 577-591.
26. Berg, D.; Borve, K. The disposal of iron residue at Norzink and its impact on the
environment.; Canadian Institute Mining Metallurgy and Petroleum: Montreal, 1996; pp 627-642.
27. Chen, T.; Dutrizac, J., Jarofix: Addressing iron disposal in the zinc industry.
JOM Journal of the Minerals, Metals and Materials Society 2001,53, (12), 32-35.
28. Klingelhofer, G.; Morris, R.; Bernhardt, B.; Schroder, C.; Rodionov, D.; de
Souza Jr, P.; Yen, A.; Gellert, R.; Evlanov, E.; Zubkov, B., Jarosite and hematite at
Meridiani Planum from Opportunity's Mossbauer spectrometer. Science 2004,306,
(5702), 1740-1745.
29. Lueth, V. W.; Rye, R. O.; Peters, L., "Sour gas" hydrothermal jarosite: ancient to
modern acid-sulfate mineralization in the southern Rio Grande Rift. Chem. Geol. 2005,
215, (1), 339-360.
30. Rye, R. O.; Stoffregen, R. E., Jarosite-water oxygen and hydrogen isotope
fractionations; preliminary experimental data. Economic Geology 1995,90, (8),
2336-2342.
31. Kula, J.; Baldwin, S. L., Jarosite, argon diffusion, and dating aqueous
mineralization on Earth and Mars. Earth Planet. Sci. Lett. 2011,310, (3), 314-318.
32. Kotler, J. M.; Hinman, N. W.; Yan, B.; Stoner, D. L.; Scott, J. R., Glycine
identification in natural jarosites using laser desorption Fourier transform mass
spectrometry: Implications for the search for life on Mars. Astrobiology 2008,8, (2),
20
33. Aubrey, A.; Cleaves, H. J.; Chalmers, J. H.; Skelley, A. M.; Mathies, R. A.;
Grunthaner, F. J.; Ehrenfreund, P.; Bada, J. L., Sulfate minerals and organic compounds on Mars. Geology 2006,34, (5), 357.
34. Ivarson, K., Microbiological formation of basic ferric sulfates. Canadian Journal
of Soil Science 1973,53, (3), 315-323.
35. Daoud, J.; Karamanev, D., Formation of jarosite during Fe2+ oxidation by
Acidithiobacillus ferrooxidans. Minerals Engineering 2006,19, (9), 960-967.
36. Kawano, M.; Tomita, K., Geochemical modeling of bacterially induced
mineralization of schwertmannite and jarosite in sulfuric acid spring water. American
Mineralogist 2001,86, (10), 1156-1165.
37. Wang, H. M.; Bigham, J. M.; Jones, F. S.; Tuovinen, O. H., Synthesis and
properties of ammoniojarosites prepared with iron-oxidizing acidophilic microorganisms
at 22-65 degrees C. Geochim. Cosmochim. Acta 2007,71, (1), 155-164.
38. Norlund, K. L. I.; Baron, C.; Warren, L. A., Jarosite formation by an AMD
sulphide-oxidizing environmental enrichment: Implications for biomarkers on Mars.
Chem. Geol. 2010,275, (3-4), 235-242.
39. Sasaki, K.; Sakimoto, T.; Endo, M.; Konno, H., FE-SEM study of microbially
formed jarosites by Acidithiobacillus ferrooxidans. Materials Transactions 2006,47,
(4), 1155-1162.
40. Amils, R.; Gonzalez-Toril, E.; Fernandez-Remolar, D.; Gamez, F.; Aguilera, Ã.;
Rodriguez, N.; Malki, M.; Garcia-Moyano, A.; Fairen, A. G.; de La Fuente, V., Extreme
environments as Mars terrestrial analogs: the Rio Tinto case. Planetary and Space
Science 2007,55, (3), 370-381.
41. Hochella, M. F.; Moore, J. N.; Golla, U.; Putnis, A., A TEM study of samples
from acid mine drainage systems: Metal-mineral association with implications for
transport. Geochim. Cosmochim. Acta 1999,63, (19-20), 3395-3406.
42. Hudson-Edwards, K. A.; Edwards, S. J., Mineralogical controls on storage of As,
Cu, Pb and Zn at the abandoned Mathiatis massive sulphide mine, Cyprus.
Mineralogical Magazine 2005,69, (5), 695-706.
43. Roussel, C.; Neel, C.; Bril, H., Minerals controlling arsenic and lead solubility in
an abandoned gold mine tailings. Science of the Total Environment 2000,263, (1-3),
21
44. Blowes, D. W.; Al, T.; Lortie, L.; Gould, W. D.; Jambor, J. L., Microbiological,
Chemical, and Mineralogical Characterization of the Kidd-Creek Mine Tailings
Impoundment, Timmins Area, Ontario. Geomicrobiol. J. 1995,13, (1), 13-31.
45. Jurjovec, J.; Ptacek, C. J.; Blowes, D. W.; Jambor, J. L., The effect of
natrojarosite addition to mine tailings. Environ. Sci. Technol. 2003,37, (1), 158-164.
46. Smith, A. M. L.; Dubbin, W. E.; Wright, K.; Hudson-Edwards, K. A.,
Dissolution of lead- and lead-arsenic-jarosites at pH 2 and 8 and 20 degrees C: Insights
from batch experiments. Chem. Geol. 2006,229, (4), 344-361.
47. Smith, A. M. L.; Hudson-Edwards, K. A.; Dubbin, W. E.; Wright, K.,
Dissolution of jarosite [KFe3(SO4)(2)(OH)(6)] at pH 2 and 8: Insights from batch
experiments and computational modelling. Geochim. Cosmochim. Acta 2006,70, (3),
608-621.
48. Welch, S. A.; Christy, A. G.; Kirste, D.; BeaviS, S. G.; Beavis, F., Jarosite
dissolution I - Trace cation flux in acid sulfate soils. Chem. Geol. 2007,245, (3-4), 183-197.
49. Gasharova, B.; Gottlicher, J.; Becker, U., Dissolution at the surface of jarosite:
an in situ AFM study. Chem. Geol. 2005,215, (1-4), 499-516.
50. Smith, A. M. L.; Hudson-Edwards, K. A.; Dubbin, W. E.; Wright, K., Defects
and impurities in jarosite: A computer simulation study. Appl. Geochem. 2006,21, (8),
1251-1258.
51. Ding, M.; Schuiling, R.; Sloot, H. A., Self-sealing isolation and immobilization:
a geochemical approach to solve the environmental problem of waste acidic jarosite.
Appl. Geochem. 2002,17, (2), 93-103.
52. Schuiling, R.; Van Gaans, P., The waste sulfuric acid lake of the TiO2-plant at
Armyansk, Crimea, Ukraine. Part I. Self-sealing as an environmental protection
mechanism. Appl. Geochem. 1997,12, (2), 181-186.
53. Bridge, T. A. M.; Johnson, D. B., Reductive dissolution of ferric iron minerals
by Acidiphilium SJH. Geomicrobiol. J. 2000,17, (3), 193-206.
54. Weisener, C. G.; Babechuk, M. G.; Fryer, B. J.; Maunder, C., Microbial
Dissolution of Silver Jarosite: Examining Its Trace Metal Behaviour in Reduced