Abstract
COLETRANE, CLINTON. Durable Static Control. (Under the direction of Dr. William Oxenham and Dr. Abdel–Fattah Seyam).
Electrostatic charge continues to be a major interest of the textile industry. Electrostatic charge has been harnessed in positive ways such as in
electrospinning and flocking. However, its negative effects such as fiber clinging, lapping and electrostatic discharge continue to be problematic for the industry and consumer. As synthetic polymers continue to grow in production and production machinery continue to increase in production speeds, finding a durable antistatic treatment that can prevent the accumulation of charge on a textile surface as well as dissipate charge quickly is becoming increasingly critical.
This thesis measured the performance of antistatic treatments on polyester woven fabrics to compare their charge accumulation, dissipation and durability abilities and benchmark their performance with respect to cotton woven fabrics. Two non durable ionic surface treatments as well as two durable hydrophilic surface modifying polymer treatments were applied to spun and filament
technology at North Carolina State University. Resistivity of the treated fabrics was also measured as a parameter accepted by the industry for a measure o static charge/dissipation, and correlated to the charge accumulation/dissipation measured by tribocharging technique.
Durable Static Control
by
Clinton Coletrane
A thesis submitted to the Graduate Faculty of North Carolina State University
in partial fulfillment of the requirements for the degree of
Master of Science
Textiles
Raleigh, North Carolina 2010
APPROVED BY:
_____________________ _____________________
Dr. Abdel-Fattah Seyam Dr. William Oxenham
Biography
Clinton Coletrane was born and raised in Yanceyville, NC. He received his
Acknowledgements
The author wishes to express his sincere appreciation to the following people or
groups of people:
1) His thesis committee members Dr. Oxenham, Dr. Seyam, Dr. Theyson and Dr.
O’Neal for their advice and support during this research,.
2) Milliken® & Company for providing the opportunity to return to school for further
education.
3) ITT and its members for educational support.
Table of Contents
List of Figures viii
List of Tables xii
List of Equations ...xiii
1 Introduction ...1
1.1 Purpose ...3
1.2 Objectives...4
1.3 Significance of Research...4
2 Literature Review...5
2.1 Static Electricity Theory...5
2.1.1 History of Static Electricity ...5
2.1.2 Phenomenon of Static Electricity ...8
2.1.3 Influencing Factors ...14
2.2 Effects of Static Electricity ...20
2.2.1 Advantages of Static Electricity...20
2.2.2 Dangers of Static Electricity ...21
2.3 Currently Available Antistatic Processes ...23
2.3.2 Non-Durable Chemical Treatments...25
2.3.3 Durable Chemical Finishes ...28
2.3.4 Surface Grafting...30
2.4 Demand ...31
3 Methodology ...33
3.1 Project Design ...33
3.2 Design of Experiments ...37
3.2.1 Tribocharge Test...37
3.2.2 Resistivity Test...38
3.2.3 Wicking Test ...39
3.3 Equipment ...39
3.3.1 Rubbing System ...39
3.3.2 Ionizing Gas Gun ...42
3.3.3 Environmental Room ...42
4.1 Tribocharge Charge Accumulation ...49
4.1.1 Charge Accumulation on Cotton Fabrics ...62
4.1.2 Charge Accumulation of Blank PET Fabrics...63
4.1.3 Charge Accumulation for Lurostat 264A on PET Fabrics ...64
4.1.4 Charge Accumulation for Leomin PN on PET Fabrics ...65
4.1.5 Charge Accumulation of MM Polymer on PET Fabrics...66
4.1.6 Charge Accumulation of Hydroperm T on PET Fabrics ...67
4.2 Static Dissipation...68
4.2.1 Charge Dissipation for Cotton Fabrics ...82
4.2.2 Charge Dissipation for Blank PET Fabrics...83
4.2.3 Charge Dissipation of Lurostat 264A Treated PET Fabrics ...84
4.2.4 Charge Dissipation of Leomin PN Treated PET Fabrics...85
4.2.5 Charge Dissipation of Hydroperm T Treated PET Fabrics...86
4.2.6 Charge Dissipation of MM Polymer Treated PET Fabrics ...86
4.3 Regression of Charge Accumulation and Dissipation...87
4.4 Resistivity Measurements...89
4.5 Wicking Test...95
5.1 Revisiting Objectives ...98
5.2 Critical Finding...100
5.3 Future Recommendations ...101
6 References ...103
7 Appendix...107
7.1 Appendix A: Sample Cleaning ...108
7.2 Appendix B: Sample Treating ...109
7.3 Appendix C: Tribocharging Procedures ...111
7.4 Appendix D: Resistivity Procedures...112
7.5 Appendix E: Laundering Procedures ...113
List of Figures
Figure 1: Illustration of Surface State Theory for low density limit charge transfer
[16]...13
Figure 2: Illustration of Surface State Theory for high density limit charge transfer [16]...13
Figure 3: Effect of relative humidity on initial charge [17]...16
Figure 4 Effect of humidity on initial voltage generated on polyester yarn [18] ...16
Figure 5 Effect of temperature on initial voltage generated on polyester yarn[18] ...17
Figure 6: Relationship between contact force and charge accumulation[7] ...19
Figure 7 Anionic Non Durable Anti-static Phosphoric ester[27] ...27
Figure 8 Cationic Non-Durable Finish Quaternary Ammonium[10] ...27
Figure 9 Non-Ionic Non-Durable Finish[10]...28
Figure 10 Crosslinking of polyamines[10] ...30
Figure 11: Diagram of tribocharging equipment...40
Figure 12: Picture of the dynamic tribocharging tester...41
Figure 13: Resistivity meter and concentric ring[1] ...43
Figure 15: Signal profile of tribocharging [7] ...45
Figure 16: Diagram of tribocharging test motion ...46
Figure 17: Charge accumulation of treated filament PET samples 24 Hrs after treatment compared to blank cotton samples ...51
Figure 18: Charge accumulation of treated filament PET samples 7+ days after treatment compared to blank cotton samples ...52
Figure 19: Charge accumulation of treated filament PET samples 24 Hrs after laundering compared to blank cotton samples...53
Figure 20: Charge accumulation of treated spun PET samples 24 Hrs after
treatment compared to cotton fabrics ...54
Figure 21: Accumulation of treated spun PET samples 7+ days after treatment compared to cotton fabric samples ...55
Figure 22: Charge accumulation of spun PET with treatments compared to blank cotton samples at 24 hrs after single laundering...56
Figure 23:Half Life Time of treated filament PET samples 24 Hrs after treatment compared to cotton samples...70
Figure 25: Dissipation Comparison of 0 seconds and 30 seconds of dissipation for the filament fabric 7+ days after various treatments compared to cotton ...72
Figure 26: Dissipation Comparison of 0 seconds and 30 seconds of dissipation for the filament fabric 24 hours after a single laundering compared to cotton ...73
Figure 27: Half Life Time of spun PET samples at varying times after treatment compared to cotton samples...74
Figure 28: Dissipation Comparison of 0 seconds and 30 seconds of dissipation for the spun fabric 24 hours after various treatments compared to cotton .75
Figure 29: Dissipation Comparison of 0 seconds and 30 seconds of dissipation for the spun fabric 7 + days after various treatments compared to cotton ..76
Figure 30: Dissipation Comparison of 0 seconds and 30 seconds of dissipation for the spun fabric 24 hours after a single laundering compared to cotton .77
Figure 31: Filament fabric treated with Hydroperm T charge accumulation curve and regressions ...88
Figure 32: Filament fabric treated with Hydroperm T dissipation curve and
regression ...89
Figure 34: Resistivity measurement of treated spun fabric sample 24Hrs after treatment and 24Hrs after a single laundering compared to cotton ...91
Figure 35: Comparing resistivity to charge accumulated at 35 cycles...93
Figure 36: Comparing resistivity to half life ...94
Figure 37: Wicking test results for filament PET fabric with treatments at 24 Hrs after treatment and after laundering compared to cotton ...96
Figure 38: Wicking test results for spun PET fabric with treatments at 24 Hrs after treatment and after laundering compared to cotton ...97
List of Tables
Table 1: Example of a Triboelectric Series [10] ...7
Table 2: Another example of a Triboelectric Series [11] ...8
Table 3: Conductivity Classification Ranges [13] ...11
Table 4: Fabric properties of cotton fabrics...36
Table 5: Treatments and concentrations used in experimentation...36
Table 6: Design of experiment for tribocharging test...37
Table 7: Design of Experiments of resistivity test ...38
Table 8: Design of experiment for wicking test ...39
Table 9: Tukey-Kramer Means Comparison of charge accumulation of all fabrics and treatments...57
List of Equations
Equation 1: Formula for calculating resistance………..…………..9
Equation 2: Formula for calculating resistivity ………..10
Equation 3: Formula for calculating resistivity of a square sample ……….10
1 Introduction
For the textile industry, static electricity is a major concern. During
manufacturing, charges can cause clinging amongst fibers yarns and fabrics. This increases the risk of fibers clumping together causing irregularities, or materials lapping around rollers which can shut down manufacturing. Static discharge is also another huge concern for textile manufactures. The need for understanding the mechanics of static electric has greatly increased in recent years as the processing speeds of machinery have increased. Likewise, the use of synthetic polymers is on the rise and its products are becoming more complex. This increases the potential for of static related issues in that polymers are
insulators and can accumulate and hold large static charges.
chemical treatments on polyester fabric modify the tribocharging process and the dissipation process. These results will then be compared against standard cotton fabrics which will be used as the control. This research will also challenge the validity of the current industrial practices of justifying an anti-static treatment’s performance by dissipation rate alone. Surface resistivity will also be measured and examined for any correlation to static charge accumulation and decay.
1.1
Purpos
e
The purpose of this research is to observe the effectiveness of current antistatic finishes on the surfaces of spun and continuous filament polyester plain woven fabrics and compare their static charge generation/dissipation properties to that of cotton plain woven fabrics. This research will examine the ability of current antistatic treatments to effectively prevent static accumulation and dissipate it quickly as well as their durability characteristics. Additionally, the research will examine the resistivity of the fabric surfaces. The resistivity of the fabric surface will be compared to the accumulation and dissipation results in order to
1.2 Objectives
The primary objectives of this research are as follows:
1. Investigate that the application of surface modifying polymers lead to significant reductions in the static charge generated on polyester fabrics
2. Investigate that functional durability can be generated using structured ionic interactions between polymers combined with structured interactions between the functional polymers and the polymers surface.
3. Investigate whether the charge decay time and surface resistivity are correlated since contradictory results have been published regarding the effect of material resistivity on static decay.
1.3 Significance of Research
Currently there are several commercial antistatic treatments available for polyester fabrics. Many of these treatments are tested for effectiveness by means of surface resistance or resistivity measurements. However, very few have studied how these treatments affect static accumulation or the actual
understand the mechanism by which the treated fabric’s surface accumulates and dissipates charge.
2 Literature Review
2.1 Static Electricity Theory
2.1.1 History of Static Electricity
The history of static electricity is documented and can be found in the following sources [3-7][8]
The timeline of knowledge about static electricity begins somewhere between 620 and 546BC which is believed to be the approximate life span of Greek Philosopher Thales of Miletus. Thales stumbled upon the mystery of static electricity and began performing experiments on friction using items such as amber and cat fur. By rubbing these items together, Thales was able to observe the effects of a statically charged object. William Gilbert was a British scientist in the late 1500’s, early 1600’s, and one of the many scientist who further
conductor and insulator.[6] In 1733, Charles Francois de Cisternay DuFay determined that electricity had two forms; vitreous or glass and resinous or amber. Vitreous items included glass, crystals and animal fur. Resinous
materials were amber, copal, silk and paper.[6] When rubbed together, vitreous items are attracted to resinous items, yet they are repelled by other vitreous objects. Benjamin Franklin was the first to used the terms negative and positive to describe static charges in his publication “Experiments and Observations on Electricity” in 1751.[4] The first triboelectric series list was created by Wilche in 1757.[7] The triboelectric series is a list of materials ranked in order starting with the materials that had the most tendencies to be positive to those that are
negative. This means that if two materials on the triboelectric series are rubbed together, the material located at the top of the list relative to the other will
2.1.2 Phenomenon of Static Electricity
Electrification is creating an electric charge on an object.[12] When the object happens to be an insulator which greatly reduces the ability of the charge to flow, the process is termed static electricity.[12] Triboelectric charging, otherwise known as triboelectrification or tribocharging, is the process of charging dielectric
or effects of charging by contact and rubbing are hard to distinguish, the two are often used synonymously.[11] The IEEE Standard Dictionary of Electrical and Electronic Terms adds to the definition of tribocharging by mentioning the three forms of interaction as 1) separation by sliding of two dissimilar objects, 2) interaction at solid-liquid interface, 3) breaking of liquid-gas interface.[4] As two materials come into contact with one another and are separated, electrons have the potential to transfer from one material to the other. This makes the material that lost electrons be more positive and the material that gained electrons more negative. Objects composed of more conductive materials allow the charge to rapidly travel through the material toward a grounding source or return to equilibrium through means of backflow at separation.[9]
With dielectric materials, however, meaning the material is an insulator and electrons do not flow easily, the charges accumulated from the exchange of electrons will remain on the surface of the materials. The ability of a material to allow charge to flow is quantified by its conductivity, which is opposite to
resistance or resistivity of the material. Resistance is the lack of ability to
conduct an electrical current, expressed in ohms (Ω).[9] As shown in Equation 1, resistance is the potential difference in volts (V) divided by the current (I).
Equation 1: Formula for calculating resistance
I V
Resistance is dependent on the distance between two electrodes and cross-section area. Resistance gets smaller as the cross cross-section area decreases and larger as the distance between electrodes increases.
Resistivity on the other hand is an intrinsic property of a material and is not dependent on its geometry. As shown in Equation 2, Resistivity is given by resistance (R) times the cross section area (A) divided by the length of the sample between electrodes (L).
Equation 2: Formula for calculating resistivity
L RA
When the area of the material sample inside of the electrodes is square, the area of the sample is proportional to the electrode width. This allows the resistivity to be expressed in terms of width instead of area as seen in Equation 3.
Equation 3: Formula for calculating resistivity of a square sample
L Rw s
This gives resistivity the unit of ohm. However, to distinguish resistance from resistivity, resistivity is expressed in ohm/square.
The reciprocal of resistivity is conductivity which is often used to classify the behavior of a material into groups such as insulators, semiconductors,
Capacitance is defined as the measure of the ability of a nonconductor to store electrical energy by means of the potential difference across the surfaces of the nonconductor.[14] It can also be described as the quantified ability of a material to hold an electrical charge. Capacitance is denoted by the SI unit as Farad (F). The most practical farad unit to express electrostatic charge is picofarad or 10-12 Farad due to the low values of charge generation. Capacitance exists between two conductive surfaces separated by an isolative medium. When the charge (Q) is much greater than the electron charge e=1.602 10-19 C, capacitance is calculated using Equation 4 where V is the potential difference.
Equation 4: Formula for calculating capacitance
V Q
C
Knowledge of Triboelectricity has been around for centuries. Yet, due to its unpredictable nature and difficulty to reproduce experiments, little is certain about this subject. The mechanism of charge generation and dissipation has several accepted models available today that range in complexity, but all of these are constantly challenged by irregular experimentation results and observations. For Category Insulator Semiconductor Conductor Superconductor Conductivity
(S cm-1)
instance, it is readily stated and accepted that tribocharging occurs between two different surfaces, such as the IEEE definition given earlier,[4] yet it has been readily found in observations that two like materials will also exhibit an exchange in ions. Theories exist that slight molecular differences on the two surfaces are enough to cause ionic transfer, while others argue that it may be the result of the contact technique instead of the materials.[15]
A simple way to explain to conductance of insulators is using the conductive band model. In this model, the insulator has three band regions. The first is the Valence band. The valence band has lowest energy state and electrons fill this band first. The second region is the conductive band. In this band, electrons are free to flow. The space between the valance band and the conductive band is known as the forbidden band. In order for a charge to flow, electrons must have enough energy to jump from the valence band to the conductive band. Some will argue that this can be achieved through heating a material to energize the
electrons, but impurities in the forbidden zone is more strongly believed to be the conduit to allow electrons to pass.[13]
Figure 1: Illustration of Surface State Theory for low density limit charge transfer [16]
Figure 2: Illustration of Surface State Theory for high density limit charge transfer [16]
function to help create equilibrium. Yet the energy state of both insulators remains the same. In Figure 2, the insulators are in a high density system. The filled surface states of both insulators are relatively the same, but one has a higher work function. In order to create balance, the charge transfers from the insulator with the larger work function to that of the smaller work function. However, the charge transferred is large enough to raise the energy state of the lower work function. This type of transfer can often lead to an electrical field between the two insulators depending on the distance between the two.
2.1.3 Influencing Factors
speed. This literature will discuss the effects of environmental conditions as well as yarn and contact materials.
Temperature is documented to also have an effect on the electrostatic properties of a polymer. As with many factors, the effect of temperature is not as significant as relative humidity and is best observed when humidity is constant.[13] This is expected given the relationship between temperature and humidity. Warm air typically holds more moisture than cool air which can create a more conductive surface by means of humidity. It is also argued that the conductivity of semi-conductors and insulators tend to increase with temperature as the electrons have more energy to be propelled into the conductive band.[13] The
experimental results done by Suh [18] shows that static generation as a function of temperature is not linear. As seen in Figure 5, the charge potential is higher at 25۫۫C than at 20۫ C or 30۫C.
Figure 5 Effect of temperature on initial voltage generated on polyester yarn[18]
the results showed that yarn speed did have an increasing effect on the static charge while the preload force did not.[19] A more modern version of the experiment was performed by Suh [18] using multifilament and monofilament yarns. The results showed that the static generation for increasing speeds were significantly higher for the multifilament but not on the monofilament. The static decay rate however, was increasingly shorter for both yarns as yarn speed increased.[18]This Argument is debated by Lowell and Triscott whose experimental results showed that the charge generated was independent of sliding speed for nylon and PFTE surfaces.
force increased, the contact area between the two surfaces increased, allowing more electrons to transfer between the surfaces.[7]
Pionteck argues that impurities like ionic additives and moisture have greater
contributions to conductivities of materials than some of the items mentioned above making controlling such experiments difficult.[13]The outcome of charge transfer on dielectric surfaces is highly unpredictable. This is evident in the number of contradicting triboelectric series that have been published and the amount of repeat experiments published with varying results. This is because there are numerous factors that must be controlled even on the microscopic level in order to get repeatable charge transfer amongst dielectric surfaces.
These variables include surface variability, experimental variability, nature of contact and charge species.[16] Surface variability can include surface
impurities, oxides, pretreatments, surface roughness and geometry.[16] These factors are difficult to control yet can explain why charge transference has been
witnessed between two insulators of the same material. Charge Species refers to the mode of charge transfer by electrons, ions and material mass transfer.[16] This is a relatively new way of looking at charge transfer, since it is widely
assumed that electrons are the main mode of charge transfer. Experimental Variability is often used to refer to control environments of temperature and humidity. But this area also includes handling, storage and sequence of
experiments. Nature of contact includes procedures such as contact or rubbing technique. It is often accepted that the mechanism of charge transfer is the same for both. Castles [16] argues that even with similar techniques, variations occur on the molecular level such as local frictional forces, temperature effects
and mass transfer between surfaces.
2.2 Effects of Static Electricity
produce a single synthetic fiber at micro- and nano-scale. Static electricity is also utilized in filtration devices for small lint and dirt particles.[7]
2.2.2 Dangers of Static Electricity
The problem that arises from static accumulation and discharge in textile is varied in application and degree of danger. In manufacturing, difficulties can arise as static electricity can cause fibers to attract dirt or other fibers. Clinging fibers makes opening, extruding and carding fibers more difficult.[9] Static charges held in textiles during manufacturing can cause fabrics to cling
inappropriately causing off quality during dyeing, finishing and cutting operations. Parachutes have been known to open incompletely due to static cling which can be fatal. [4, 9, 21, 22] For the general consumer, charge accumulation is often developed while drying apparel in a dryer. This causes the clothing to drape inappropriately and feel uncomfortable to the user.
caused by clothing can reach charges great enough to ignite natural gas and air mixtures.[9, 23] Even removing sheets from a bed has the potential to create
sparks that could ignite flammable gases in the environment. This is a huge concern for medical field as hospital rooms are subject to having a large number of beds in rooms containing flammable gases used in anesthetics. [23]
Electrostatic dissipation is a huge area of concern when dealing with sensitive electronic equipments. [9, 21, 23, 24] Just as static discharge could ignite flammable gasses in the hospital atmosphere, Wilson [23] proves that static discharge generated by the human body and their clothing also has the potential to interfere with life saving electrical equipment. Paasi [25] mentioned that almost 30% to 50% of all failures of electrical devices discovered during the
manufacturing process are due to some form of electrostatic discharge.[25]
Below are examples of typical types of damage caused by static discharge that can occur at the approximate voltage level as well as typical situations that generate static charge.
120 V~ Damage Unprotected Microchip [25]
Removal of Polyester Hospital Bedding~60KV [23]
Sliding On Car Seat~13KV [21]
2.3 Currently Available Antistatic Processes
There are currently several different methods of combating the issue of static accumulation in fabrics. The two currently approaches used to achieve this are the integration of low percentage conductive materials into a fabric or chemically modifying the moisture retention properties of the fibers. Both of these methods depend on the philosophies of increasing the conduciveness of the fabric to promote quickly transferring any charge generated to ground.[10, 11] A source of lubrication can also be utilized to promote easy slippage of the fibers against each other to reduce the effect of frictional forces in the production of static accumulation. [10]
2.3.1 Addition of Conductive Material
The primitive method, notably similar to a coated wire, was first used in the 1960’s by companies like Bekaert and Brunswick, who used wires 8μm to 12 μm in diameter. [21] By the mid 1970’s, the reverse technology was being utilized commercially, where polymers such as polyester and nylon were being coated by metals like silver. This technology was mostly used in areas such as carpeting. Yet, in 2005, an article was released detailing a new technology by a
Spartanburg S.C. company that suffused carbon particles to the outer surface of nylon. [26] With the carbon being integrated into the composition of the fiber, cracking and flaking of the metallic coating is reduced which increases the
durability of the product.[26] The method also allows for a fabric to be woven and provide enough comfort to be used in an industrial garment.
Technology in this area still continues to grow. Though, treatments involving the integration of metals are generally considered to be durable, the challenge that still plagues the use of metals in anti-static fabrics is the inherent dark, metallic appearance of the yarn.
used to coat carbon, the oxide can help to reduce the visible effect. The oxides conductivity can be increased by doping them with other metals.
There is also a class of polymers that have conductive characteristics similar to metals. These polymers have been an area of interest since the late 1980’s. [21] One major obstacle has been getting these polymers into a fiber. However, now there are several patents available that allow for polymers like polyaniline,
polypyrrole and polythiophen to be utilized to either coat polymers or to be integrated into the polymer fibers. [21]
2.3.2 Non-Durable Chemical Treatments
Anti-static chemical treatments are vast and varied. There are numerous
launderings.[21] Several factors must be considered when selecting the appropriate anti-static finish. Fiber and fabric type are crucial in the selection along application method and any additional chemicals used for other finish effects.
Commercial non-durable anti-static processing finishes are generally ionic and hygroscopic, meaning that they function by absorbing and retaining moisture from the environment increasing surface conductivity. These finishes are commonly used in the textile industry for the alleviation of unwanted clinging or discharging during the production processes. These finishes are generally intended to be removed easily without affecting the final fabric appearance or performance. They must be heat stable, non-corrosive, low flammability and volatility as well as low foaming.[10]
The most common category of non-durable anti-static finishes is the anionic alkyline group which includes esters of phosphoric acid.[10] The esters of phosphoric acid, much like the other finishes in this classification, are
Figure 7 Anionic Non Durable Anti-static Phosphoric ester[27]
The remaining two groups of non-durable anti-static finishes are cationic and non-ionic finishes. Commonly used cationic and non-ionic materials used include alkyl methyl ammonium chloride and polyoxyethylene glycol derivatives (Figure 8 and 9 respectively). [10]
Figure 9 Non-Ionic Non-Durable Finish[10]
Applications of cationic finishes are fairly simple as they can be applied through exhaustion processes. Non-ionic finishes include ethoxylated fatty esters, alcohols and alkylamines, and usually have good moisture regain attributes. [10]
2.3.3 Durable Chemical Finishes
Most durable chemical finishes are based off one of the four basic concepts: 1) Block Copolymer, 2) Crosslinking, 3) Surface Hydrolysis, and 4) Surface
Modification.
tetraethylenepentamine and block copolymers of polyetbylene terephthalate with a polyoxyetbylene glycol are two of the finishes that are attached to fabric
surface by means of surface affinity and retain surface modifying effects after several launderings according to Holme.[21] These solutions are generally either applied by means of pad-dry or exhaust dye methods. Permalose T and Milease T are two brand names that were based on these block copolymers. The attributes of these finishes include soil-release and anti-soil-redepostioning and making the fabric surface more hydrophilic. However, washing fabrics finished with these compounds in alkaline detergents repeatedly will eventually deteriorate their functionality. [21]
Surface hydrolysis is another form of fabric surface treatment that is said to be used to gain anti-static properties. The surface of the fabric is treated by padding it with alkaline treatments increases the concentration of carboxylic acid salt on the surface. The layer of salt creates a hydrophilic surface. However, the amount of fiber weight loss can be an issue of concern. Additionally, the degree of water hardness can influence the effectiveness of the antistatic properties.
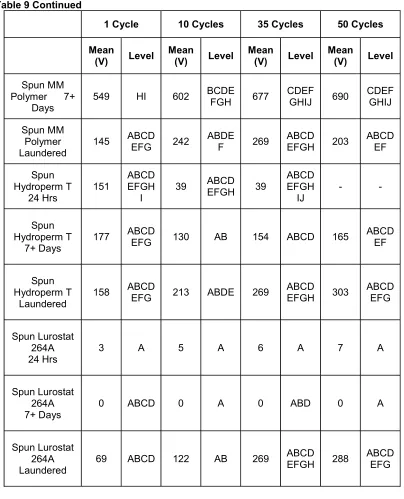
Figure 10 Crosslinking of polyamines[10]
As a higher degree of crosslinking is achieved to obtain durability, moisture regain is lost. So the balance between effectiveness and durability still applies. This technique is usually suitable for nylon and a specific finish, Polytherm, is used for cottons as well.[21]
2.3.4 Surface Grafting
several forms including chemical modification, UV curing, and plasma treatment. The benefits of grafting are that the additives are used in small concentrations and are generally durable. Chemical modification and surface coating
techniques are often very economical however they do involve the use of
solvents which may be harmful to the environment. UV curing as well as plasma treatment can eliminate the use of solvents. UV curing is also energy efficient and has a short curing process time. [13] Plasma treatments have gained notoriety for being environmentally friendly. Yet, these treatments are also able to obtain physical, thermal and chemical properties that are not achievable by conventional methods including being able to create high concentrations of chemically active species at temperatures low enough to avoid damaging treated fibers. [27] Plasma treatments are able to impact the surface layer of the polymer generating wettability, surface conductivity, surface etching and scouring. [27]
2.4 Demand
$5 billion dollars worth of electronics are damaged in manufacturing or consumer usage each year is the United States due to static electricity.[4] In textile
manufacturing, warping or surface damage to steel rollers caused by the lapping and removal of statically charged material is very costly. As technology
Burlington®, DuPont®, W L Gore® and Associates, Milliken® & Company (US) and
3 Methodology
This methodology is given to illustrate the steps and equipment utilized in this research in order to accurately obtain the data. The equipment and procedures used during testing are given in detail. With careful consideration of the
information delivered in this section, the results of this experimentation should be relatively reproducible given the known unpredictability of static electric behavior.
3.1 Project Design
The purpose of this project is to examine the effects of four different antistatic treatments on polyester yarns and observe the mechanism through which the treatment achieves its results. The benefit of this research is to further
understand the mechanism of antistatic treatments for polyester with the ultimate objective of being able to assist in the development of new treatments that will allow polyester to share similar antistatic characteristics as those of cotton fabrics.
The first intent is to test the antistatic properties of two cotton fabrics in order to establish a control to compare with the performance of the polyester. The characteristics measured include resistivity, wicking and charge
the polyester samples with each of the treatments provided and for the same properties as previously mentioned. Finally, the fabric samples were laundered once using a non-interactive surfactant to examine for durability of the finish treatments.
The data were presented in a quantitative manner using graphs and tables, and then compared using statistical software. All equipment was maintained,
operated and calibrated as specified by instruction from the manufacturer or develop by the staff at NC State University.
The variables involved in this research are the two cotton fabrics and two polyester fabrics being used (see Table 4) and the antistatic treatments being applied to the polyester fabrics (see Table 5). All fabrics were supplied by Test Fabrics Inc.
salt, Leomin PN (Clariant). The second group of durable antistatic agents is composed of PET-polyoxyethylene glycol block copolymers, Hydroperm T from Clariant and an experimental moisture management polymer. The moisture management polymer has a higher molecular weight and higher polyoxyethylene glycol content. For the remainder of this discussion, the moisture management hydrophilic will be abbreviated as “MM Polymer".
Table 4: Fabric properties of cotton fabrics
Table 5: Treatments and concentrations used in experimentation
Treatment Concentration (%) Add On (%)
Lurostat 264A 0.1 0.1
Leomin PN 0.1 0.1
Hydrophilic Hydroperm T 0.5 0.5
Hydrophilic MM Polymer 0.5 0.5 Yarn Count Fabric Count Fabric Properties
Sample ID Warp (Denier) Weft (Denier) Warp (cm-1)
Weft (cm-1)
Fabric Weight
(g/m2)
Fabric Thickness (mm) Cover Factor (K)
Cotton1 130.0 122.5 128.0 67.0 120.0 0.17 23.0
Cotton2 126.0 142.5 63.0 57.0 74.0 0.18 15.8
Filament
PET 86.0 86.7 85.0 82.0 60.0 0.12 17.4
Spun
3.2 Design of Experiments
3.2.1 Tribocharge Test
The rubbing was performed for all samples using a movable steel contact head.
Table 6: Design of experiment for tribocharging test
*Cotton fabrics are only washed and not treated with antistatics
Parameters Levels
Fabrics Cotton1*, Cotton2*, Spun PET, Filament PET
Treatments Blank, Lurostat 264A, Leomin PN, Hydrophilic Hydroperm T, MM Polymer
Durability Before Laundering, After Laundering
Constants
3.2.2 Resistivity Test
Table 7: Design of Experiments of resistivity test
*Cotton fabrics are only washed and not treated with antistatics
Parameters Levels
Fabrics Cotton1*, Cotton2*, Spun PET, Filament PET
Treatments Blank, Lurostat 264A, Leomin PN, Hydrophilic Hydroperm T, MM Polymer
Conditioning Time
0 hrs, 4 hrs, 12 hrs, 24 hrs
Durability Before Laundering, After Laundering
Constants
3.2.3 Wicking Test
Table 8: Design of experiment for wicking test
*Cotton fabrics are only washed and not treated with antistatics
Parameters Levels
Fabrics Cotton1*, Cotton2*, Spun PET, Filament PET
Treatments Blank, Lurostat 264A, Leomin PN, Hydrophilic Hydroperm T, MM Polymer
Durability Before Laundering, After Laundering
3.3 Equipment
3.3.1 Rubbing System
spikes generated by irregular surfaces pushing up against the predetermined weight of the contact head.
Figure 11: Diagram of tribocharging equipment
Forward
Backward Potential
Probe
Bushing (Connected to a Stepper Motor)
Voltmeter
Computer DAQ System
Insulator Plate (fixed below) Rubbing Head
(movable above ) Load
Shaft
Figure 12: Picture of the dynamic tribocharging tester
Precautions were taking to ensure that other major factors were fixed and remained constant. The environmental conditions were kept constant at
approximately 21۫C and 43% relative humidity with the use of an environmental room. The force of the rubbing surface on the fabric sample was constant at 1 Newton. The velocity of the rubbing action was maintained constant at 47.4 mm/s and the device accelerates at the beginning of a rubbing stroke and decelerates at the end of a stroke at a rate of 406mm/s2. The stroke length of the rubbing mechanism was adjusted at 50.8 mm long. Further details on the individual components used in this apparatus can be found in the thesis
Controlled Load
Potential Probe
dissertation of Lu Liu. [1] Procedures for tribocharging test are explained in Appendix C.
3.3.2 Ionizing Gas Gun
An ionizing gas gun was used to clean the sample surfaces and remove any preexisting charge that may be present on the surface. The ionizing gas gun used in this research is the SIMCO® Neutralizing Air Gun. This gun is used to bombard the sample surface with both positive and negative ions. If the sample has a preexisting charge, the ions of the opposite charge will be attracted to the surface and neutralize the charge. Further details on this item can be found in the thesis dissertation of Lu Liu. [1]
3.3.3 Environmental Room
Environmental conditions were held constant using the Parameter Generation and Control, Inc. ® environmental room. The room is 3.25m in length, 2.64m in width and 2.64m in height. The available conditions range from 7 deg۫ C to 60 deg۫ C (+/- 0.1۫C) and from 10% to 95% relative humidity(+/- 1.0% R.H.).
the capability of measuring resistivity from the range of 104 ~1014 ohm/sq. The
testing was performed to the specifications of AATCC Test Method 76-2005.
Figure 13: Resistivity meter and concentric ring[1]
3.3.5 Wicking Test Setup
beaker. The test strip is held in place using another paper clip. A ruler is placed in the beaker beside the test strip to measure the distance that the water travels up the test strip at one minute, five minutes and ten minutes. Food coloring can be added to the water to increase the visibility of the water as it is wicked up along the test strips.
Figure 14: Picture of the wicking test setup
3.4 Understanding Signal Analysis of Tribocharging Test
Figure 16: Diagram of tribocharging test motion
Figure: 16 will be used along Figure: 15 to demonstrate this. Prior to point A1,
the computer is prompted to begin recording data before the contact surface and probe is set in motion. Both the contact surface and probe are mounted to the same unit so identical rate of motion is maintained. At point A1 the contact head
measures a greater area than what is beneath it. In this case, the probe is 3mm from the sample surface and measures the potential of an 8mm area of the fabric surface beneath it. So B1 in this research represents the area 4mm in front of the
probe because this is the position of the probe when it first starts to detect the area initially contacted by the contact head. At C1, D1 and E1 the peak is reached
since this area has been rubbed the most by the contact head. The size of this rubbed area is dependent on factors such as stroke length, and the width of the contact head. Ideally, the probe should end its stroke in the middle of the area that is contacted by the contact head the most. At D1 the probe momentarily
stops during the changing of directions. At E1, the probe has reversed direction
and now the probe is leading the contact. At F1, the probe is leaving the area
initially contacted by the contact head. At point A2, the probe is back to its
starting positing and the direction is reversed again. At A2, the area being
measured by the probe is outside of the area contacted by the contact head and should return back to its initial charge reading.
It is important to note that in the first half of the curve (A1-D1), the contact head is
leading the probe and therefore static charge is being measured. During the second half of the curve (D1-F1), the probe is leading the contact head and thus
is measuring the charge accumulated on the surface during positions A1-D1.
Because time has elapsed between the forward stroke (A1-D1) and the return
decaying materials, the second half of the curve may have a noticeably greater slope than the initial curve.. Charge Decay is recorded at the end of the test after the desired cycles have been executed. The probe is stopped at the D1 position
where the maximum charge is measured. As the probe rests in this area, the charge decay can be measured and recorded. It is important to note that this measuring device measures the potential difference of the surface and not charge. However, the potential difference does have a direct relation to the amount of charge on the fabric. Throughout this literature, charge accumulation and dissipation will be frequently referred to even though it is the potential difference being measured. This is mostly to maintain common verbiage with other literature on the subject.
4 Results and Discussions
4.1 Tribocharge Charge Accumulation
The graphs for each tribocharging test are found in Appendix F. Figures 17-22 is a graph of the average of the peak points of the given cycles for each fabric-treatment combination. Since cotton is characterized by its low static generation and fast charge dissipation, the cotton woven samples are considered as the control and are displayed on each of the graphs for comparison and
benchmarking. Each fabric was first washed using the procedures in Appendix A and then underwent tribocharging testing. These test samples are labeled
“Blank” samples to avoid confusion with the samples that underwent the laundering procedure performed on antistatic treated fabrics to examine the durability of antistatic finishes (see Appendix E). The initial testing procedure involved running the tribocharging machinery for a given period of time.
In order the achieve consistent results, the tribocharging procedure was followed as seen in Appendix C, which includes the manual counting of the number of rubbing cycles. The blank samples for both cotton samples and the surface modifying polymers were retested between 13 and 15 days later. The results from the second testing had results that appeared to be different from the original “blank” tests performed 24 hours after the samples were washed. It was decided to keep the data sets separate and to continue the testing at both 24 hours after washing or treating the samples with antistatic finishes to examine whether the time had any significant effect on the charge accumulated on the fabric samples surfaces as well as on the rate of accumulated charge decay. All of the remaining fabrics samples were tested 7 days after being treated. The assumption was made that 7 days is enough time for the fabric to rest and was chosen for the remainder of the fabric samples in a effort to conserve time. For the remainder of this thesis, this second group of testing will be referred to as 7+ days.
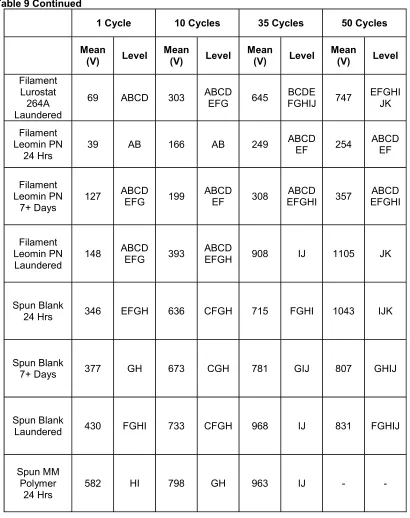
In Table 9 and Table 10, the entire population of data was considered for all Means Comparison using a Tukey-Kramer statistical analysis that is available in the statistical software JMP 7. The tables displaying the Tukey-Kramer test will exhibit the mean of each group and the level to where the treatments compare to the other treatments. The level with the lowest charge is designated with the letter “A” and descends in the alphabet as the charge ascends. Treatments that are statistically equivalent share the same letter. Some treatment may be
statistically like two or more ranks. In this instance, the treatment may have two or more letters such as “AB”.
0
500
1000
1500
2000
2500
Blank
MM
Polym
er
Hydroperm
T
Lurostat
264A
Leomin PN
Cotton1*
Cotton2*
Treatment
Potential (V)
1 Cycle 10 Cycles 35 Cycles 50 Cycles
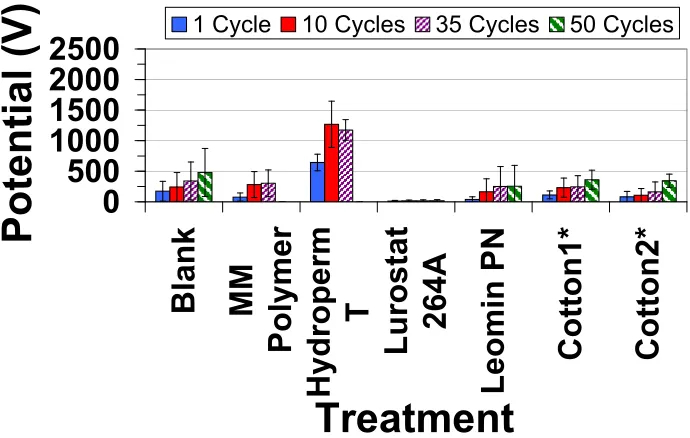
Figure 17: Charge accumulation of treated filament PET samples 24 Hrs after treatment compared to blank cotton samples
0
500
1000
1500
2000
2500
Blank
MM
Pol
ymer
Hydr
oper
m
T
Lur
ost
at
264A
Leomi
n
PN
Cot
ton1*
Cot
ton2*
Treatment
Po
tential (V
)
1 Cycle
10 Cycles
35 Cycles
50 Cycles
Figure 18: Charge accumulation of treated filament PET samples 7+ days after treatment compared to blank cotton samples
0
500
1000
1500
2000
2500
Bl
ank
MM
Po
lym
er
Hydr
oper
m
T
Lur
ost
at
264A
Leomin PN
Cotto
n1*
Cotto
n2*
Treatment
Potential (V)
1 Cycle
10 Cycles
35 Cycles
50 Cycles
Figure 19: Charge accumulation of treated filament PET samples 24 Hrs after laundering compared to blank cotton samples
0
500
1000
1500
2000
2500
Bl
ank
MM
Pol
ymer
H
y
droperm
T
Lurostat
264A
Leomin PN
C
o
tton1*
C
o
tton2*
Treatment
Poten
tial (V)
1 Cycle
10 Cycles
35 Cycles
50 Cycles
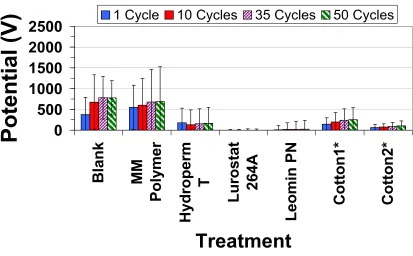
Figure 20: Charge accumulation of treated spun PET samples 24 Hrs after treatment compared to cotton fabrics
0
500
1000
1500
2000
2500
Bl
an
k
MM
Polymer
Hydroperm
T
Lurostat
264A
Leom
in PN
C
o
tton1*
C
o
tton2*
Treatment
P
o
ten
tial (V)
1 Cycle
10 Cycles
35 Cycles
50 Cycles
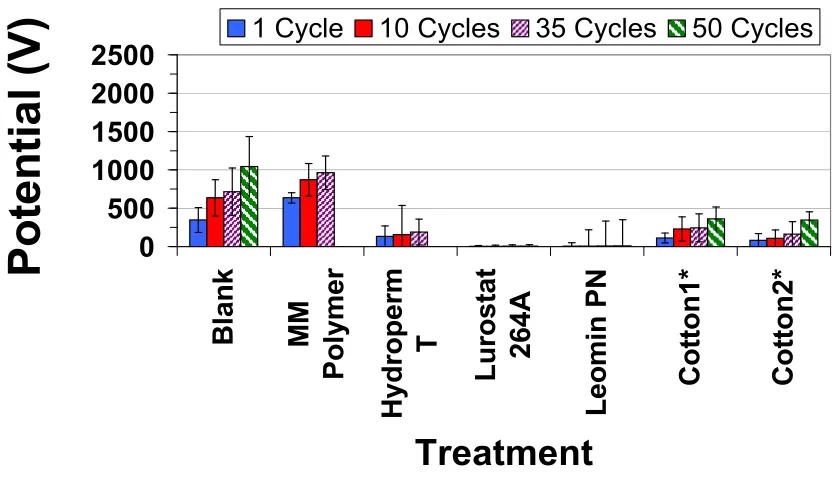
Figure 21: Accumulation of treated spun PET samples 7+ days after treatment compared to cotton fabric samples
0
500
1000
1500
2000
2500
Bl
an
k
MM
Polymer
Hydroperm
T
Lurostat
264A
Leom
in PN
C
o
tton1*
C
o
tton2*
Treatment
P
o
ten
tial (V)
1 Cycle
10 Cycles
35 Cycles
50 Cycles
Figure 22: Charge accumulation of spun PET with treatments compared to blank cotton samples at 24 hrs after single laundering
Table 9: Tukey-Kramer Means Comparison of charge accumulation of all fabrics and treatments
1 Cycle 10 Cycles 35 Cycles 50 Cycles
Mean
(V) Level Mean (V) Level Mean (V) Level Mean (V) Level
Cotton1
24 Hrs 113 ABCD 231 ABD 265 ABCDE 363 ABCDEFG Cotton1
7+ Days 143 ABC 196 ABC 238 AB 253 ABCDEF
Cotton1
Laundered 353 DEFGH 588 BCDEFGH 641 BCDEFGHI 655 FGHIJ BCDE Cotton2
24 Hrs 82 ABCDEFG 108 A 164 ABD 345 ABCDEFG Cotton2
7+ Days 62 ABC 74 A 89 A 104 AB
Cotton2
Laundered 122 ABCDEFG 359 ABCDEFGH 408
ABCD EFGH
I 414
ABCD EFGH Filament
Blank
24 Hrs 178
ABCD
EF 243 ABD 342 ABCDEFH 481 ABCDEFGH Filament
Blank
7+ Days 368 EFGH 740 FG 652
CEFG
HI 693 FGHIJ
Filament Blank
Laundered 684 I 593
BCDE
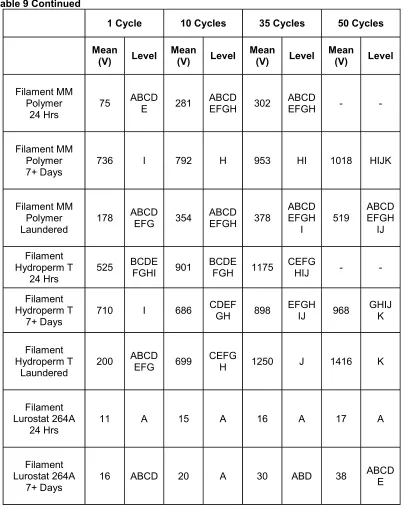
Table 9 Continued
1 Cycle 10 Cycles 35 Cycles 50 Cycles
Mean
(V) Level
Mean
(V) Level
Mean
(V) Level
Mean
(V) Level
Filament MM Polymer
24 Hrs
75 ABCDE 281 ABCDEFGH 302 ABCDEFGH - -
Filament MM Polymer 7+ Days
736 I 792 H 953 HI 1018 HIJK
Filament MM Polymer Laundered
178 ABCDEFG 354 ABCDEFGH 378 ABCDEFGH I
519 ABCDEFGH IJ
Filament Hydroperm T
24 Hrs 525
BCDE
FGHI 901 BCDEFGH 1175 CEFGHIJ - -
Filament Hydroperm T
7+ Days 710 I 686 CDEF
GH 898 EFGHIJ 968 GHIJK
Filament Hydroperm T
Laundered 200
ABCD
EFG 699 CEFGH 1250 J 1416 K
Filament Lurostat 264A
24 Hrs 11 A 15 A 16 A 17 A
Table 9 Continued
1 Cycle 10 Cycles 35 Cycles 50 Cycles
Mean
(V) Level Mean (V) Level Mean (V) Level Mean (V) Level
Filament Lurostat 264A Laundered
69 ABCD 303 ABCDEFG 645 BCDEFGHIJ 747 EFGHIJK
Filament Leomin PN
24 Hrs 39 AB 166 AB 249 ABCD
EF 254
ABCD EF
Filament Leomin PN
7+ Days 127
ABCD
EFG 199
ABCD
EF 308
ABCD EFGHI 357 ABCD EFGHI Filament Leomin PN
Laundered 148
ABCD
EFG 393
ABCD
EFGH 908 IJ 1105 JK
Spun Blank
24 Hrs 346 EFGH 636 CFGH 715 FGHI 1043 IJK
Spun Blank
7+ Days 377 GH 673 CGH 781 GIJ 807 GHIJ
Spun Blank
Laundered 430 FGHI 733 CFGH 968 IJ 831 FGHIJ
Spun MM Polymer
Table 9 Continued
1 Cycle 10 Cycles 35 Cycles 50 Cycles
Mean
(V) Level Mean (V) Level Mean (V) Level Mean (V) Level
Spun MM Polymer 7+
Days 549 HI 602 BCDE
FGH 677 CDEFGHIJ 690 CDEFGHIJ
Spun MM Polymer
Laundered 145
ABCD
EFG 242 ABDEF 269 ABCDEFGH 203 ABCDEF
Spun Hydroperm T
24 Hrs 151
ABCD EFGH
I 39
ABCD
EFGH 39
ABCD EFGH
IJ - -
Spun Hydroperm T
7+ Days 177
ABCD
EFG 130 AB 154 ABCD 165 ABCDEF
Spun Hydroperm T
Laundered
158 ABCDEFG 213 ABDE 269 ABCDEFGH 303 ABCDEFG
Spun Lurostat 264A
24 Hrs 3 A 5 A 6 A 7 A
Spun Lurostat 264A
7+ Days 0 ABCD 0 A 0 ABD 0 A
Spun Lurostat 264A
Laundered 69 ABCD 122 AB 269 ABCD
Table 9 Continued
1 Cycle 10 Cycles 35 Cycles 50 Cycles
Mean
(V) Level Mean (V) Level Mean (V) Level Mean (V) Level
Spun Leomin PN
24 Hrs 6 A 7 A 8 A 10 A
Spun Leomin PN
7+ Days 9 ABCD 18 A 20 ABD 24 ABCD
Spun Leomin PN
Laundered 333
CDEF
4.1.1 Charge Accumulation on Cotton Fabrics
Both of the cotton’s blank samples had little charge accumulation on the surface which is represented by to potential values measured by the tribocharging equipment. Cotton2 has a lesser cover factor and a lower mean of charge
accumulation than Cotton1. Even though the means of these two cotton samples appear to have vastly different mean values, due to the amount of variation in the population, they are statistically not different.
4.1.2 Charge Accumulation of Blank PET Fabrics
The filament PET blank samples at 24 hours after washing were not statistically different from the cotton samples, however, 7+ days after washing, the mean charge accumulated rose from 481V to 693V at 50 cycles. The mean charge at cycle 10 is higher than the mean at cycle 35 and 50 because some of the test had to be terminated prematurely due the charge approaching the safety limit of approximately 2KV. At this point the filament PET became statistically different from the cotton samples. After laundering, the mean rose even more to 742V. This value is not statistically different from the cotton samples.
The spun PET blank samples accumulated a greater mean charge than the filament PET blank samples and are significantly greater than the cotton
samples. At 24 hours after washing, the spun PET fabric accumulated a mean charge in excess of 1KV. After 7+ days, this mean was reduced to 807V and after a single laundering; it remained approximately constant with a mean of 831V.
On the fabrics treated with antistatic finishes, changes in electrostatic properties due to time may be caused by reorganization or migration of the chemical treatment at the fabric surface. Such modifications of the hydrophilic surface could make dissipation along the surface more difficult.
4.1.3 Charge Accumulation for Lurostat 264A on PET Fabrics
Based upon mean values, Lurostat 264A was the best antistatic treatment for reducing charge on the surface of both the filament PET and spun PET fabric samples. For the filament PET fabric samples, Lurostat 264A had means of charge accumulation of 17V and 38V respectfully, 24 hours after treatment and 7+ days after treatment. Some of these test runs did not produce any charge patterns that could be recognized. For these test runs, 0’s were input as the maximum charge at each of the given cycles. In the Tukey-Kramer Means Comparison analysis, the Filament PET-Lurostat 264A samples were placed at level “A”. This is an indication of the fact that not only did this treatment
Lurostat 264A also performed well on the spun PET fabric. Just like Lurostat on the filament PET fabric, the spun PET-Lurostat 264A combination was
statistically ranked at level “A” with mean values of 7V and 0V. Again, the level “A” indicates both the best performance in preventing charge accumulation on the fabric surface by having a small mean potential value and little variation.
When used to treat the spun PET fabric, the Lurostat 264A continued to remain effective after a single laundering. At 50 cycles the laundered spun PET-Lurostat 264A treated samples had a mean of 288V and remained statistically equivalent to the cotton samples. The filament PET fabric treated with the Lurostat 264A did not perform as well after a single laundering (747V); however, with the exception of the Cotton2 after 7+ days after treatment, it still was not statistically different from cotton.
4.1.4 Charge Accumulation for Leomin PN on PET Fabrics
On the spun fabric, the Leomin PN performed much better, accumulating mean charges of 10V and 17V in cycle 50 at 24 hours after treatment and 7+ days after treatment respectively. This is not significantly different from the cotton fabrics’ performance as well as the Lurostat 264A’s performance. However, after a single laundering, Leomin PN’s effectiveness is greatly reduced to the statistical level of the blank PET samples and not that of the cotton fabrics.
4.1.5 Charge Accumulation of MM Polymer on PET Fabrics
The MM Polymer demonstrated very unstable properties on the filament PET fabric. At 24 hours after the treatment, the MM Polymer performed well. According to the Tukey-Kramer Means Comparison statistical test, the filament PET-MM Polymer reduced the charge accumulation as well as the cotton fabrics. At 35 cycles, this treatment-fabric combination accumulated a mean charge of 302V at 24 hours after treatment. This is a greater mean charge than the Lurostat 264A and Leomin PN treatments on either PET fabric. After 7+ days, the performance of the MM Polymer on filament PET fabric decreased drastically and accumulated a higher mean static charge of 1018V at cycle 50. This is significantly greater charge than accumulated on the both non-durable
On the spun PET fabric, the MM Polymer accumulated a mean charge of 963V at cycle 35 at 24 hours after treatment and 690V at cycle 50 in 7+ days after
treatment. The 7+ days after treatment values are not significantly different from cotton1 and the Leomin PN treatment on filament PET fabrics. The values at 24 hours after treatment however are significantly greater than both the cotton fabrics and the non-durable treatments. After a single laundering, the
performance greatly increases again similar to the MM Polymer treatment on the filament PET fabric and statistically performs at the same level as the cotton fabrics and the non-durable treatments. Because the performance fluctuates drastically after the laundering process, its potential durability is difficult to judge.
4.1.6 Charge Accumulation of Hydroperm T on PET Fabrics
The Hydroperm T treatment on filament PET fabric accumulated a mean charge of 1165V in cycles 35 and 978V in cycle 50 for the 24 hours after treatment and 7+ days after treatment respectively. These values are statistically different from the cotton fabrics or the non-durable treatments. It is not significantly from that of the MM Poly treatment on both PET fabrics. These values are slightly
On the spun PET fabric, the Hydroperm T treatment reduced the amount of charge accumulated significantly to the level of the cotton fabrics and the non-durable treatments. At 24 hours after treatment, the Hydroperm T on spun PET fabric accumulated 39V in cycle 35 and 165V in cycle 50 at 7+ days after
treatment. After a single laundering, it accumulated a mean charge of 303V in cycle 50 which is also not statistically different from that of the cotton fabrics. This suggests that the Hydroperm T treatment has some durability after a single laundering.
4.2 Static Dissipation
0
20
40
60
Bl
ank
MM
Pol
ymer
Hydr
operm
T
Lurost
at
264A
L
eom
in
P
N
Cotton1*
Cotton2*
Treatment
H
a
lf Life
(S
eco
n
ds)
24 hrs
7+ days
After Laundering
Figure 23:Half Life Time of treated filament PET samples 24 Hrs after treatment compared to cotton samples
0
500
1000
1500
2000
2500
Bl
an
k
MM
Pol
yme
r
Hydroperm
T
Lurostat
264A
Leom
in P
N
Cot
ton1*
Cot
ton2*
Treatment
Potential (V)
0 seconds
30 seconds
Figure 24: Dissipation Comparison of 0 seconds and 30 seconds of dissipation for the filament fabric 24 hours after treatments compared to cotton
0
500
1000
1500
2000
2500
Blank
MM
Pol
yme
r
Hydroperm
T
Lurost
at
264A
Leomin PN
Cot
ton1*
Cot
ton2*
Treatment
Po
tential (V)
0 seconds
30 seconds
Figure 25: Dissipation Comparison of 0 seconds and 30 seconds of dissipation for the filament fabric 7+ days after various treatments compared to cotton
0
500
1000
1500
2000
2500
Blank
MM
Polymer
Hydr
oper
m
T
Lu
rostat
264A
Leomin PN
Cotton1*
Cotton2*
Treatment
Potential (V)
0 seconds
30 seconds
Figure 26: Dissipation Comparison of 0 seconds and 30 seconds of dissipation for the filament fabric 24 hours after a single laundering compared to cotton
0
20
40
60
Blank
MM
Polymer
Hydr
operm
T
Lur
ost
at
264A
Leom
in PN
Cot
ton1*
Cot
ton2*
Treatment
H
alf
L
ife
(Seconds)
24 hrs
7+ days
After Laundering
Figure 27: Half Life Time of spun PET samples at varying times after treatment compared to cotton samples
![Figure 10 Crosslinking of polyamines[10]](https://thumb-us.123doks.com/thumbv2/123dok_us/1366989.1169455/45.612.91.390.80.335/figure-crosslinking-of-polyamines.webp)