Division VIII
DEVELOPMENT OF FAULT SYMPTOM EARLY DETECTION MODEL
USING PATTERN RECOGNITION FOR THE MAJOR COMPONENT OF
NUCLEAR POWER PLANT
Dae-Woong Kim1, Ji-Ho Min2, Chi-Young Park3, Yang Seok Kim4 , Byoung Oh Lee5
1
Principal Researcher, Equipment Engineering Lab., Korea Hydro & Nuclear Power Co., Korea 2
Assistant Researcher, Equipment Engineering Lab., Korea Hydro & Nuclear Power Co., Korea 3
Group Leader, Equipment Engineering Lab., Korea Hydro & Nuclear Power Co., Korea 4
Principal Researcher, Equipment Engineering Lab., Korea Hydro & Nuclear Power Co., Korea 5
Senior Researcher, Equipment Engineering Lab., Korea Hydro & Nuclear Power Co., Korea
ABSTRACT
The early detection technology has been introduced to prevent a failure of the equipment by pre-detecting minute abnormalities between normal operating ranges and set points to reduce the loss from unplanned maintenance costs by pre-identifying the failure and making provision for it. we developed an early detection algorithm based on pattern learning and artificial intelligence, verified the appropriateness of the developed models, applied the models to the power plant in reality and detected equipment abnormalities via early detection system. we describe a method for pattern learning in major equipments of the power plant and a way to detect abnormalities of the equipment with applying the early detection technique.
1. INTRODUCTION
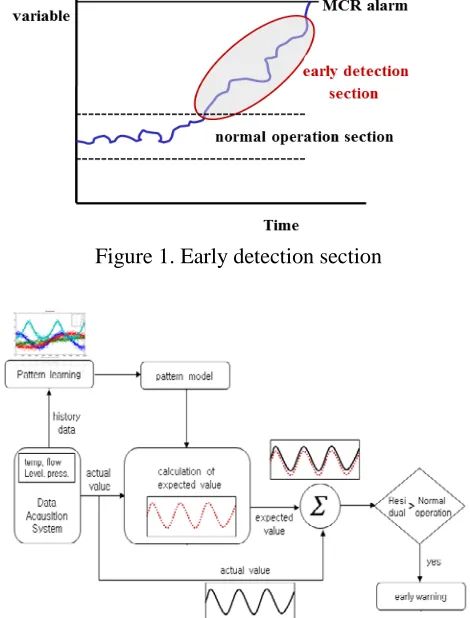
Real-time, online monitoring on major equipments operating in nuclear power plant such as turbines, pumps, and valves is carried out in the Main Control Room (MCR). The primary method for monitoring takes the following step. Main variables (e.g. temperature, pressure, rate of flow, etc.) those equipments are monitored in real time, and the normal ranges of the measured values are set based on the degree of deviation. When any measured value of the variables exceeds the set point, an abnormal alarm is generated. Though this set-point based monitoring method of the nuclear power plant has been used for a long time and its reliability has been approved, but it is difficult to detect minute changes or abnormalities found between normal operating ranges of monitoring variables and set points of MCR warning through this method. A failure of the equipment derives from a minute abnormality. When the abnormal state continues to accumulate, it may cause a serious accident that leads to a failure of the equipment or the trip of a nuclear power plant. The fault symptom early detection method has been introduced to prevent a failure of the equipment by pre-detecting minute abnormalities between normal operating section and MCR alarm set point(Figure 1.). It can be reduce the loss of unplanned maintenance costs by pre-detecting the equipment failure. As computing capacity and data storage technology rapidly develop in recent years, the development of fault symptom early detection technique for abnormality of equipments based on artificial intelligence algorithm and pattern recognition has been active. In this paper, we describe a method for pattern learning in major equipments of the power plant and a way to detect abnormalities of the equipment while applying the early warning technique.
2. PRINCIPLE OF EARLY DETECTION BASED ON PATTERN RECOGNITION
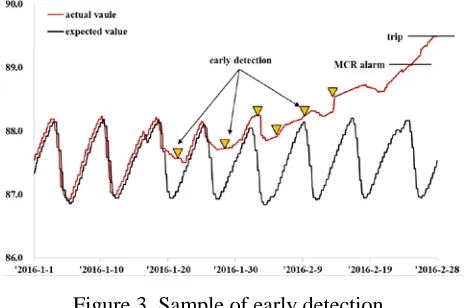
variables (e.g. temperature, pressure, etc.) acquired from the detector of power plant equipments (e.g. pump, valve, etc.) are collected in the data acquisition system. A pattern model is generated through pattern learning based on the historical data of each variable during the past 18 months operation. A pattern model is classified as such if the pattern of normal operation during the 18-month operation period is similar, regardless of the type of equipment or variable. The similarity of the patterns means that the variables are correlated and that one variable is affected by other variable on the same pattern model. The algorithm is configured in the following manner. When the actual value measured in the field is entered into the predictive value computation engine in real time, the most similar pattern is identified through the pattern learning model and the expected value is calculated by weighting. Then, the residual of two values (actual value minus expected value) is calculated and an alarm generated if the residual is out of the normal operation range.
Figure 1. Early detection section
Figure 2. Principle of early detection based on pattern learning
X
(1) d = (2)
The measurement vector is collected and the Euclidean distance(d) is calculated to evaluate the similarity with the memory vector
Where
The Gaussian Kernel is mainly used to give a weight(ω) to the calculated distance.
(3) (4)
Here, h is the kernel bandwidth and ω is the weighted value of memory vector.
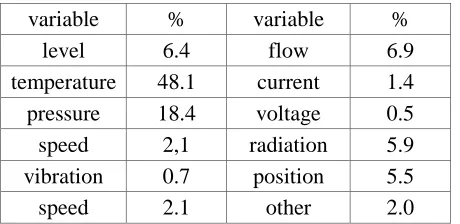
Finally, the weighted value(ω) is combined with the memory vector(X) and used in estimating the value. According to the pattern learning technique, monitoring variables, which are operated in a similar pattern during the normal operation period, are grouped into an analogous pattern group and the operation data in the past is learned first. Then, the present measured value and the predictive value based on pattern learning are compared. Figure 3 shows a sample of early detection. This figure shows the pattern of actual value deviate from the pattern of expected value.
Figure 3. Sample of early detection
3.RESULT OF THE MONITORING VARIABLES SELECTION AND PATTERN LEARNING
3.1 Selection of the monitoring variables
and voltage that reflect changes of the equipment status in the pump, turbine, and generator are useful in the early detection system. On the contrary, variables including the on/off contact signal and sudden damage on a control card are generated instantly without any prior sign or symptom. These variables are not eligible for early detection monitoring since the changing trend of the value is unpredictable and there is no specific pattern. Table 1 shows the equipment and parameters selected for the early detection monitoring for a one unit of nuclear power plant, Table 2 shows the distribution of selected variables according to physical quantities and Table 3 shows a monitoring variables of main equipments.
Table 1 : The number of equipments and variables for a one unit of nuclear power plant
system equipments variables
primary system 84 486
secondary system 81 610
I&C system 32 239
electric system 3 67
other system 6 22
total 206 1,424
Table 2 : Selected variables according to physical quantities.
variable % variable %
level 6.4 flow 6.9
temperature 48.1 current 1.4
pressure 18.4 voltage 0.5
speed 2,1 radiation 5.9
vibration 0.7 position 5.5
speed 2.1 other 2.0
Table 3 : Monitoring variables of main equipments.
equipment monitoring variables
main feedwater pump
suction/exit press. speed, exit flow temp. bearing temp, motor wire temp., etc. (148 tags)
turbine HP exhaust press., vibration bearing #1X, speed, main steam temp., etc. (60 tags)
reactor coolant pump differential press., seal flow press., seal heat EX exit temp. bearing temp., etc. (104 tags)
3.2 Pattern learning and grouping
parameter of the accuracy in early detection. Thus, the validity of the grouping results based on correlation coefficients was verified. Experts on nuclear power plant operation and equipments participated in determining the appropriateness and confirmed the final grouping based on the grouping appropriateness test that examines whether each variable within groups is mutually affected during actual operation and whether the affected movement pattern is similar to the actual phenomenon.
Correlation coefficient
=
Here, x = random variable(x), y = random variable(y), = average of x, = average of y
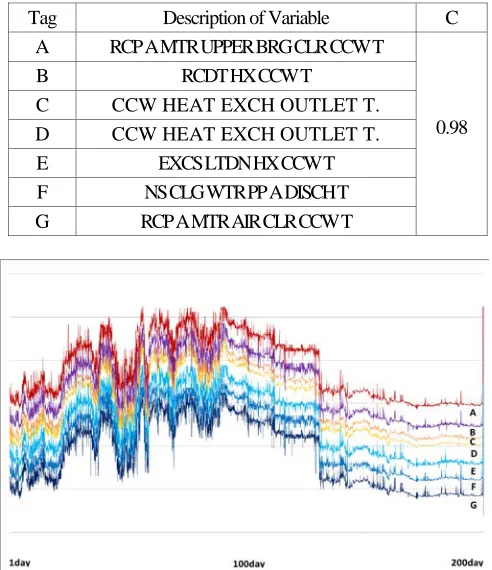
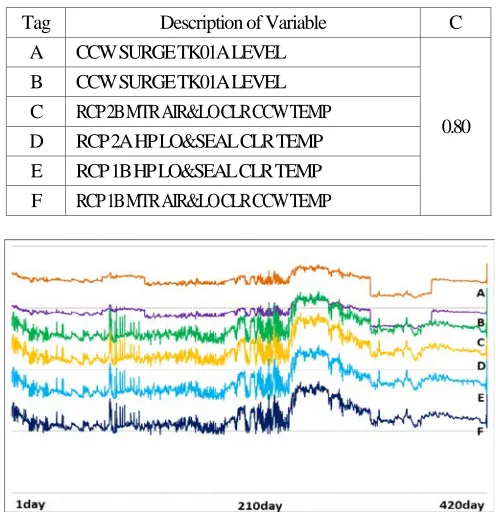
Grouping results for similar pattern monitoring variables showed that 259 pattern groups were generated from 1,424 variables in one unit nuclear power plant. Figure 4 and figure 5 are show representative samples of the similar pattern group. Figure 4 represents a similar pattern group based on seven monitoring variables including outlet temperature of the circulate cooling system and cooling water temperature of the reactor coolant pump. The 200-day operation data exhibits high similarity in terms of operation data patterns and the correlation factor is 0.98, meaning that the level of similarity in this group is fairly high. Figure 5 shows a case that six monitoring variables including the surge tank level of the circulated cooling water system and seal cooling water of the reactor coolant pump are grouped as a same pattern group. The data pattern during 420 days is highly similar and correlation factor is 0.8, which is sufficient for the grouping criteria.
Tag Description of Variable C
A RCP A MTR UPPER BRG CLR CCW T
0.98
B RCDT HX CCW T
C CCW HEAT EXCH OUTLET T.
D CCW HEAT EXCH OUTLET T.
E EXCS LTDN HX CCW T
F NS CLG WTR PP A DISCH T
G RCP A MTR AIR CLR CCW T
Tag Description of Variable C
A CCW SURGE TK01A LEVEL
0.80 B CCW SURGE TK01A LEVEL
C RCP 2B MTR AIR&LO CLR CCW TEMP
D RCP 2A HP LO&SEAL CLR TEMP
E RCP 1B HP LO&SEAL CLR TEMP
F RCP 1B MTR AIR&LO CLR CCW TEMP
Figure 5 : Similar pattern group case B (CCW & RCP)
4. DETECTION OF EQUIPMENT ABNORMALITIES
Figure 6 shows the occurrence of early detection due to the conductivity rise of the stator cooling water system. On March 28, 2016 (12:16:48), the conductivity of the stator cooling water rises suddenly from
0.03
㎲/cm to 0.09
㎲/cm. At that time the first early detection alarm is generated and the conductivity
vaule is continued until March 29, 2016 (15:48:00). Since the set point of the MCR was 0.5
㎲/cm
(normal operation value 0.3㎲/cm) so that no alarm came from the MCR. Following the early detection
alarm, the stator cooling water system at the power plant was inspected and identified very tiny leakage of tube pinhole. We started to fix the leakage part. From March 30, 2016 (09:04:48), the leakage was completely blocked and the conductivity of the stator cooling water was recovered to normal condition.Figure 6 : Case of early detection alarm on stator cooling water system
possible to detect the issue sooner in the early detection system. Thus, it is useful in eliminating potential causes for equipment breakdown.
5. CONCLUSION
The development of IT technology such as smart sensor and artificial intelligence technology has a great impact on monitoring and diagnosis of equipments at the power plant. In particular, it greatly contributes much to online monitoring and diagnosis as well as early detection techniques that process numerous variables and a vast amount of data in real time. In this paper, we developed an early warning algorithm based on pattern learning and artificial intelligence, verified the appropriateness of the developed models, applied the models to the power plant in reality and detected equipment abnormalities via early detection system. The following conclusions were drawn through the technological development and verification process.
ㆍ It is recommended that the load of the data communication network, the operation speed of the computer and the importance of the monitoring target equipment are taken into account in the selection of monitoring variables.
ㆍ Since similar pattern grouping is crucial in computing expected values, it is necessary to perform a second grouping process to find out whether there is physical similarity in plant operation in reality through reviews from operation experts following the initial grouping based on correlation factor analyses.
ㆍ After the development of the model, it should be verified whether the model reflects the characteristics of the power plant operation and equipments and whether early detections were appropriate through trial operations and the model should be modified and complemented accordingly
According to Heinrich's 1:29:300 rule, there are a number of associated minor accidents and signs before a major accident takes place and therefore early detection of signs and coping with them can prevent major accidents. In this sense, early detection systems that detect early signs of equipment failure and generate alarms are expected to contribute to the improvements of operational efficiency and safety of the power plant while eliminating the potential causes of equipment failures and unplanned outages of the plant.
REFERENCES
Hines, J. W., Garvey D., Seibert, R., and Usynin, A. (2008). “Technical Review of On-Line Monitoring Techniques for Performance Assessment”, NUREG/CR-6895, Vol. 2, U.S.NRC, USA..
Rasmussen, B., Hussey, A., and Davis, E., (2004). “Equipment Condition Assement – Application of On-Line Monitoring Technology” EPRI, Palo Alto, CA, 2004, 1003695.
Davis, E., Funk, D., Hooten, D., Rusaw, R., (2006). “On-Line Monitoring of Instrument Channel Performance”, EPRI, TR-104965-R1
Hines, J. W., Garvey, D. R., (2006). “Development and application of Fault Detectability Performance Metrics for Instrument Calibration Verification and Anomaly Detection”, Journal of Pattern Recognition Research, 2-15, pp.2-7.
Zhang, Q., Basseville, M., Benveniste, A., (1994). “Early Warning of Slight Changes in Systems”, Automatica, Vol. 30, Issue 1, pp95-113.