SOME CORRELATIONS I N SUGAR BEETS
F. S. HARRIS AND J. C. HOGENSON Utah Experiment Station, Lagan, Utah
[Received March 21, 19161
INTRODUCTORY
The beet sugar industry, amounting to hundreds of millions of dollars every year, is the direct result of scientific breeding done on the sugar beet, which has been developed from a plant with a sugar content too low to permit of the commercial extraction of sugar, up to its present high sugar content. If the industry is to be permanent, it is necessary to maintain in the sugar beet its present high sugar content; and it is highly desirable to increase the percentage of sugar as much as possible. This means that breeding methods will need to be applied to the sugar beet as long as it is used in the manufacture of sugar.
The improving of any plant is necessarily a slow and expensive process. This is particularly true of the sugar beet, since two years are required for the production of seed, and also a vast amount of expensive chemical work is necessary in determining the quality of the plants. I t is, therefore, highly desirable to learn as much as possible of the nature of the sugar beet and of the correlation of its various characters in order, if possible, to obtain short cuts in the process of improvement.
At the UTAH EXPERIMENT STATION the selection of sugar beets has been going on for thirteen years. During this time, fairly complete records, including pedigrees, have been kept. These records furnish the data necessary to determine the correlation of characters herein discussed.
LITERATURE
Considerable work has been done on the correlation of different char- acters in sugar beets; but the results are not entirely uniform and they have led to considerable divergence of opinion.
*CO,RRELATION I?; SUGAR BEETS 335
TOWAR
(1901) found that the varieties of beets which gave the high- est yield contained the lowest percentage of sugar.MAAS (1906) obtained results which showed that the percentage of sugar within a variety decreased as the weight of the beet increased, but the rate of increase was not the same, so that the total quantity of sugar was more dependent on the quantity than on the quality of beets.
ANDRLIK and
URBAN
(-1908) showed from analyses that abnormally large sugar beets had a characteristically low sugar content.Later, they in conjunction with BARTOS (ANDRLIK, BARTOS and
UR-
BAN 1912) concluded that the weight of sugar beets is more readilymodified than the sugar content. They denied the truth of the state- ment that the greater the weight the less the sugar content except in extreme, and hence rare, cases. From data presented, they conclude that the weight of the beet root shows fluctuating variability in accordance with the QUETELET-GALTON law. Each strain shows its own correlation between root weight and sugar percentage. I n only a few unusual cases does it occur that low sugar content accompanies a very unusual root weight, and these cases probably result from abnormalities in the use of plant food.
HARRIS
and GORTNER (1913) conclude that the notes presented by ANDRLIK, BARTOS, andURBAN
“form a very slender basis for the con- clusion that in beets of the same strain there is no negative correlation between weight and sugar content. Nevertheless one must recognize the possibility of the correctness of the conclusion. Should it be valid, the suggestion follows that the negative correlation demonstrated in com- mercial cultures has a genetic origin, i.e., that strains characterized by large root size are also characterized by low sugar content, and that when these strains are intermingled and intercrossed in field cultures there results a negative correlation between the weight of the individual beet and the sugar content of its juice.’’METHODS
The work reported in this paper was done at the UTAH EXPERIMENT STATION in Logan, Utah. It was begun in 1902, when a number of strains of seed were obtained from the U. S. DEPARTMENT OF AGRI-
CULTURE and from local sugar companies. Since that time, selections
have been made for high sugar content and yield and for desirable size and shape of beets.
From the beets raised each year samples having a desirable size and
F. S. HtPIRRIS X S D J. C. H O G E S S O S
336
shape were saved and analyzed. The very large and the very small beets were eliminated and only the medium beets saved. This eliminates the extremes which ANDRLIK, BARTOS, and
URBAN
consider to be the only ones in which a negative correlation between .size and sugar con- tent is shown. Certainly if these extremes had been included, the cor- relation would have been more striking.The analyses were made from pulp obtained by boring a diagonal hole through each beet. The beets were then siloed over winter i n dry sand and in the spring were planted four feet apart each way. During tlie blossoming period, the tops were covered with mosquito bar to prevent an interchange of pollen by insects. -4t maturity of tlie seed, determina- tions were made of the height of plants, number of stems, average number of leaves on each stem, weight of seed, and number of days from planting to maturity of seed. These data, together with the weight of the mother beet and the percentage sugar it contained, furnish the material for the correlation tables which are here presented.
The method of calculating the coefficient of correlation and the prob- able error is that explained by EUGENE DAVENPORT in his “Principles of Breeding,” pp. 419-472. Where there is a perfect correlation in two characters, the coefficient of correlation is I , while if there is no correla-
tion the coefficient is zero. As the correlation varies from none to com- plete, the coefficient varies from o to I . Ilihere tlie correlation is negative the coefficient is preceded by a minus sign.
CORRELATIONS
I . W e i g h t of beet and sugar content
As pointed out in the literature review, there has been considerable controversy over the relation between the size of beets and their sugar content.
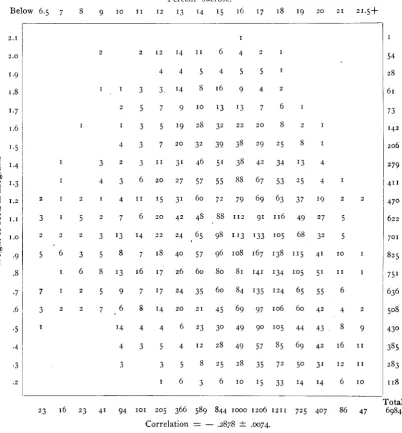
Table I shows results for 6984 beets which were raised during a
CORRELATION I N SUGAR B E E T S 337
TABLE I
Correlatiott of weight of beet with percentage sugar
Percent sucrose.
Below 6.5 7 8 9 IO I I 1 2 13 1 4 1 5 16 1 7 18 19 20 2 1 z1.5+
3 I 5 2 7 6 20 42 48 88 I I Z 91 116 49 27 5
2 2 z 3 13 14 2 2
5 6 3 5 8 7 18 40 57 96 108 167 138 1 1 5 4 1 IO I
24 ,65 98 113 I33 105 68 32 5
I .8 ~
6 2 2
701
w
O 1.0 r'
M
;
.97 I 2 5 9 7 I 7 24 35 60 84 735 124 65 55 6 3 2 2 7 < 6 8 14 20 2 1 45 69 97 106 60 42 4 2
I 14 4 4 23 3O 49 go I O 5 41 43 8 9
4 3 5 4 12 28 49 57 85 69 42 16 I I
3 3 5 8 2 5 28 35 72 50 31 1 2 I I
I 6 3 6 IO 1 5 33 14 14 6 IO
.8
636
508
430
385
283
1x8
.7
.6
.4
.2
I
2 2 1 2 14 1 1 6 4 2 I
4 4 5 4 5 5 '
I I 3 3 1 4 8 1 6 9 4 2
2 5 7 9 1 0 ' 3 ' 3 7 6 I
I I 3 5 19 28 32 2 2 20 8 a I
4 3 7 2 0 32 39 38 29 2 5 8 I
I 3 2 3 I I 3' 46 5' 3s 42 34 '3 4
I 4 3 6 2 0 2 7 57 55 ss 67 53 2 5 4 1
j
61I
73 142~ 206
1 2 7 9
Me,an weight of beets 9328 .OZg7; standard deviation 3.681 f .e210 Mean percent sucrose 16.1327 f .om5; standard deviation 2.537 f .0145
F. S . HARRIS A N D J. C. HOlGENSON 338
Above
22 I 1 1 I I
2 2 2 5 3 8 ~ 2
21 5 I8 I2 I2 I 1 3 3 I
20 9 23 41 49 56 I7 7 2 .6 2 I
5
22
65 213
2 19
4
;
18 2 I7%
2
5 1 5
2
14 ; I 6c1 U
6 1 0 1 0 1 7 1 5 5 2 z z r I 3 I
I IO 16 18 12 8 I
5 1 2 2 1 1 2 5 3 I I
2 7 I3 I7 11 4 I
I 4 1 1 1 0 6 I
I g 15 15 12 I
27 39 35 56 71 45 17 12 7 3 I 3 I 317
38 56 61 103 142 96 50 16 9 8 6 3 4 592
5 17 32 76 97 59 21 13 12 5 7 6 I 351
9 4 9 I1 I5 9 9 I7 4 I 1 9 4 4 115
7 9 7 8 1 2 1 3 5 3 5 7 6 3 4 8 9
7 15 15 17 12 1 1 11 8 7 2 3 I 6 I15
120 231 293 439 487 276 129 77 54 40 34 25 21 Correlation = . q g f .0143.
#Mean weight of seed .37@ k .034c&; standard deviation 2.384 -C .0241
Mean percent sucrose 16.7800 f .0433; standard deviation 3.029 -C . 0 3 d
75
1 6 6
60
55
33
CORRELATION I N SUGAR BEETS 339 3. Height of plant and weight of seed
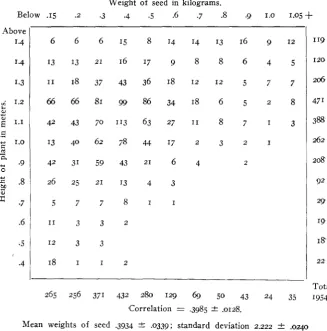
Table 3 gives results with 1954 beets, and shows a correlation of .3985 The higher plants, therefore, have with a probable error of f.0128.
more seed than the lower ones.
TABLE 3
CorreEation o f height of plants with weight of seed produced.
Weight o f seed in kilograms.
Below .I5 .2 .3 .4 .5 .6 .7 .8 .9 1.0 1.05
+
Above1.4
1.3
$ 1.2
L W
4-
;
1.1CJ 1.0
m
a
-
U -9
4
.8.;
.-
.6
.5 .4
6 6 6 15 8 14 14 13 16 g 12
13 13 21 16 17 9 8 8 6 4 5
11 18 37 43 36 18 1 2 12 5 7 7
6 6 6 6 8 1 ~ 8 6 3 4 1 8 6 5 2 8
42 43 70 113 63 27 11 8 7 I 3
13 40 62 78 4 17 2 3 2 I
42 31 59 43 21 6 4 2
26 25 21 13 4 3
5 7 7 8 1 1
1 1 3 3 2
12 3 3
1 8 1 1 2
119
I 2 0
zo6
47 I 3%
262
208
92
29.
I9 18' 22
I
I
Correlation = ,3985 a .0128.
Mean weights of seed .3934 2 .0339; standard deviation 2.222 _+ .w40
Mean height of plant 1.1150 2.0324; standard deviation 2.125 rt .mzg
4. W e i g h t of mother beet and yield of seed
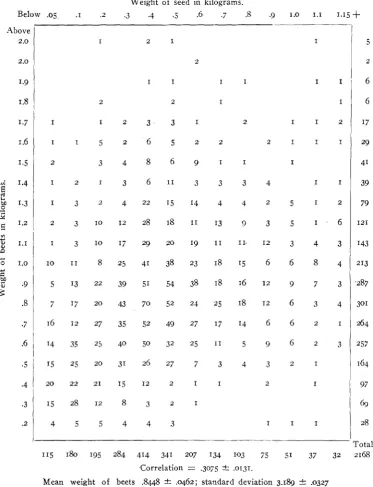
A comparison of the relative quantity of seed produced by 2168 beets showed that there was a correlation of .3075 e . 0 1 3 1 between quantity of seed and the weight of the mother beets. That is, large beets on the average yielded more seed than small ones.
F. S. HARRIS A N D J. C. H O G E S S O S
340
Above 2.0
2.0
1.9 1.8
1.7
1.5
$ 1 . 4
E
E
$ 1 . 3 c 1.2
$ 1 . 1
n
o 1.0
2
.9
-
.C 3.*
v1
Y
u
M
.I
5
TABLE 4
Correlatioit of weight of niotlier beet with w e i g h t of seed produced. Weight of seed in kilograms.
_ _ _
I
I 2 1 I I 5
2 2
I 1 I 1 1 1 6
2 I 1 6
I 1 2 3 3 1 2 1 1 2 1 7
1 . 6 1 1 5 2 6 5 2 2 2 1 1 1 2 9
2 3 4 8 6 9 1 1 I 41
I 2 I 3 6 1 1 3 3 3 4 1 1 39
I 3 2 4 22 r j 14 4 4 2 j I 2 79
z 3 IO 12 28 18 I T 13 9 3 j I 6 121
I 3 IO 17 zg 20 19 11 11 12 3 4 3 143
IO 11 8 25 41 38 23 18 I j 6 6 8 4 213
5 I3 22 39 51 54 38 18 16 12 9 7 3 287
~ 2
.8
I
7 I 7 20 43 70 j2 24 25 18 12 6 3 4 .7 ~ 16 12 27 3 j 52 49 27 17 14 6 6 2 I.6
I
14 35 25 40 50 32 25 11 5 9 6 2 3r j 25 20 31 26 27 7 3 4 3 2 I
.4 20 22 21 I j I 2 2 I I 2 I
.3 I j 28 I2 8 3 2 I I
.5
I
2 4 5 . 5 4 4 3 I 1 1
_ _
1 1 5 1% I95 284 414 341 207 I34 I03 75 51 37 32 301 264
257
164 97
69
28 Total
COIRREL-~TIOX I N SUGAR BEETS 341
5.
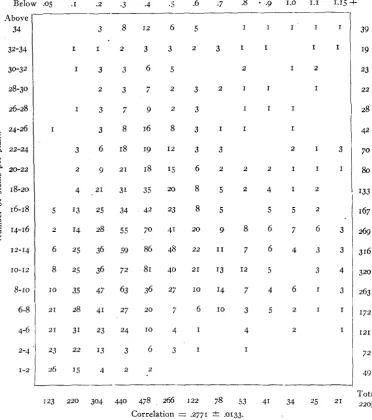
N u m b e r of stems and yield of seedTable
5
shows a correlation of .2771, with probable error of rr4.0133,between the number of stems on each plant and the weight of seed. As would be expected, the plants having most stems produce the largest quantity of seed.
Below .OS . I .z .3 .4 .5 .6 .7 .8
-
.9 1.0 1.1 1.15 Above .34 3 8 1 2 6 5 1 1 1 1 1 3 9
32-34 1 1 2 3 3 2 3 1 1 I I
30-32 1 3 3 6 5 2 I 2
28-30 2 3 7 2 3 2 1 1 I
26-28 1 3 7 9 2 3
24-26 I 3 8 1 6 8 3 I I I
I 1 1
i 9 a 22-24
t
20-22 2 ~ 2 1 1 8 1 5 6 2 2 2 I I IG 18-20
3 6 18 19 12 3 3 2 1 3 7 0
e
1.I
4 ~ 1 3 1 3 j m8 5 2 4 I 2
E,
i
U
0
5 5 2
16-18 5 13 25 34 42 23 8 5
2
14-16 2 I4 28 55 j0 41 20 9 8 6 7 612-14 6 25 36 59 86 48 22 11 7 6 4 3 3
10-12 8 2; 36 72 81 40 21 13 12 5 3 4
8-ro IO 35 47 63 36 27 IO 14 7 4 6 I 3
2 j 20 j 6 IO 3 5 2 I I
I
4-6 24 IO 4 I 4 2
2-4 22 3 6 3 1 I
1-2 26 15 2 2
6-si
;;
::
;i
4-
19 23
22
28
42
80
I33 167 3 2 6 9
316 320 63
I j 2
I21
72 49
F. S. HARRIS A S D J. C. XOGESSON
342
6. Number of days t o mature and yield of seed
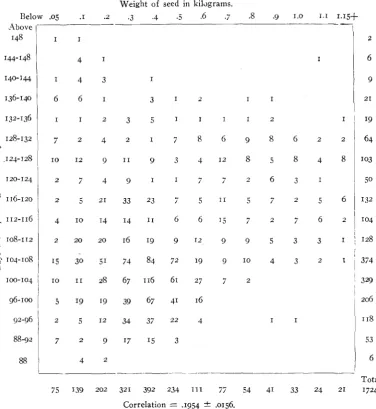
The time required to mature seed varied from 88 t o 148 days, most of the beets maturing in about 105 days. Table 6, including 1724 beets, shows that the yield of seed was somewhat higher in the beets requiring the longest time to mature. The coefficient of correlation between these characters was .1g54 k.0156.
TABLE 6
Correlation of number of days to niature with the weight of seed produced. Weight of seed in kilagrams.
-4bove 148
144-148
140-144
136-140
$132-136
a
w
_- L
I 1 2
4 1 I 6
I 4 3 J 9
6 6 I 3 1 2 I 1 2 1
I I 2 3 5 I I I I 2 I I 19
2
121-128 IO 12 9 11 Q 3 1 12 8 5 8 4 8.- 3
8
.U 103
120-124 Y
.d
F
116-120z
112-116E
2 108-112
2 104-108
U
9
U
in
2 7 4 9 I I 7 7 2 6 3 I
2 j 2 1 33 23 7 5 11 5 7 2 5 6
i
11:
4 I O 14 14 11 6 6 r j 7 2 ; 6 21
1042 20 20 16 IQ 9 12 9 9 5 3 3 I
'
12815 30 j~ $1 84 $ 2 19 9 I O 4 3 2
88-92
88
7 2 9 I7 15 3 53
4 2 6
Below .05 .I .2 .3 .4 .5 .6 .7 .8 .g 1.0 1.1 I . I ~ + A b o v e ,
29 1 1 3 8 I7 7 3
.29 1 2 3 2 6 1
28 1 2 3 4 1
27 I 3 8 2 2
2 6 1 2 6 9 1 2
25 I 5 I O I2 2
24 4 8 1 5 6 2 2
23 2 8 1 6 7 3
22 I 7 8 1 6 1 8 3 2 1
21 4 5 1 4 1 2 9 1 I 1
2 0 5 19 21 19 I8 I 2 3 I I I
19 17 40 31 31 22 16 3 2 I
18 I5 26 27 25 33 I7 6 I 2 I
17 I4 27 19 16 25 21 5 I z 2 I
16 3 15 27 41 40 14 7 5 3 2 3 I 3
1 5 ' 1 0 I7 23 43 43 20 I4 4 2 5 6 2 3
1 4 ~ 6 11 24 41 43 26 I4 11 2 5 2 3
13 3 4 1 2 2 4 2 7 1 9 7 9 6 4 2 5
I2 5 I5 26 50 37 22 16 Io 12 3 7 3 6
11 6 ~ 1 6 2 0 2 6 1 6 6 g 4 5 3 z
IO 8 12 28 34 29 IO 12 12 11 6 3 5 3
9 3 5 4 3 6 7 4 6 7 5 4 3 2 5 9
9 23 7 7 10 9 5 1 2 2 3 I
120 211 292 426 469 263 121 77 55 41 33 25 21
Mean weight of seed .3%5 2 .0349; standard deviation 2.403 f .0247 Mean number of leaves per stem 15.8222 & .gIO; standard deviation 4.886 f .os02
GENETICS 1: Jy 1916
40 I5 I 1
I
1621
30 37 36 56 47 Io0
163 I53 I33 164 192 I88
122
212
1 1 1 6
I73
344 F. S . HPlRRIS A X D J. C. HOGENSON
While there seems to be some correlation between the number of leaves on each stem and the quantity of seed produced by a beet, it is not so great as between some of the other characters already compared. Table
7 shows this correlation to be .1217 k.0143.
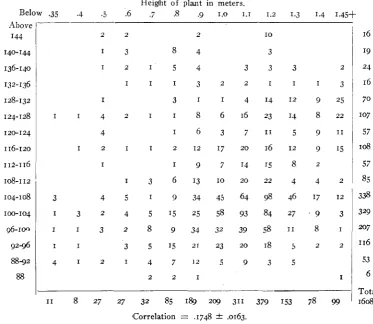
8. Number of days to nzature and height of plants
On comparing the days to mature with the height of plants, it is found in table 8 that a relationship exists, but this relation is not great, the correlation being .1748 k.0163. The taller plants require a slightly longer time to mature than shorter ones.
TABLE 8
Correlation of the days t o mature with the hpight of plants. Height of plant in meters.
Below .35 .-+ .5 .6 .7 .8 .g 1.0 1.1 1.2 1.3 1.4 I.45+
Above I
I 3 I I 4 I4 I 2 9 25
I I 4 2 I I 8 6 1 6 2 3 1 4 8 2 2 1 0 7
I44 140-144 136-140
1
70
2
132-136s
.++ 128-132
.-
,X 124-1285 120-124
116-120 E
Y
$ 112-116
.-
Y9 1 0 8 - 1 1 2
-
a8
Io4-Io82 100-104
92-96 88-92
88
2 2 2
I 3 8 4
IO
3
3 4 5 I 9 34 45 64 98 46 I 7 12
I 3 2 4 5 I5 25 58 93 84 27 ' 9 3
I I 3 2 8 9 3 4 3 2 3 9 5 8 1 1 8 I
I 1 3 5 15 Z T 23 20 18 5 z 2
4 1 2 I 4 7 ' 2 5 9 3 5
2 2 1 I
338 329 207
I 16 53 6
I
1
TotalI 1 8 27 27 32 85 1% 209 311 379 I53 78 99 1608 Correlation = .1748 f .0163.
Mean height of plant 1.0940 f .0381; standard deviation 2.~56 f .o&
345 1COIRRELATION I N SUGAR B E E T S
9. Percemtage sugar in mother beet and time to mature seed
Table g shows a negative correlation of -.1292 with a probable error of *.or55 between the sugar content and the date of maturity of seed. That is, the higher the sugar content of the mother beet the less time is required to mature seed. The correlation is low however.
I 1 2 4 5 5 3
2 4 1 3 4 7 1
3 2 3 3 3 2 2 1 1
I 4 8 6 1 0 8 1 1 1 5 5 2 I
TABLE g
Correlation of the days to mature seed with the percentage sucrose in the mother beet.
Percentage sucrose in mother beets.
Below 8.5 g IO 11 12 13 14 15 16 17 18 19 20 21 21.5+
-
Above 1
4
I I I 3 3
21
22
2o
74 140-144
136-140 132-136 128-132
I 24- 128 120- 124 116-120 112-116 108-112 104-108 100-104 9 6 - 1 0 0
92-96 88-92
88
I22
I 7 15 14 15 11 25 12 14 4 4
I 4 6 8 5 1 5 1 5 4 I I 60
5 8 7 5 6 8 16 11 17 18 14 15 7 I I I39 2 8 8 14 23 16 20 7 5 105
I 28
I I
4 4 3 3 2 5 3 7 1 9 4 1 1 8 9 8 2
I I 2 2 6 7 12 IO 12 86 139 63 42 14 3 400
2 3 I 5 11 6 g 85108 61 38 6 6 34' 212
I I 2
1 1 5 3 3 3 3 6 7 9 4 6 2 6 8 I
I 2 1 1 3 4 9 2 6 1 7 2 I
I 2 6 1 6 1 4 8 3 2 52
6 Total
I I 2 1 1
!Correlation = - .12gz 1 .or55.
Mean percent sucrose in mother 17.5831 & .037I; standard deviation 2.3548 '..o& Mean days to mature III.O~OO f .IW; standard deviation 12.384 f ,134
346 F. S. HARRIS AND J. C. HOGENSON
27
26
25
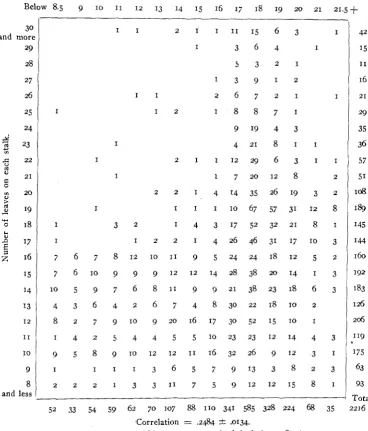
I O . Sugar of mother beet and leazes on each stalk TABLE IO
Correlation of the nuniber of leaves on each stalk with the PerceAtage sugar
in the mother beet.
Percentage sucrose in mother beets.
Below 8.5 9 I O I I 12 13 14 1.5 16 17 18 19 20 21 21.5+ I
1 3 9 1 2 16
I 1 2 6 7 2 1 I 21
I I 2 1 8 8 7 1 29
and more 29
I 1 2 I 1 1 1 1 5 6 3 I
I 3 6 4 I
42
I5
24 9 1 9 4 3
r'
5 22 I 2 I 1 1 2 2 9 6 3 I I
I 1 7 20 I2 8 2
v1 20 2 2 I 4 1 4 3 5 2 6 1 9 3 2
I9 I I I I IO 67 57 31 IZ 8
3
23 I 4 2 1 8 I I;
21U1
FJ
>
"0 18 I 3 2 1 4 3 17 52 32 21 8 I
b
2 17 I I 2 2 I 4 26 46 31 17 I O 3
16 7 6 7 8 12 I O 11 9 5 24 24 18 12 5 2
15 7 6 IO Q 9 9 12 12 14 28 38 20 I4 I 3 14 IO 5 9 7 6 8 1 1 9 9 2 1 3 8 2 3 1 8 6 3
13 4 3 6 4 2 6 7 4 8 3 0 z z 1 8 1 0 2
12 8 2 7 g I O g 20 16 17 30 52 15 IO I
E,
I O
9 1 1 1 1 13 3
8 2 2 2 1 3 3 1 1 7 5 9 1 2 1 2 1 5
Total and less
52 33 54 59 62 70 107 88 I 1 0 341 585 328 224 68 35 2216 Correlation = 2484 & .0134.
Mean percent sucrose 16.8642 2 . o 4 1 ; standard deviation 3.080 -t .0312
CORRELATION I N SUGAR BEETS ' 347
Table I O shows a variation in the number of leaves on each stalk from
about 8 to about 30. The correlation of this character with the sugar content of the mother is shown to be .2484 2.0134. This coefficient of correlation seems sufficiently large to justify the statement that as the mother beet increases in sugar there is a tendency for more leaves to grow on each seed stalk.
.
SUMMARY
The tables which have been presented show the following correlations
I , Weight of beet with percentage sugar = -.2878
+-
.0074.2. Percentage sugar in the mother beet with quantity of seed pro-
3. Height of plants with weight of seed produced = .3985 k.0128. 4. Weight of mother with quantity of seed produced = .so75 k . 0 1 3 1 .
5. Number of stems on each plant with the quantity of seed pro-
6. Number of days to mature with quantity of seed produced =
7. Number of leaves on each stalk with quantity of seed produced =
8. Days to mature ,with height of plant = .1748 k.0163.
9. Percentage of sucrose in mother beet with days to mature seed =
IO. Percentage of sucrose in mother beet with number of leaves on
of characters in sugar beets :
duced = .004g k.0143.
duced = . q 7 1 2 . 0 1 3 3 .
.1954 k.0156.
.I217 k.0143.
-.1292 - c . o I ~ ~ .
each stalk = .2484 4.0134.
LITERATURE CITED
ANDRLIK, K., and URBAN, J., 1908 Abnormally large beets. Zeitschr. Zuckerindus: Bohmen 32: 493-495. Abstract Exp. Sta. Record 2 0 : 747.
ANDRLIK, K., BARTOS, V., and URBAN, J., 1912 The mutual relations of weight and sugar content in Beta vulgaris saccharifera. Zeitschr. Zuckerindus. Bohmen
36 : 193-210. Abstract Exp. Sta. Record 27 : 642.
HARRIS, J. A., and GORTNER, R. A., IQ13 On the relationship between the weight of the sugar beet and the composition of its juice. Jour. Indus. Engin. Chem.
5 : 192-195, and Biochem. Bull. 2 : 524.529.
LASKOWSKY, N., 1893 The relation between the size and composition of 'beet seeds and
the size and composition of the roots produced by them. Landbote 14 : 600. Abstract Exp. Sta. Record 5 : 335.
Landw. Jahrb. 35: 84-113.
Michigan Exp.
Sta. Bull. 197, pp. 140-144.
MAAS, H., 1go6 Investigations on correlation in fodder beets. TOWAR, J. D., IWI The influence of size of beets on sugar content.