©
DOI: 10.1534/genetics.104.035816
A General Framework for Statistical Linkage Analysis
in Multivalent Tetraploids
Rongling Wu
1and Chang-Xing Ma
Department of Statistics, University of Florida, Gainesville, Florida 32611
Manuscript received September 1, 2004 Accepted for publication February 16, 2005
ABSTRACT
In multivalent polyploids, simultaneous pairings among homologous chromosomes at meiosis result in a unique cytological phenomenon—double reduction. Double reduction casts an impact on chromosome evolution in higher plants, but because of its confounded effect on the pattern of gene cosegregation, it complicates linkage analysis and map construction with polymorphic molecular markers. In this article, we have proposed a general statistical model for simultaneously estimating the frequencies of double reduction, the recombination fraction, and optimal parental linkage phases between any types of markers, both fully and partially informative, or dominant and codominant, for a tetraploid species that undergoes only multivalent pairing. This model provides an in-depth extension of our earlier linkage model that was built upon Fisher’s classifications for different gamete formation modes during the polysomic inheritance of a multiva-lent polyploid. By implementing a two-stage hierarchical EM algorithm, we derived a closed-form solution for estimating the frequencies of double reduction through the estimation of gamete mode frequencies and the recombination fraction. We performed different settings of simulation studies to demonstrate the statistical properties of our model for estimating and testing double reduction and the linkage in multivalent tetraploids. As shown by a comparative analysis, our model provides a general framework that covers existing statistical approaches for linkage mapping in polyploids that are predominantly multivalent. The model will have great implications for understanding the genome structure and organization of polyploid species.
B
ECAUSE of their biological and economic impor- Different from bivalent polyploids, multivalent poly-tance, polyploids have long been a focus of genetic ploids pair their chromosomes among more than two and evolutionary analyses (BeverandFelber1992;Soltis homologous copies at meiosis. The consequence of thisandSoltis2000). One of the most useful tools for these multivalent pairing is the formation of double reduction;
analyses is provided by genetic linkage maps constructed i.e., two sister chromatids of a chromosome sort into the from molecular markers, which allow not only for com- same gamete (Darlington 1929). Fisher (1947) pro-parative studies of genome structure and organization posed a conceptual model for characterizing the proba-across different polyploids (da Silvaet al.1995;Ming bilities of 11 different modes of gamete formation for et al.1998), but also for the characterization of specific a quadrivalent polyploid in terms of the recombination loci affecting quantitatively inherited traits (Meyeret al. fraction between two different loci and their double 1998;Minget al.2001). However, compared to diploid reductions. Although Fisher’s model did not have the species, linkage analysis in polyploids is complicated by capacity to estimate the linkage and double reduction, their underlying meiotic processes. For bivalent poly- it provides a theoretical foundation for S. S.Wuet al. ploids in which only two chromosomes pair during meio- (2001) to successfully derive a closed-form solution for sis, there are higher pairing probabilities between more estimating these parameters within the maximum-likeli-similar chromosomes than between less maximum-likeli-similar chromo- hood context. To clearly describe the idea, Wuet al. de-somes. Whereas many models assume random pairings rived their EM-implemented algorithm on the basis of
(Hackettet al.1998;Ripolet al.1999;Luoet al.2001), fully informative markers that display completely different
we have derived a host of statistical models that integrate alleles between two parents. Because each multilocus ge-the so-called chromosomal pairing preference (Sybenga notype observed in a full-sib family is formed with a predict-1994) within a linkage analysis framework (Maet al.2002; able mechanism (see S. S.Wu et al. 2001 for a detailed
Wuet al.2002a). description of this), it can be made possible to derive the closed-form solution for estimating the recombination fraction and double reduction.
While fully informative markers represent only a sub-1Corresponding author:Department of Statistics, 533 McCarty Hall C,
University of Florida, Gainesville, FL 32611. E-mail: [email protected] set of polymorphic markers in polyploids, it is essential
to develop a more general model that has power to used to derive the frequencies of the other seven gamete modes in which marker ᏹ has no double reduction. analyze those partially informative markers, such as
domi-Ultimately, Luo et al. was able to derive the formula nant markers or markers with multiple dosages.Luoet
for calculating the coefficient of double reduction at al.(2004) proposed a statistical model that attempts to
markerᏺ. consider different marker types. A key step of Luo et
The above derivation has been strictly based on the al.’s model is the derivation of the frequency of each
assumption that the frequency of double reduction at gamete formation mode as a function of the
recombina-a mrecombina-arker is determined by the frequency of double tion fraction and double reduction at one marker (see
reduction at its linked marker and the recombination their Table 1). To show Luo et al.’s deriving process,
fraction between these two markers. However, as re-we suppose there are two fully informative markers,ᏹ
vealed by cytological and molecular experiments, this and ᏺ, that are linked with recombination fraction r.
assumption that has facilitated Luoet al.’s linkage analy-Assume that markerᏹis closer to the centromere than
sis is hardly met in practice. The values of double reduc-marker ᏺ so that the coefficient of double reduction
tion are observed to range from 0 to almost 30% at marker ᏺ is larger than the coefficient of double
(HaynesandDouches1993) and are likely to be
spe-reduction (␣) at markerᏹ(Darlington1929;Fisher
cies, chromosome, and position dependent (Butruille
1947). Denote four different alleles byM1, · · · ,M4for
andBoiteux2000). In a genetic mapping study of
culti-markerᏹ and byN1, · · · ,N4for marker ᏺ. Thus, we
vated tetraploid alfalfa with microsatellite and AFLP have a total of 24 allelic configurations or linkage phase
markers, 20 loci that display significant double reduc-assignments between the two markers, one of which is
tion are sporadically distributed throughout the ge-schematically expressed as
nome (Julier et al. 2003). For example, on linkage group 6 composed of nine loci, only markers MTIC153 M1
N1
兩
M2 N2兩
M3 N3
兩
M4 N4
兩
or M1M2M3M4/N1N2N3N4, (1)
and MTIC14 have significant double reductions of simi-lar values (0.15 and 0.16), while the two markers, sepa-rated by 39 cM, flank three intermediate markers. It where lines indicate the individual homologous chro- thus can be seen that it is unreasonable to employ a mosomes on which the two markers are located. This fixed function of the recombination fraction to model configuration generates 16 chromatids during meiosis, the change of double reduction across different loci. involving four nonrecombinants,M1N1,M2N2,M3N3, and In this article, we generalize our multivalent pairing M4N4, each with frequency (1⫺r), and 12 recombinants, model for fully informative markers (S. S. Wu et al. M1N2, · · · , M4N3, each with frequency r. All these 2001) to take into account complexities due to the segre-chromatids are randomly combined to form diploid gation of less informative or dominant marker types. For gametes. Consider the first four modes of gamete forma- partially informative markers, the same zygote genotype tion inLuoet al.(2004, Table 1), for which only marker can be formed due to the combination between
differ-ᏹundergoes the double reduction. The first mode in- ent gametes with double reduction or with no double cludes four gametes, M1M1/N1N1,M2M2/N2N2,M3M3/ reduction. A two-stage hierarchical model is derived to N3N3, andM4M4/N4N4, for which there is no recombi- estimate the probabilities of gamete formation modes nant for each chromatid. If the occurrence of double and therefore double reduction in the upper hierarchy reduction at markerᏺis due completely to the double and estimate the recombination fraction in the lower reduction at marker ᏹ, the frequency of this gamete hierarchy within the maximum-likelihood context im-mode is simply expressed as␣(1⫺r)2. The third mode
plemented with the EM algorithm. We undertake exten-is composed of 12 gametes each with only one recombi- sive simulation studies to investigate statistical proper-nant, i.e., M1M1/N1N2,M1M1/N1N3, · · · , M4M4/N4N3, ties of our model and demonstrate its analytical and and the frequency of this mode is expressed as 2␣r(1⫺ biological advantages over existing models.
r), where the coefficient 2 accounts for the combination The derivation of our model centers on tetraploid between different chromatids. The second and fourth species in which multivalent pairing is only one mecha-modes each include the gametes that contain two re- nism for chromosomal pairings during meioses. This combinants, with a total mode frequency of ␣r2. The
treatment, however, we model these pairings as two with a frequency denoted byfi(i⫽ 1, · · · 9). These 9
observable gamete modes were rearranged by S. S.Wu
cytogenetically related meiotic processes using
Syben-ga’s (1994) theory (Wuet al.2004). et al.(2001) in matrix form expressed as
THE GAMETE MODEL
Fully informative markers: Our model focuses on a tetraploid that undergoes only multivalent pairings. Let
⎡ ⎢ ⎢ ⎢ ⎢ ⎢ ⎢ ⎢ ⎢ ⎢ ⎢ ⎣
a heterozygous multivalent tetraploid line be crossed with a homozygous line to generate a so-called pseudo-test backcross population. For such a population, the genotypes of progeny are consistent with the genotypes of gametes produced by the heterozygous parent and, therefore, the derivation of our linkage analysis can be based on the segregation of gametes. Not only is it useful for the pseudo-test backcross design, but also this gamete-based model provides an analytical clue for a
⎤ ⎥ ⎥ ⎥ ⎥ ⎥ ⎥ ⎥ ⎥ ⎥ ⎥ ⎦
more complicated linkage analysis based on progeny genotypes.
We useM1, · · · ,M4andN1, · · · ,N4to denote different alleles for markersᏹandᏺ, respectively. There are 24 allelic configurations between the two markers, one of which is shown in display (1). For simplicity, we use 1, · · · , 4 to denote alleles,M1, · · · ,M4or N1, · · · ,N4, at a marker. The recombination fraction (r) between these two markers is estimated on the basis of the segre-gation of recombinant and nonrecombinant gametes observed in the offspring of the family under a particular
11 22 33 44 12 13 14 23 24 34
11 1⁄4f
1 1⁄12f2 1⁄12f2 1⁄12f2 1⁄12f5 1⁄12f5 1⁄12f5 1⁄12f6 1⁄12f6 1⁄12f6
22 1⁄12f
2 1⁄4f1 1⁄12f2 1⁄12f2 1⁄12f5 1⁄12f6 1⁄12f6 1⁄12f5 1⁄12f5 1⁄12f6
33 1⁄12f
2 1⁄12f2 1⁄4f1 1⁄12f2 1⁄12f6 1⁄12f5 1⁄12f6 1⁄12f5 1⁄12f6 1⁄12f5
44 1⁄12f
2 1⁄12f2 1⁄12f2 1⁄4f1 1⁄12f6 1⁄12f6 1⁄12f5 1⁄12f6 1⁄12f5 1⁄12f5
h⫽12/21 1⁄12f
3 1⁄12f3 1⁄12f4 1⁄12f4 1⁄6f7 1⁄24f8 1⁄24f8 1⁄24f8 1⁄24f8 1⁄6f9
13/31 1⁄12f
3 1⁄12f4 1⁄12f3 1⁄12f4 1⁄24f8 1⁄6f7 1⁄24f8 1⁄24f8 1⁄6f9 1⁄24f8
14/41 1⁄12f
3 1⁄12f4 1⁄12f4 1⁄12f3 1⁄24f8 1⁄24f8 1⁄6f7 1⁄6f9 1⁄24f8 1⁄24f8
23/32 1⁄12f
4 1⁄12f3 1⁄12f3 1⁄12f4 1⁄24f8 1⁄24f8 1⁄6f9 1⁄6f7 1⁄24f8 1⁄24f8
24/42 1⁄12f
4 1⁄12f3 1⁄12f4 1⁄12f3 1⁄24f8 1⁄6f9 1⁄24f8 1⁄24f8 1⁄6f7 1⁄24f8
34/43 1⁄12f
4 1⁄12f4 1⁄12f3 1⁄12f3 1⁄6f9 1⁄24f8 1⁄24f8 1⁄24f8 1⁄24f8 1⁄6f7 ,
(2)
where f1 and f2 are associated with double reductions at both markers,f3andf4 with double reductions only at markerM,f5 andf6 with double reductions only at markerN, andf7–f9with nondouble reductions. From matrix (2), we see that there are no, one, and two recom-binant events in the cells (f1), (f3,f5), and (f2,f4,f6,f9), respectively. The cells (f7) and (f8) are each a mixture of two different gamete formation mechanisms or con-figurations (A and B),i.e.,f7⫽f7A⫹f7Bandf8⫽ f8A⫹ f8B, with relative proportions determined byr. Because different configurations contain different numbers of recombination events, the expected number of recom-linkage phase. However, as seen below, some gametes bination events in each cell,i.e., an observable gamete genotype, should be the weighted average of the num-can be generated from different unobservable
mecha-ber of recombination events for each configuration. nisms between which there are different numbers of
S. S.Wuet al.(2001) used a matrix form (e) to count recombinant events. S. S.Wuet al.(2001) implemented
the expected number of recombination events for each the EM algorithm to separate these different
mecha-observable gamete genotype expressed as nisms, which makes it possible to estimate the
recombi-nation fraction.
For a phase-known multivalent tetraploid, as shown in display (1), that undergoes double reduction, a total of 10 gametes, arrayed by (11, 22, 33, 44, 12, 13, 14, 23, 24, 34), for each of the two markers will be produced. The first 4 gametes in the gamete array for each marker
⎡ ⎢ ⎢ ⎢ ⎢ ⎢ ⎢ ⎢ ⎢ ⎢ ⎢ ⎣
are those due to double reduction, whereas the re-maining 6 gametes are derived from nondouble reduc-tion. The proportion of the double-reduction-derived gametes to all the gametes is defined as the frequency of double reduction indexed by␣for markerᏹand by
for markerᏺ. The frequency of double reduction is a constant for any given locus, with the value depending on its distance from the centromere.
When two linked markers are segregating in a
multiva-⎤ ⎥ ⎥ ⎥ ⎥ ⎥ ⎥ ⎥ ⎥ ⎥ ⎥ ⎦
lent tetraploid, a total of 136 diploid gamete formation mechanisms are generated although only 100 gamete genotypes are observable. On the basis of the presence/ absence of double reduction and the number of recom-binant events,Fisher(1947) classified these 136 forma-tion mechanisms into 11 gamete modes. Of these 11 gamete modes, however, only 9 can be observed, each
11 22 33 44 12 13 14 23 24 34
11 0 2 2 2 1 1 1 2 2 2
22 2 0 2 2 1 2 2 1 1 2
33 2 2 0 2 2 1 2 1 2 1
44 2 2 2 0 2 2 1 2 1 1
e⫽12/21 1 1 2 2 2φ 1⫹ 1⫹ 1⫹ 1⫹ 2 13/31 1 2 1 2 1⫹ 2φ 1⫹ 1⫹ 2 1⫹
14/41 1 2 2 1 1⫹ 1⫹ 2φ 2 1⫹ 1⫹
23/32 2 1 1 2 1⫹ 1⫹ 2 2φ 1⫹ 1⫹
24/42 2 1 2 1 1⫹ 2 1⫹ 1⫹ 2φ 1⫹
34/43 2 2 1 1 2 1⫹ 1⫹ 1⫹ 1⫹ 2φ ,
(3)
where
φ⫽ r2
10r2⫺ 18r⫹ 9, (4)
⫽ r
3⫺ 2r. (5)
expres-sions for the frequencies of double reduction (␣ and which leads to
) and the recombination fraction r in terms of fi as
follows: pˆk⫽⌫k(1⫺
兺
23j⬆kpj)⌫k⫹ ⌫23
,
␣ ⫽f1⫹f2⫹f3⫹f4; (6)
where
 ⫽f1⫹f2⫹f5⫹f6; (7)
⌫k⫽
pkLk(f|ᏹ,ᏺ)
兺
24k⬘⫽1p⬘kL⬘k(f|ᏹ,ᏺ)
. r⫽1
2[f3⫹f5⫹2(f2⫹f4⫹f6⫹f9)⫹2φf7⫹(1⫹ )f8] . (8)
The MLE of pk can be used to determine an optimal
It can be seen that, to estimate the frequencies of
linkage phase. double reduction and the recombination fraction, we
Partially informative markers:Whereas a fully infor-need to first estimate the nine gamete mode
frequen-mative marker with four distinct alleles 1, 2, 3, 4 pro-cies. For fully informative markers, every cell in matrix
duces 10 observable gametes in a multivalent tetraploid, (2) is distinguishable. Thus, corresponding to the nine
a partially informative markers produces ⬍10 observ-observable gamete mode frequencies arrayed by f ⫽
able gamete genotypes because some of the four alleles (f1, · · · ,f9) shown in matrix (2), there are nine offspring are identical. For example, genotype 1122 produces an observationsn1, · · · ,n9(n⫽兺9
i⫽1ni) in a full-sib family. array of 10 gametes (11, 11, 22, 22, 11, 12, 12, 12, 12,
It is straightforward to derive the explicit expressions and 22) that are collapsed into three observable geno-of the maximum-likelihood estimates (MLEs) for the types 11, 12, and 22. The marker genotype that produces frequencies of these nine formation modes on the basis these three observable gamete genotypes can also be 1222 of the following likelihood function given the observed or 1112. However, because these three marker genotypes marker data (ᏹ andᏺ), 1222, 1122, and 1112 are phenotypically identical
al-though they produce different frequencies of gamete L(f|ᏹ,ᏺ)⫽
冢
nn1· · · n9
冣
兿
9i⫽1 fni
i , (9) genotypes 11, 12, and 22, they will provide different
pieces of information for linkage analysis. R. L. Wuet al.(2001) provided an algorithm to characterize marker from which we have
genotypes on the basis of their segregation patterns in a progeny.
fˆi⫽
ni
n. To clearly describe statistical algorithms for linkage analysis using partially informative markers, we start with By substituting the MLEs of f into Equations 6–8, we
a specific example, from which a more general algo-derive a closed-form solution for the EM algorithm to
rithm can be derived. Suppose we have marker geno-estimate␣,, andr. In the E-step, calculate the expected
types 1122 for markerᏹand 1122 for markerᏺfor a number of recombination events for each cell in matrix
heterozygous multivalent tetraploid. There are three 3 using Equations 4 and 5. In the M-step, use the updated
possible linkage phases between these two markers ex-values from the E-step to estimate the MLEs of the
parame-pressed, in order, as ters based on Equations 6–8. The E- and M-steps are
iter-ated until the estimates converge to stable values. 1
1
兩
1 1兩
2 2
兩
2 2
兩
,1 1
兩
1 2
兩
2 1
兩
2 2
兩
,1 2
兩
1 2
兩
2 1
兩
2
1
兩
. (11) For a given data set, we need to estimate theseparame-ters under all possible parental linkage phases and
choose a most likely phase on the basis of the likelihood Each of these two markers has 3 gamete genotypes values calculated by Equation 9. However, because of (11, 12, and 22), which form 9 joint gamete genotypes the symmetrical effect, some different linkage phases with observations denoted in matrix form as
may have the same likelihood value. In this case, the recombination fractionrshould be used as a criterion;
the linkage phase corresponding to a small estimate of ⎡
⎢ ⎢ ⎢ ⎣
ris a more correct one.
We take a further step to obtain the MLE of the probabil-ity with which a linkage phase occurs in the heterozygous
⎤ ⎥ ⎥ ⎥ ⎦
tetraploid. Letpk(兺24k⫽1pk⫽1) be the probability of the
kth phase for the tetraploid parent. For observed marker data with unknown linkage phase, we formulate the likelihood function on the basis of a polynomial mixture expressed as
11 12 22
11 n11
11 n1211 n2211
12 n11
12 n1212 n2212
22 n11
22 n1222 n2222 ,
with n⫽n1111⫹· · ·⫹ n2222, where the superscripts and subscripts denote the gamete phenotypes at markersᏹ andᏺ, respectively. Under the assumption of the first linkage phase, the 100 two-marker gamete genotypes shown in the h matrix (2) are collapsed to 9 observ-able genotypes with the gamete frequency matrix ex-L⫽
兺
24
k⫽1
pkLk(f|ᏹ,ᏺ), (10)
informative markers should be determined on the basis of the likelihood values calculated under each phase. Meanwhile, the linkage probabilities can be calculated.
⎡ ⎢ ⎢ ⎢ ⎢ ⎣
The algorithm described above for two particular markers can be generalized to any partially informative markers. To do so, we need an automatic procedure for deriving the collapsed gamete probability matrix
⎤ ⎥ ⎥ ⎥ ⎥ ⎦
(hP) as shown in matrix (12) as an example. This can be done by designing a left (dL) and right matrix (dR) that aims to reduce the gamete frequency matrix (2) for fully informative markers. Assume the second linkage phase in display (11), and then we have
hP⫽dLhdTR,
11 11 12 22
hP⫽12
1
6(3f1⫹f2⫹f3⫹f5⫹f7) 1
6(2f3⫹2f4⫹f8) 1
6(2f2⫹f4⫹f6⫹f9)
1
6(2f5⫹2f6⫹f8) 1
6(4f7⫹2f8⫹4f9) 1
6(2f5⫹2f6⫹f8)
22 1
6(2f2⫹f4⫹f6⫹f9) 1
6(2f3⫹2f4⫹f8) 1
6(3f1⫹f2⫹f3⫹f5⫹f7) ,
(12)
where each cell is indexed byFi1…iL,that is, the sum of the corresponding gamete mode frequencies,fi1, · · · ,fiL,
multiplied by the coefficients specified in the matrix. For example,F12357 ⫽3f1 ⫹f2⫹f3⫹f5⫹f7; the same is held for the rest.
We derive a two-stage hierarchic model for the EM
algorithm to estimate the MLEs of the gamete mode fre- where quencies and the recombination fraction. In the E-step at
the upper hierarchy, we calculate the expected propor-tion of one particular gamete modeil (shown by the
dL⫽
⎡ ⎢ ⎢ ⎢ ⎣
1 1 0 0 1 0 0 0 0 0
0 0 0 0 0 1 1 1 1 0
0 0 1 1 0 0 0 0 0 1
⎤ ⎥ ⎥ ⎥ ⎦ , superscript) to all theLpossible gamete modes in each
cell of matrix (12),i.e.,
and Fil
i1···il···iL⫽
fil
Fi1···il···iL
.
These proportions are used to provide the MLEs of the d R ⫽ ⎡ ⎢ ⎢ ⎢ ⎣
1 0 1 0 0 1 0 0 0 0
0 0 0 0 1 0 1 1 0 1
0 1 0 1 0 0 0 0 1 0
⎤ ⎥ ⎥ ⎥ ⎦ . gamete mode frequencyfiin the M-step on the basis of
fˆ1⫽ 1 n[3F
1 12357(n1
1⫹n22)] , For any particular pair of markers, left and right design matrices can be determined on the basis of marker genotypes and linkage phases.
fˆ2⫽ 1 n[F
2
12357(n11⫹ n22)⫹2F22469(n12 ⫹n21)] ,
THE ZYGOTE MODEL
fˆ3⫽ 1 n[F
3 12357(n1
1⫹n22)⫹2F3348(n121 ⫹n122)],
Consider two outbred multivalent tetraploids that are crossed to generate a full-sib family for the construction fˆ4⫽ 1
n[F 4
2469(n12⫹n21)⫹2F4348(n121 ⫹n122)], of a linkage map. For two fully informative markers at
each of which there are eight different alleles between the two parents, the zygote genotype for an offspring fˆ5⫽ 1
n[F 5 12357(n1
1 ⫹n22)⫹ 2F5568(n112⫹n212)] ,
can be uniquely determined by the genotypes of two gametes each derived from a different parent. Because fˆ6⫽ 1
n[2F 6
568(n112⫹n212)⫹F24696 (n12 ⫹n21)], each parent produces (10⫻10) gamete genotypes as shown in matrix (2), we have a total of 10,000 observable zygote genotypes that can be expressed in a (10⫻10)丢 fˆ7⫽ 1
n[F 7 12357(n1
1⫹ n22)⫹4F7789n1212] , (10⫻ 10) matrix, where丢 is the Kronecker product. All these observed zygote genotypes can be sorted into nine distinct gamete modes for each of the two parents, fˆ8⫽ 1
n[F 8
568(n112⫹n22)⫹F8348(n121 ⫹n122)⫹2F8789n1212] ,
from which we can obtain the MLEs of various gamete mode frequencies for one parent (fi) and the second
fˆ9⫽ 1 n[F
9 2469(n1
2⫹n21)⫹4F9789n12] .12 parent (gi). These estimated fˆi and gˆi values are then used to estimate the frequencies of double reductions and the recombination fraction between the two linked With the MLEs of thesefi’s, the frequencies of double
reduction are then estimated using Equations 6 and 7. markers with the EM algorithm described in the
ga-mete model.
At the lower hierarchy, the EM algorithm is
imple-mented to estimate the MLE of the recombination frac- The most challenging aspect for linkage analysis in a full-sib family is the development of statistical models tion on the basis of the updatedfi values using
the gamete and zygote levels. Consider two crossed par- reduction between the two markers is bounded by two times the recombination fraction in tetraploid. We can ents with a combination of parental linkage phases
be-tween two linked markers expressed as also test whether position-dependent double reductions follow a particular pattern (Butruille and Boiteux
2000). 1
1
兩
1 1兩
2 2
兩
2 2
兩
⫻1 1
兩
1 1
兩
2 2
兩
2
2
兩
. (13) It is imperative that our linkage model is examined in terms of its estimation precision and power. The statistical We have provided the collapsed matrix (12) for observedbehavior of a model can be investigated through two gamete mode frequencies for one parent under this
link-approaches, one based on the calculation of informa-age phase. Leth(1)P ⫽(Fi1···iL)3⫻3 andh(2)P ⫽(Gi1···iL)3⫻3 be
tion amount and the other based on simulation studies. such collapsed matrices for the two parents, respectively,
The information matrix of parameter estimates can be with Fi1···iLandGi1···iLdefined in matrix (12). Thus, the estimated by calculating the asymptotic (co)variance frequencies of distinct zygote genotypes between the matrix of the MLEs of the model parameters that in-two parents are the Kronecker product of these in-two clude the frequencies of double reduction and recombi-collapsed matrices,i.e., nation fraction. The standard statistical methods based on the expectation of the second derivatives of the
likeli-HP⫽ h(1)P 丢h(2)P . (14)
hood function can be used to estimate such an asymp-The above distinct zygote genotype frequencies will fur- totic (co)variance matrix. As the frequencies of double ther be collapsed according to three marker types. For reduction are estimated from the gamete mode frequen-the first marker type, an exact correspondence between cies, the sampling variances of the MLEs of these param-marker phenotypes and param-marker genotypes exists. As a eters are also estimated through the gamete mode fre-result of this correspondence, marker genotypes with dif- quencies.
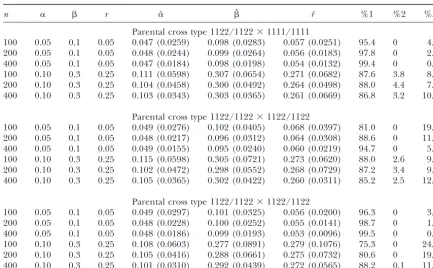
ferent allele dosages,e.g., 1112, 1122, and 1222, are pheno- We performed extensive simulation studies to investi-typically different. According to this genotype model, we gate the statistical behavior of our model for linkage will have five phenotypically observable zygote geno- analysis in multivalent tetraploids. We simulate a full-types 1111, 1112, 1122, 1222, and 2222 for marker cross sib family of different sample sizes (n ⫽100, 200, and type 1122⫻1122. For a two-marker cross type shown in 400) by crossing two multivalent tetraploid parents, in display (13), we will obtain a 5⫻5 matrix for observable a range of double reduction (0.05–0.30) and recombi-zygote genotype frequencies collapsed from the 9⫻ 9 nation fraction (0.05 and 0.25). The means of the MLEs matrix of Equation 14. The second marker type is that of these parameters and their standard errors based on in which marker genotype is not dependent on allele 1000 simulation replicates under the genotype model dosage. Such noncorrespondence makes marker geno- are illustrated in Table 1. Our model provides reason-types 1112, 1122, and 1222 phenotypically identical. able estimates of all the model parameters. The preci-Using 1, 12, and 2 to denote three possible zygote phe- sion of the MLEs, as assessed by the standard errors, notypes for a marker, this so-calledphenotypemodel has increases for all the parameters with increased sample a 3 ⫻ 3 collapsed zygote genotype frequency matrix. sizes and with increased degrees of linkage. Different The last marker type is dominant markers for any of degrees of double reduction can be precisely estimated. which there are only two phenotypes for a marker. Thus, The percentage of correctly determining a parental link-the dominant model has a 2 ⫻ 2 zygote genotype fre- age phase is high, increasing with sample size and the quency matrix collapsed from matrix (14). The detailed degree of linkage.
structures of zygote genotype frequency matrix under As expected, the estimation precision of the model the genotype, phenotype, and dominant models will be parameters is a function of marker type. As compared provided upon request. With these known structures, it to fully informative markers (S. S.Wuet al.2001), the is not difficult to derive the EM algorithm to estimate recombination fraction between partially informative observed gamete mode frequencies for two parents (fi markers is more difficult to estimate for the same sample
andgi). size and linkage degree. Of the three parent cross types
simulated in this study, 1122/1122 ⫻ 1111/1111 is the most informative, providing the best estimates of the
re-RESULTS
combination fraction (Table 1). Parent cross type 1122/ 1122⫻1122/1122 is better in estimating a stronger link-After the model parameters are estimated under a
most likely linkage phase, we need to make statistical age (r ⫽ 0.05) than 1122/1112⫻ 1122/1112, but the inverse seems true in estimating a looser linkage (r ⫽ hypothesis tests for the frequencies of double reduction
(␣ˆ andˆ) and the recombination fraction (rˆ) between 0.25). For parent cross type 1122/1112 ⫻ 1122/1112, double reduction can be better estimated for marker two linked markers. In each case, traditional
log-likeli-hoodratio test statistics can be appropriately formulated 1122 than for 1112.
The same simulation scheme was also used to test our and calculated under two alternative hypotheses. S. S.Wu
TABLE 1
The MLEs of the frequencies of double reduction (␣,) and the recombination fraction (r) and their standard errors (in parentheses) estimated from the genotype model for a simulated
full-sib family with a sample size ofn⫽100, 200, and 400
n ␣  r ␣ˆ ˆ rˆ %1 %2 %3
Parental cross type 1122/1122⫻1111/1111
100 0.05 0.1 0.05 0.047 (0.0259) 0.098 (0.0283) 0.057 (0.0251) 95.4 0 4.6
200 0.05 0.1 0.05 0.048 (0.0244) 0.099 (0.0264) 0.056 (0.0183) 97.8 0 2.2
400 0.05 0.1 0.05 0.047 (0.0184) 0.098 (0.0198) 0.054 (0.0132) 99.4 0 0.6
100 0.10 0.3 0.25 0.111 (0.0598) 0.307 (0.0654) 0.271 (0.0682) 87.6 3.8 8.6
200 0.10 0.3 0.25 0.104 (0.0458) 0.300 (0.0492) 0.264 (0.0498) 88.0 4.4 7.6
400 0.10 0.3 0.25 0.103 (0.0343) 0.303 (0.0365) 0.261 (0.0669) 86.8 3.2 10.0
Parental cross type 1122/1122⫻1122/1122
100 0.05 0.1 0.05 0.049 (0.0276) 0.102 (0.0405) 0.068 (0.0397) 81.0 0 19.0
200 0.05 0.1 0.05 0.048 (0.0217) 0.096 (0.0312) 0.064 (0.0308) 88.6 0 11.0
400 0.05 0.1 0.05 0.049 (0.0155) 0.095 (0.0240) 0.060 (0.0219) 94.7 0 5.3
100 0.10 0.3 0.25 0.115 (0.0598) 0.305 (0.0721) 0.273 (0.0620) 88.0 2.6 9.4
200 0.10 0.3 0.25 0.102 (0.0472) 0.298 (0.0552) 0.268 (0.0729) 87.2 3.4 9.4
400 0.10 0.3 0.25 0.105 (0.0365) 0.302 (0.0422) 0.260 (0.0311) 85.2 2.5 12.3
Parental cross type 1122/1122⫻1122/1122
100 0.05 0.1 0.05 0.049 (0.0297) 0.101 (0.0325) 0.056 (0.0200) 96.3 0 3.7
200 0.05 0.1 0.05 0.048 (0.0228) 0.100 (0.0252) 0.055 (0.0141) 98.7 0 1.3
400 0.05 0.1 0.05 0.048 (0.0186) 0.099 (0.0193) 0.053 (0.0096) 99.5 0 0.5
100 0.10 0.3 0.25 0.108 (0.0603) 0.277 (0.0891) 0.279 (0.1076) 75.3 0 24.7
200 0.10 0.3 0.25 0.105 (0.0416) 0.288 (0.0661) 0.275 (0.0732) 80.6 0 19.4
400 0.10 0.3 0.25 0.101 (0.0310) 0.292 (0.0439) 0.272 (0.0565) 88.2 0.1 11.7
%1, %2, and %3 are the percentages of the simulation replicates that correctly determine, cannot determine, and incorrectly determine the linkage phase for a given parent cross type, respectively, among 1000 simulation replicates.
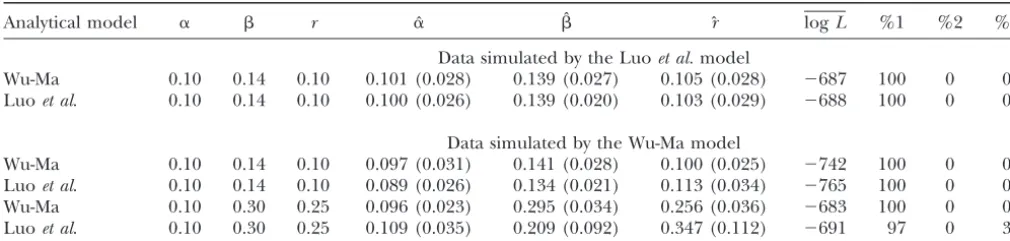
models (results not shown). Compared to the genotype to simulate a second data set based on our model. This data set was analyzed simultaneously by our and Luoet model, these two models have markers that are less
informative. But our model is still able to provide reli- al.’s models, with the results shown in Table 2. Our model provides precise estimates of all the parameters able estimates of all the model parameters for these
for the case on which our model was derived. But the markers, although the estimation precision is reduced
estimates from Luo et al.’s model were biased for the especially for loosely linked markers and smaller sample
three parameters. The estimation ofrfrom their model sizes.
has a larger sampling error than our estimation. For
Comparison withLuoet al.’s (2004) model:Luoet al.
the two markers with a looser linkage (r⫽ 0.25) and proposed a simplified model for characterizing nine
larger double reduction, Luo et al.’s model provided gamete mode frequencies (see their Table 1). To
dem-highly biased and imprecise estimates for the recombi-onstrate the advantage of our model over Luoet al.’s
nation fraction and double reduction (Table 2). For model, we performed an additional simulation study
example, Luoet al.’s model estimatedr⫽ 0.25 as rˆ⫽ based on the simulation scheme by these authors. They
0.347 with a sampling error of 0.112, whereas these two used a parameter,, to specify the relative proportion
estimated values from our model were 0.256 and 0.036. of bivalent and quadrivalent pairings. When is zero,
Our reciprocal-simulation studies suggest that our model all chromosomal pairings are quadrivalent. On the basis
has broader adaptation to different situations than Luoet of ⫽ 0,␣ ⫽ 0.10, and r⫽ 0.10, we used the Luo et
al.’s model. In practice, Luoet al.’s model can be viewed al. model to simulate 200 full-sib progeny from two
as a special case of our model, although a biological justifi-tetraploid parents, 1220/1222 and 2355/1130. Table 2
cation of their model is unclear. describes the means and standard errors of the MLEs
from our model, compared with those from Luoet al.’s model. The consistency of the results between the two
DISCUSSION
models suggests that our model can deal well with the
TABLE 2
Results from a reciprocal analysis
Analytical model ␣  r ␣ˆ ˆ rˆ logL %1 %2 %3
Data simulated by the Luoet al.model
Wu-Ma 0.10 0.14 0.10 0.101 (0.028) 0.139 (0.027) 0.105 (0.028) ⫺687 100 0 0
Luoet al. 0.10 0.14 0.10 0.100 (0.026) 0.139 (0.020) 0.103 (0.029) ⫺688 100 0 0
Data simulated by the Wu-Ma model
Wu-Ma 0.10 0.14 0.10 0.097 (0.031) 0.141 (0.028) 0.100 (0.025) ⫺742 100 0 0
Luoet al. 0.10 0.14 0.10 0.089 (0.026) 0.134 (0.021) 0.113 (0.034) ⫺765 100 0 0
Wu-Ma 0.10 0.30 0.25 0.096 (0.023) 0.295 (0.034) 0.256 (0.036) ⫺683 100 0 0
Luoet al. 0.10 0.30 0.25 0.109 (0.035) 0.209 (0.092) 0.347 (0.112) ⫺691 97 0 3
The data simulated by our (Wu-Ma) and Luoet al.’s models are analyzed by the two models, respectively. The marker cross
type for a full-sib family of sizen⫽200 is the one used by Luoet al., expressed as 1220/1222⫻3455/1130. logLis the mean
of the log-likelihood values obtained from 200 simulations. See Table 1 for explanations of the other parameters.
somal pairings during meiosis. Double reduction may mete segregation patterns. With clear analytical lines, our model is readily expanded to a full-sib family derived play a significant role in plant evolution and the
mainte-nance of genetic polymorphism in natural populations. from two heterozygous parents in the second step. Ex-tensive simulation studies were carried out to investigate Moreover, coupled with the crossing-over events
be-tween different chromosomes, double reduction affects the statistical behaviors of our model. It is robust in that the frequencies of double reduction and the recombina-the patterns of gene cosegregation and recombina-therefore
link-age analysis. S. S.Wuet al.(2001) have, for the first time, tion fraction can be reasonably estimated in a range of sample sizes and parameter values. The model, incorpo-devised a maximum-likelihood approach, implemented
with the EM algorithm, to integrate double reduction rated within a mixture-likelihood function based on a multinomial distribution, has power to estimate the proba-into linkage analysis in tetraploids. Wuet al.’s model made
use of 11 different classifications of two-locus gamete for- bilities of any possible parental linkage phases between two given markers and further determine the most likely mations, derived byFisher(1947), during tetraploid
mei-osis and has proven to be powerful for simultaneous esti- one for the estimation of their linkage.
Although our presentation was based on a particular mation of the frequencies of double reduction and the
recombination fraction between different loci. parent cross type, the model has been extended to several practically important situations. These, implemented in a To clearly present their ideas, S. S.Wuet al.’s (2001)
model was derived on the basis of fully informative mark- more complete computer package, include an unknown dosage of alleles, the existence of null alleles, ambiguous ers in which alleles are all different among homologous
chromosomes between two parents used for a cross. For parent cross type, and the mixture of bivalent and mul-tivalent pairings. This package allows for the test of a polyploid genome project, although fully informative
markers are the important target for extracting the in- various hypotheses regarding the degree of double re-duction and the recombination fraction and has the formation for genetic polymorphisms, some other less
informative markers are also widely used in part because capacity to calculate the sampling errors of the MLEs of the model parameters through the asymptotic (co)-their inclusion can reflect a more comprehensive
pic-ture of the strucpic-ture and organization of the polyploid variance of their MLEs.
We have focused the model derivation on a tetraploid genome and they are economically cheaper to obtain.
In this article, a more general model has been developed that undergoes only multivalent pairing. Because many species belong to such multivalent tetraploids, this model for linkage analysis between any type of partially
infor-mative markers in a multivalent tetraploid. This new will find its immediate application in practice. However, there are also some species that display both bivalent model preserves the advantages of the earlier model by
S. S.Wuet al. (2001), but will be more broadly useful and multivalent pairings. Luo et al. (2004) attempted to model the mixed bivalent and multivalent pairings by in practice.
To better describe our model, we have taken two subse- defining an additional proportion parameter . While statistically reasonable, their approach seems not to be quent steps toward a complete understanding of linkage
analysis in multivalent tetraploids. Our work in the first founded on solid cytological mechanisms for meiosis in a polyploid. They treated bivalent and multivalent step is based on a simpler pseudo-test backcross design
in which one parent is heterozygous whereas the other pairings as two totally different meiotic processes. This may not always be correct if the degree of multivalent is null. Thus, our modeling process of gene
dif-1995 RFLP linkage map and genome analysis of Saccharum
ferent chromosomes in a set, which also determines the
spontaneum. Genome36:782–791.
pattern of bivalent pairings.Sybenga(1994) proposed Fisher, R. A., 1947 The theory of linkage in polysomic inheritance.
Philos. Trans. R. Soc. Ser. B233:55–87.
a series of cytological models to understand the
chromo-Hackett, C. A., J. E. Bradshaw, R. C. Meyer, J. W. McNicol, D.
some relatedness by estimating the so-called preferential
Milbourneet al., 1998 Linkage analysis in tetraploid species:
pairing factor defined as the probability with which a simulation study. Genet. Res.71:143–154.
Haynes, K. G., andD. S. Douches, 1993 Estimation of the
coeffi-more identical chromosomes pair coeffi-more frequently than
cient of double reduction in the cultivated tetraploid potato.
less identical chromosomes. To better perform linkage Theor. Appl. Genet.85:857–862.
analysis in polyploids that undergo the mixture of biva- Julier, B., S. Flajoulot, P. Barre, G. Cardinet, S. Santoniet al.,
2003 Construction of two genetic linkage maps in cultivated
lent and multivalent pairings, Sybenga’s preferential
tetraploid alfalfa (Medicago sativa) using microsatellite and AFLP
pairing factor that specifies meiotic mechanisms for markers. BMC Plant Biol.3(1): 9.
such polyploids should be incorporated into our map- Lander, E. S., andP. Green, 1987 Construction of multilocus
ge-netic linkage maps in humans. Proc. Natl. Acad. Sci. USA84:
ping model (seeWuet al.2004).
2363–2367.
Our model based on pairwise analysis has provided Lu, Q., Y. H. CuiandR. L. Wu, 2004 A multilocus likelihood
ap-proach to joint modeling of linkage, parental diplotype and gene
a first step toward multipoint analysis and map
construc-order in a full-sib family. BMC Genet.5:20.
tion in multivalent tetraploids. Subsequent work is
Luo, Z. W, C. A. Hackett, J. E. Bradshaw, J. W. McNicolandD.
needed to develop an efficient algorithm for grouping Milbourne, 2001 Construction of a genetic linkage map in
tetraploid species using molecular markers. Genetics157:1369–
different markers and ordering those that are assigned
1385.
within the same group. Some useful algorithms include Luo, Z. W., R. M. ZhangandM. J. Kearsey, 2004 Theoretical basis the hidden Markov chain model advocated byLander for genetic linkage analysis in autotetraploid species. Proc. Natl.
Acad. Sci. USA101:7040–7045.
andGreen(1987) for diploid populations and the
evo-Ma, C.-X., G. Casella, T. C. OsbornandR. L. Wu, 2002 A unified
lutionary strategy algorithm proposed byMesteret al. framework for mapping quantitative trait loci in bivalent
tetra-ploids using single-dose restriction fragments: a case study from
(2003). A better approach for ordering markers may be
alfalfa. Genome Res.12:1974–1981.
based on three-point analysis. In diploids, three-point
Mester, D., Y. Ronin, D. Minkov, E. NevoandA. Korol, 2003
Con-analysis has been detected to be more powerful and structing large-scale genetic maps using an evolutionary strategy
algorithm. Genetics165:2269–2282.
precise than two-point analysis (Wuet al.2002b; Luet
Meyer, R. C., D. Milbourne, C. A. Hackett, J. E. Bradshaw, J. W.
al. 2004). It is thus worthwhile to implement three- McNicholet al., 1998 Linkage analysis in tetraploid potato and point analysis into an algorithm for map construction in association of markers with quantitative resistance to late blight
(Phytophthora infestans). Mol. Gen. Genet.259:150–160.
polyploids. With a powerful marker-ordering algorithm
Ming, R., S. C. Liu, Y. R. Lin, J. da Silva, W. Wilsonet al., 1998
available for polyploids at different levels of ploidy, we Detailed alignment of Saccharum and Sorghum chromosomes:
comparative organization of closely related diploid and polyploid
will be in a better position to understand the genetic
genomes. Genetics150:1663–1682.
differentiation among polyploid genomes and
charac-Ming, R., S.-C. Liu, J. E. IrvineandA. H. Paterson, 2001
Compara-terize the genetic architecture of quantitatively inher- tive QTL analysis in a complex autopolyploid: candidate genes
for determinants of sugar content in sugarcane. Genome Res.
ited traits for this unique group of species.
11:2075–2084.
We thank two anonymous referees for their constructive comments Ripol, M. I., G. A. Churchill, J. A. G. da SilvaandM. Sorrells,
on this article. This work is partially supported by an Outstanding 1999 Statistical aspects of genetic mapping in autopolyploids.
Gene235:31–41.
Young Investigators Award (no. 30128017) of the National Natural
Soltis, P. S., andD. E. Soltis, 2000 The role of genetic and genomic Science Foundation of China and the University of Florida Research
attributes in the success of polyploids. Proc. Natl. Acad. Sci. USA Opportunity Fund (no. 02050259) to R.W. The publication of this
97:7051–7057.
article is approved as journal series no. R-10578 by the Florida Agricul- Sybenga, J., 1994 Preferential pairing estimates from multivalent
tural Experimental Station. frequencies in tetraploids. Genome37:1045–1055.
Wu, R. L., M. Gallo-Meagher, R. C. LittellandZ-B. Zeng, 2001 A general polyploid model for analyzing gene segregation in
outcrossing tetraploid species. Genetics159:869–882.
Wu, R. L., C.-X. MaandG. Casella, 2002a A bivalent polyploid
LITERATURE CITED model for linkage analysis in outcrossing tetraploid species.
Theor. Popul. Biol.62:129–151.
Bever, J. D., andF. Felber, 1992 The theoretical population
genet-Wu, R. L., C.-X. Ma, I. PainterandZ-B. Zeng, 2002b Simultaneous
ics of autopolyploidy. Oxf. Surv. Evol. Biol.8:185–217. maximum likelihood estimation of linkage and linkage phases
Butruille, D. V., andL. S. Boiteux, 2000 Selection-mutation bal- in outcrossing species. Theor. Popul. Biol.61:349–363.
ance in polysomic tetraploids: impact of double reduction and Wu, R. L., C. X. MaandG. Casella, 2004 A mixed polyploid model
gametophytic selection on the frequency and subchromosomal for linkage analysis in tetraploids. J. Comput. Biol.11:562–580.
localization of deleterious mutations. Proc. Natl. Acad. Sci. USA Wu, S. S., R. L. Wu, C. X. Ma, Z-B. Zeng, M. Yang et al., 2001
97:6608–6613. A multivalent pairing model of linkage analysis in autotetraploids.
Darlington, C. D., 1929 Chromosome behaviour and structural Genetics159:1339–1350.
hybridity in the Tradescantiae. J. Genet.21:207–286.