ISSN(Online): 2319-8753 ISSN (Print): 2347-6710
I
nternational
J
ournal of
I
nnovative
R
esearch in
S
cience,
E
ngineering and
T
echnology
(An ISO 3297: 2007 Certified Organization) Website: www.ijirset.com
Vol. 6, Issue 3, March 2017
Optimization of Surface roughness in Turning
Operation of Mild Steel using Taguchi Method
Sharath Ushar1, Sonatte Babu2, Arun Sebastian3, Dr. A. Pal Pandi4
U.G Student, Department of Mechanical Engineering, Bharath Niketan Engineering College, Tamil Nadu, India1
U.G Student, Department of Mechanical Engineering, Bharath Niketan Engineering College, Tamil Nadu, India2
U.G Student, Department of Mechanical Engineering, Bharath Niketan Engineering College, Tamil Nadu, India3
Associate Professor, Department of Mechanical Engineering, Bharath Niketan Engineering College, Tamil Nadu, India4
ABSTRACT: In order to produce any product with desired quality by machining, cutting parameters should be selected properly. In turning process parameters such as feed rates, cutting speeds, depth of cut, and other factors will impact the machining qualities like surface roughness. The optimum parameters are analyzed to obtain the best surface roughness.This study was based on optimizing the turning process under different machining parameters by Taguchi method to improve the surface roughness (quality) of the product due to this decreases the machining time, increases the production rate and decreasing the product manufacturing cost. Taguchi optimization methodology is applied to optimize cutting parameters in turning of mild steel with carbide tool under dry cutting condition. The Centre Lathe machine was used for experiments based on the Taguchi design of experiments (DOE) with orthogonal L9 array. The Taguchi method is a important statistical tool, adopted experimentally to analyse the surface roughness by cutting parameters such as cutting speed, feed and depth of cut. The orthogonal array, signal to noise ratio (S/N) and Taguchi method were employed to find minimum surface roughness. From the Experimental result of Taguchi method it is found that Depth of cut is most significant, spindle speed is significant and feed rate is leastsignificant factor effecting surface roughness.
1. INTRODUCTION
ISSN(Online): 2319-8753 ISSN (Print): 2347-6710
I
nternational
J
ournal of
I
nnovative
R
esearch in
S
cience,
E
ngineering and
T
echnology
(An ISO 3297: 2007 Certified Organization) Website: www.ijirset.com
Vol. 6, Issue 3, March 2017
it is difficult in practice, to keep all factors under control as required to obtain the reproducible results . Optimization of machining.parameters increases the utility for machining economics and also increases the product quality to greater extent .
In this research Taguchi DOE (Design of Experiments) approach is used to analyze the effect of turning process parameters that is spindle Speed, Feed and Depth of Cut on Surface Roughness. While machining of mild steel using Carbide cutting tool and to obtain an optimal setting of these parameters that may result in optimizing Surface Roughness.
II.TAGUCHI METHOD
Taguchi method was developed by Genichi Taguchi. It is a best and powerful statistical method used in various sector like manufacturing sector Maintenance Sector, Research and Development sector etc. Taguchi method is based on mean and variance of the values with two or more noise factors. Steps of Taguchi method for optimization are as follows.
1. Identification and evaluation of quality characteristics and process parameters.
2. Identification of number of levels for the process parameters and possible interactions between the process parameters.
3. Assignment of process parameters to the selected appropriate orthogonal array. 4. Conduction of experiments based on the arrangement of the orthogonal array. 5. Calculation of S/N ratio.
6. Analyze the experimental results using the S/N ratio and ANOVA. 7. Selection of the optimal levels of process parameters.
8. Verification of the optimal process parameters through the confirmation experiment.
Run a confirmatory Experiment. It also helps to predict the difference between predicted value and actual observed value.
Orthogonal Array
Arranging experiments under multiple factors are known as the Factorial DOE. This method helps the researchers in determination of the possible combinations of factors and the identification of the best combination and their levels. However in industrial location it is very costly process to run large all combinations. The Taguchi approach describe the plans in carrying out experiments and also standardized the design of the experiment along with minimum number of factor combinations that would be required for testing the influence of factors
III.EXPERIMENTAL SETUP AND CUTTING CONDITION
ISSN(Online): 2319-8753 ISSN (Print): 2347-6710
I
nternational
J
ournal of
I
nnovative
R
esearch in
S
cience,
E
ngineering and
T
echnology
(An ISO 3297: 2007 Certified Organization) Website: www.ijirset.com
Vol. 6, Issue 3, March 2017
Figure1. Lathe Machine setup
Work piece
In this experiment mild steel in form of circular rod is used as experimental work piece. Circular rod has a length of 110 mm with 55 mm diameter. The chemical composition and physical properties are given in table
Fig: 2. Work piece after machining
TABLE 1
CHEM ICAL COM POSITION OF M ILD STEEL WORK PIECE
Element Composition (%)
Carbon 0.16-0.18%
Silicon 0.40%
Manganese 0.70-0.90%
Sulphur 0.40%
Phosphorus 0.40%
ISSN(Online): 2319-8753 ISSN (Print): 2347-6710
I
nternational
J
ournal of
I
nnovative
R
esearch in
S
cience,
E
ngineering and
T
echnology
(An ISO 3297: 2007 Certified Organization) Website: www.ijirset.com
Vol. 6, Issue 3, March 2017
TABLE 2 : PHYSICAL PROPERTIES OF MILD STEEL WORK PIECE Physical Properties Value
Melting point 1427°C
Density 7480-8000 kg/m3
Tensile strength 440 MPa
Yield strength 370 MPa
Elastic modulus 205 GPa
Hardness (HRB) 71
Electric resistivity 1590 nΩ.m
B.Cutting Tool
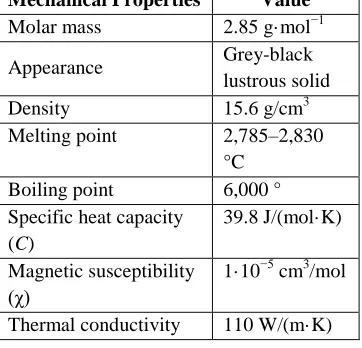
Single point carbide tool was used for machining. Photographic view of tool is given below and physical properties of carbide tool are given in table.3
Figure2. cutting tool
TABLE 3 : PHYSICAL PROPERTIES OF CARBIDE TOOL Mechanical Properties Value
Molar mass 2.85 g·mol−1
Appearance Grey-black
lustrous solid
Density 15.6 g/cm3
Melting point 2,785–2,830
°C
Boiling point 6,000 °
Specific heat capacity (C)
39.8 J/(mol·K)
Magnetic susceptibility (χ)
1·10−5 cm3/mol
ISSN(Online): 2319-8753 ISSN (Print): 2347-6710
I
nternational
J
ournal of
I
nnovative
R
esearch in
S
cience,
E
ngineering and
T
echnology
(An ISO 3297: 2007 Certified Organization) Website: www.ijirset.com
Vol. 6, Issue 3, March 2017
Experimental investigation
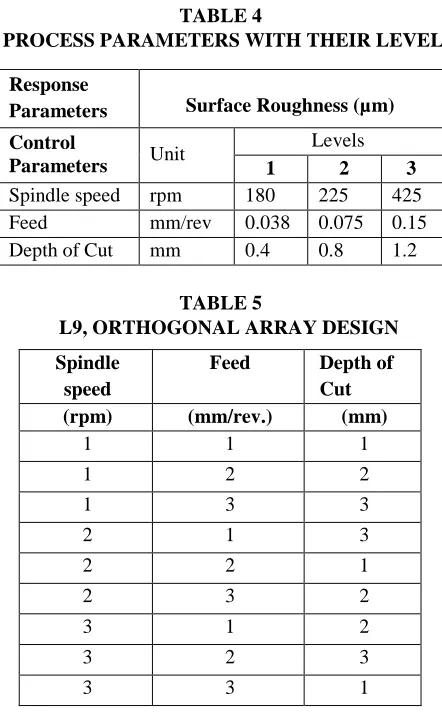
There are three control parameters with different level and one response parameters which are depend on control parameters. L9 orthogonal Array is design with the help of Design of Export 9.
TABLE 4
PROCESS PARAMETERS WITH THEIR LEVELS
TABLE 5
L9, ORTHOGONAL ARRAY DESIGN
Spindle speed
Feed Depth of Cut
(rpm) (mm/rev.) (mm)
1 1 1
1 2 2
1 3 3
2 1 3
2 2 1
2 3 2
3 1 2
3 2 3
3 3 1
IV.RESULT AND ANALYSIS OF EXPERIMENT
Analysis of S/N Ratio:
General methods of design are so complex and they cannot be easily used because the analysis of these design have a large number of experiments and calculation is so lengthy. To solve this important task, the Taguchi method uses a special design of orthogonal array to study the entire parameter space with only a small number of experiments. The experimental results are then transformed into a signal-to-noise (S/N) ratio. The S/N ratio can be used to measure the
Response
Parameters Surface Roughness (µm)
Control
Parameters Unit
Levels
1 2 3
Spindle speed rpm 180 225 425
Feed mm/rev 0.038 0.075 0.15
ISSN(Online): 2319-8753 ISSN (Print): 2347-6710
I
nternational
J
ournal of
I
nnovative
R
esearch in
S
cience,
E
ngineering and
T
echnology
(An ISO 3297: 2007 Certified Organization) Website: www.ijirset.com
Vol. 6, Issue 3, March 2017
deviation of the performance characteristics from the desired values. The categories of performance characteristics in the analysis of the S/N ratio depend upon output parameters to be controlled.
In the Taguchi method, the term ‗signal‘ represents the desirable value (mean) for the output characteristic and the term ‗noise‘ represents the undesirable value (S.D.) for the output characteristics. Therefore, the S/N ratio is the ratio of the mean to the S.D. Taguchi uses the S/N ratio to measure the quality characteristic deviating from the desired value.
The S/N ratio η is defined as η = -10 log (M.S.D.)
Where M.S.D = mean-square deviation for the output characteristic.
As mentioned earlier, there are three categories of performance characteristics, i.e., the smaller-thebetter, the larger-the better, and the nominal is best. To obtain optimal output performance, the nominal is best must be taken for size variation and the smaller-the-better must be taken for cycle time. The S/N ratio for these quality characteristic can be expressed as: In order to perform S/N ratio analysis, mean square deviation (MSD) for quality characteristics and S/N ratio were calculated from the following equations,
Characteristic smaller the better
MSD =
ISSN(Online): 2319-8753 ISSN (Print): 2347-6710
I
nternational
J
ournal of
I
nnovative
R
esearch in
S
cience,
E
ngineering and
T
echnology
(An ISO 3297: 2007 Certified Organization) Website: www.ijirset.com
Vol. 6, Issue 3, March 2017
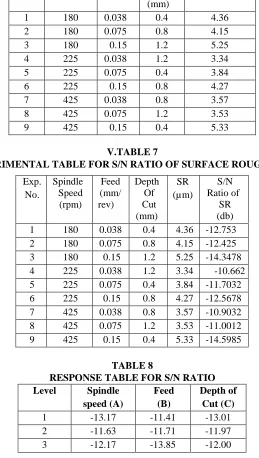
TABLE 6
EXPERIMENTAL TABLE FOR SURFACE ROUGHNESS
V.TABLE 7
EXPERIMENTAL TABLE FOR S/N RATIO OF SURFACE ROUGHNESS
Exp. No. Spindle Speed (rpm) Feed (mm/ rev) Depth Of Cut (mm) SR (µm) S/N Ratio of SR (db)
1 180 0.038 0.4 4.36 -12.753
2 180 0.075 0.8 4.15 -12.425
3 180 0.15 1.2 5.25 -14.3478
4 225 0.038 1.2 3.34 -10.662
5 225 0.075 0.4 3.84 -11.7032
6 225 0.15 0.8 4.27 -12.5678
7 425 0.038 0.8 3.57 -10.9032
8 425 0.075 1.2 3.53 -11.0012
9 425 0.15 0.4 5.33 -14.5985
TABLE 8
RESPONSE TABLE FOR S/N RATIO Level Spindle
speed (A)
Feed (B)
Depth of Cut (C)
1 -13.17 -11.41 -13.01
2 -11.63 -11.71 -11.97
3 -12.17 -13.85 -12.00
Exp. No. Spindle Speed (rpm) Feed (mm/ rev) Depth Of Cut (mm) Surface Roughness (µm)
1 180 0.038 0.4 4.36
2 180 0.075 0.8 4.15
3 180 0.15 1.2 5.25
4 225 0.038 1.2 3.34
5 225 0.075 0.4 3.84
6 225 0.15 0.8 4.27
7 425 0.038 0.8 3.57
8 425 0.075 1.2 3.53
ISSN(Online): 2319-8753 ISSN (Print): 2347-6710
I
nternational
J
ournal of
I
nnovative
R
esearch in
S
cience,
E
ngineering and
T
echnology
(An ISO 3297: 2007 Certified Organization) Website: www.ijirset.com
Vol. 6, Issue 3, March 2017
Delta 1.55 2.44 1.04
Rank 2 1 3
From the above table optimal parameters for turning operation were A2B1C3
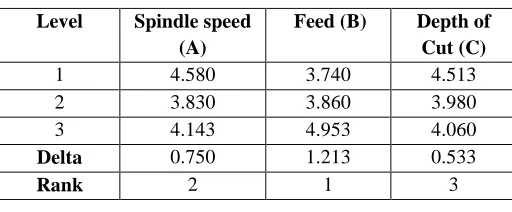
TABLE 9
RESPONSE TABLE FOR MEANS
VI.CONCLUSIONS
In this research mild steel was the work material and cutting tool was carbide. Turning process was used for remove the material from a circular bar. The study discusses about the application of Taguchi method to investigate the effect of process parameters on surface roughness. From the analysis of the results obtained following conclusion can be drawn: -
Statistically designed experiments based on Taguchi method are performed using L9 orthogonal array to analyze surface roughness. The results obtained from analysis of S/N Ratio were in close agreement.
Optimal parameters for surface roughness the optimal parameters found were spindle speed 225 rpm; feed 0.075mm/rev and depth of cut 0.8 mm.
ACKNOWLEDGMENT
The Author would like to express their deep gratitude to the management of BharathNiketan Engineering College, for providing the necessary help and moral support. Author is also thankful of research advisor for his support and suggestions during experiential work.
REFERENCES
1. Arshad Noor Siddiquee et al.(2014), ―Optimization of Deep Drilling Process Parameters of AISI 321 Steel using Taguchi Method‖ 2211-8128 © 2014 Elsevier Ltd. doi: 10.1016/j.mspro.2014.07.195 .
2. A.Mital, M.Mehta, ―surface roughness Prediction models for fine turning‖, International journal of production research 26 (1988) 1861-1876. 3. C.A.VanLuhervelt,T.H.CChilds,I.SJawahir,F.Klocke.P.K.Venuvinod.present situation & future trends modeling of machining operations .progress
report of the CIRP Working group ―Modelling of machining operations‖ Analyses of the CIRP, 47/2(1998)587-626. 4. E.J.A Armarego and R.H Brown, The machining of metals prentice Hall, 1969.
5. R.C Brewer and R. Rueda , ―A Simplified Approch to the optimum selection of machining parameters ", Engines Digest vol.24,NO.9,PP 133-150.
Level Spindle speed (A)
Feed (B) Depth of Cut (C)
1 4.580 3.740 4.513
2 3.830 3.860 3.980
3 4.143 4.953 4.060
Delta 0.750 1.213 0.533
ISSN(Online): 2319-8753 ISSN (Print): 2347-6710
I
nternational
J
ournal of
I
nnovative
R
esearch in
S
cience,
E
ngineering and
T
echnology
(An ISO 3297: 2007 Certified Organization) Website: www.ijirset.com