ISSN(Online): 2319-8753
ISSN (Print): 2347-6710
International Journal of Innovative Research in Science,
Engineering and Technology
(A High Impact Factor, Monthly, Peer Reviewed Journal) Visit: www.ijirset.com
Vol. 6, Issue 10, October 2017
Method of Analysis and Design of RC High
Rise building
Dr. B. Ramesh Babu1,Kuruba Srikanth2, G. Raghu Yadav3
Principal, ALITS College, Affiliated to JNTUA, AP, India1
M.Tech Student, Dept. of CIVIL Engineering, ALITS College, Affiliated to JNTUA, AP, India. 2
Dept. of CIVIL Engineering, ALITS College, Affiliated to JNTUA, AP, India3
ABSTRACT: Generally engineers, man of science and call manufacturers have determined the behavior of structures victimisation linear static elastic finite component analysis together with summations of vertical column masses. whereas building height will increase in construction section, the structural responses, i.e. axial masses, bending moments and displacements, of such typical analysis could more and more diverge from actual behavior. Time-dependent, long-term, deformations in response to construction sequence will cause distribution of responses that may not be computed and thought of by standard ways. This analysis was complicated in nature then several parameters ought to be taken under consideration throughout analysis. however currently advancement of finite component modeling and simulation has created nonlinear analysis simple, well managed and common among engineers, researchers and call manufacturers that accelerate correct style of structures particularly high-rise.A high rise building is defined as a building 35 meters or greater in height, which is divided at regular intervals. High rise buildings are generally preferred because it saves the cost of land in the restricted places and where the place is limited. Due to the increased demand of high rises and decreased availability of space, high rises are now mushrooming especially in cities. Generally, in the major cities, the cost of the land will be very high.
I. INTRODUCTION
Structural design can be defined as a mixture of Art and Science, combining the Engineer’s feeling for the behavior of structure with the sound data of the principle of data point, dynamics, mechanics of materials, and structural analysis, to supply safe economical structure which will serve its supposed purpose. Any structure is made up of structural elements (load carrying, such as slabs, beams and columns) and non-structural elements (such as partitions, ceilings,
doors). The structural elements put together, constitute the ‘structural system’. Its perform is to resist effectively the
action of gravitative and environmental masses, and to transmit the ensuing forces to the supporting ground, while not considerably worrisome the pure mathematics, integrity and usableness of the structure. A sturdy structure is one, which might safely carry the forces and might serve the due perform satisfactorily throughout its expected service lifetime.
An engineering structure is an assembly of members or elements transferring the load (or resisting external actions) and providing a form, space, an enclosure and/or a cover to serve the desired function.
ISSN(Online): 2319-8753
ISSN (Print): 2347-6710
International Journal of Innovative Research in Science,
Engineering and Technology
(A High Impact Factor, Monthly, Peer Reviewed Journal) Visit: www.ijirset.com
Vol. 6, Issue 10, October 2017
Safety
Durability
Economy
Aesthetic value
Feasibility, practicability and acceptability
II. DESIGN ASSINING
Beams
The DXF file after it was imported is used now, the beams are assigned their designated sections as per plan
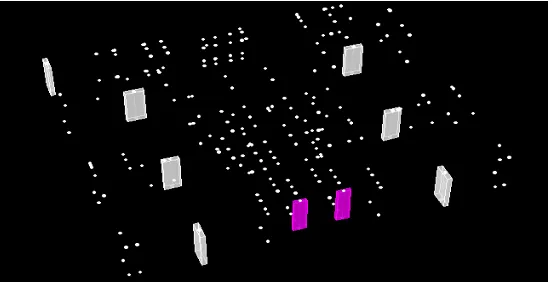
Fig 1: Beam Sections Assigned
Columns:
Columns are placed just by one click at the position to the required positions. Columns which have the ratio of the longer side to shorter side greater than four can be assigned as walls.
ISSN(Online): 2319-8753
ISSN (Print): 2347-6710
International Journal of Innovative Research in Science,
Engineering and Technology
(A High Impact Factor, Monthly, Peer Reviewed Journal) Visit: www.ijirset.com
Vol. 6, Issue 10, October 2017
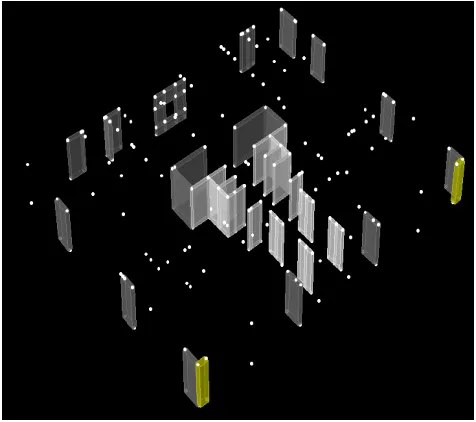
Walls:
Columns which have the ratio of the longer side to shorter side greater than four can be assigned as walls.
Fig 3: Wall Sections Assigned (3D View)
Slabs:
Slabs are created by create slabs command. It should be made sure that the slab is placed by clicking on all the nodes at its periphery for load distribution to take place at the required joints.
ISSN(Online): 2319-8753
ISSN (Print): 2347-6710
International Journal of Innovative Research in Science,
Engineering and Technology
(A High Impact Factor, Monthly, Peer Reviewed Journal) Visit: www.ijirset.com
Vol. 6, Issue 10, October 2017
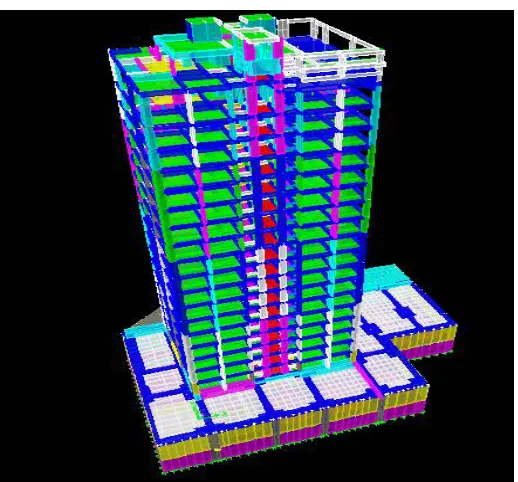
Fig 5: ETABS 3D model
Comparison between sequential analysis and linear static analysis results for aGirder beam. (Dead and dead sequential case).
Table 1: Comparison of sequential analysis results and linear static analysis
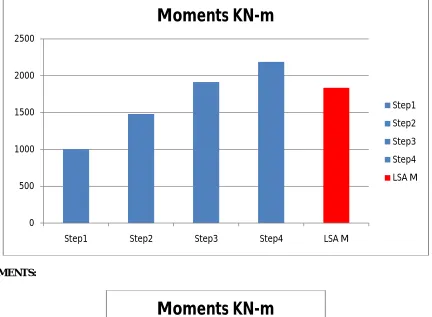
MOMENTS:
Material Construction sequential analysis Linear static analysis Step1 Step2 S t ep 3 Step4
Moment KN-M RCC 1003.20 1481.82 1912.655 2189.01 1837.23
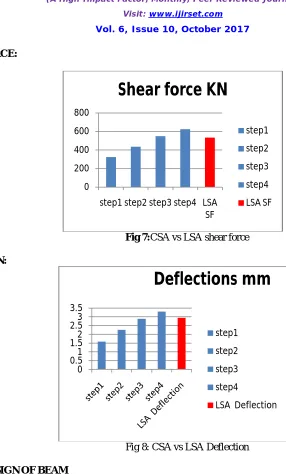
Shear KN RCC 323.20 436.13 549.28 624.38 533.01
ISSN(Online): 2319-8753
ISSN (Print): 2347-6710
International Journal of Innovative Research in Science,
Engineering and Technology
(A High Impact Factor, Monthly, Peer Reviewed Journal) Visit: www.ijirset.com
Vol. 6, Issue 10, October 2017
MOMENTS:
Fig 6: CSA vs LSA moments
0 500 1000 1500 2000 2500
Step1 Step2 Step3 Step4 LSA M
Moments KN-m
Step1
Step2
Step3
Step4
LSA M
0 1000 2000 3000
Step1Step2Step3Step4 LSA M
Moments KN-m
Step1
Step2
Step3
Step4
ISSN(Online): 2319-8753
ISSN (Print): 2347-6710
International Journal of Innovative Research in Science,
Engineering and Technology
(A High Impact Factor, Monthly, Peer Reviewed Journal) Visit: www.ijirset.com
Vol. 6, Issue 10, October 2017
SHEAR FORCE:
Fig 7:CSA vs LSA shear force
DEFLECTION:
Fig 8: CSA vs LSA Deflection
TYPICAL DESIGN OF BEAM
Beams size 200 x 650mm
Assume FCK =25 N/mm2
Fy= 500 N/mm2
Fig 34: Beam results from ETABS
0 200 400 600 800
step1 step2 step3 step4 LSA SF
Shear force KN
step1
step2
step3
step4
LSA SF
0 0.51 1.52 2.53 3.5
Deflections mm
step1
step2
step3
step4
ISSN(Online): 2319-8753
ISSN (Print): 2347-6710
International Journal of Innovative Research in Science,
Engineering and Technology
(A High Impact Factor, Monthly, Peer Reviewed Journal) Visit: www.ijirset.com
Vol. 6, Issue 10, October 2017
Bending moment shear force From ETABS, analysis
Mu=135.779 KN-m
T u = 10.91 KN-m
Vu = 162.91 KN
d = 850mm
Mt = (Tu/1.7) {1 + (D/b)}
M t =(10.91/1.7){1+(800/200)} = 35.29KNm
Me1 = Mu + Mt
Mel = 135.779+ 35.29= 171.077KNm
D required = √ ((171.077X10⁶)/(0.1336x25x200))
=506.066 ‹ d provided
Therefore, hence design as singly reinforced beam.
Me1/bd2 = (171.077*106) / (200*850*850) = 1.18
From Table 3 of SP-16, corresponding to Mu/bd2 = 1.18, we have
pt =0.2878. So,
Ast= 0.2878(200)(850)/100 = 491.07 mm2.
Provide 3-10mm in tension and 2-10mm in compression
Ve= Vu + 1.6(Tu/b)
= 162.90+ 1.6(10.91/0.20) =249.28kN The equivalent shear stress,
τve = (Ve/ bd) = (249.28x10³) /(200 x 850) =1.466N/mm2
From (Table 20 of IS 456), τc max= 3.1 N/mm2. Hence, the section does not need any revision. τve<τc max
From Table 19, for value of
pt = 1.18, fck= 25
τc = 0.37 N/mm2
τc<τve
SHEAR REINFORCEMENT REQUIRED
Assuming 2L stirrups of 10mm dia Vus= (τve -τc)*b*d
= (1.466-0.37)*200*850 =186.32 KN
SV=(0.87*fy*Asv*d)/ Vus
=(0.87x415x2x50.2x850)/(249.27x103)
=123 mm (Minimum=120mm)
PROVIDE 8mm DIA 2L @120mm C/C
DESIGN OF SLAB: 1. DATA
Lx = 4.05 m (Ly/Lx) = (4.60 / 4.05) = 1.13< 2
Ly = 4.60 m
Fck = 25 N/mm2
FY = 500 N/mm2
ISSN(Online): 2319-8753
ISSN (Print): 2347-6710
International Journal of Innovative Research in Science,
Engineering and Technology
(A High Impact Factor, Monthly, Peer Reviewed Journal) Visit: www.ijirset.com
Vol. 6, Issue 10, October 2017
2. DEPTH OF SLAB
Assume overall depth D = 150 mm Along shorter direction, d = 121 mm Along longer direction, d = 113 mm Clear Cover = 25 mm
Dia of Bar = 8 mm
3. LOADS
Self weight of the slab = (0.15 x 25) = 3.75kN/m2
Floor finish = 1.33kN/m2
Live load = 2kN/m2
Total service load = w = 7.75 kN/m2
Ultimate load = wu = (1.5 x 8.75) = 11.63 kN/m2
4. CALCULATION OF BENDING MOMENT COEFFICIENTS:
From IS: 456-2000, table 26, pg 91, bending moment coefficients at different span edges. Two Adjacent edges discontinuous
C o e f f i c i e n t C o n t i n u o u s e d g e ( - V E ) M i d s p a n ( + V E )
x 0 . 0 5 6 0 . 0 4 2
y 0 . 0 4 7 0 . 0 3 5
MX = x w lx 2
MY = y w lx 2
5.CALCULATION OF BENDING MOMENTS: Short Span Moments
At Continuous Edge:
Mx = 0.056X11.63X 4.052 = - 10.68KN-m
At Mid Span:
Mx= 0.042 x 11.63x4.052= + 8.011 KN-m
Long Span Moments
At Continuous Edge:
Mx= 0.047 x 11.63X 4.052= -8.96KN-m
At Mid Span:
Mx= 0.035 x 11.63X 4.052= + 6.68 KN-m
Check for effective depth required:
Mu = 10.68 KN-m
dreq =
dreq= 55.63 mm < Provided 150 mm (Safe)
Calculation of Reinforcements:
Mux - ve = - 10.68KN-m
Mux + ve = + 8.011 KN-m
Muy - ve = -8.96KN-m
Muy + ve = + 6.68 KN-m
b
f
Mu
ck
ISSN(Online): 2319-8753
ISSN (Print): 2347-6710
International Journal of Innovative Research in Science,
Engineering and Technology
(A High Impact Factor, Monthly, Peer Reviewed Journal) Visit: www.ijirset.com
Vol. 6, Issue 10, October 2017
At Continuous Edge of short span
0.73
From SP 16, Pt = 0.178%
ASt = 215.38 mm2
Assuming #8 mm Bars
c/c spacing = (50.26 x 1000 / 215.38) = 233.35 mm
Spacing should exceed:
3d = 3 x 125 = 375 mm
300 mm
Provide #8 @ 220 mm c/c At mid span of Short span
= 0.55
From SP 16, Pt = 0.13 %
Ast = 157 mm2
Min. % of Main reinforcement required= 0.12 % Ast min. = 0.12 x 1000 x 150 / 100 = 180 mm2
Assuming #8 mm Bars Provide #8 @ 275 mm c/c
At Continuous Edge of long span
= 0.7
From SP 16, Pt=0.167 %
Ast= 202.07 mm2
Provide #8 @ 225mm c/c At mid span of long span
= 0.52
From SP 16, Pt = 0.11 %,
Ast= 133 mm2
Min. % of Main reinforcement required= 0.12 % Ast min. = 0.12 x 1000 x 150 / 100 = 180 mm2
Ast = 180 mm2
Provide #8 @ 275 mm c/c Check for shear:
Mux= wul2/8
10.8 = wu*(4.052) / 8
wu = 5.26 KN
Therefore, Vux = wul / 2
= 5.26*4.05 / 2 = 10.65KN
2
bd
M
u2
bd
M
u2
bd
M
u2
ISSN(Online): 2319-8753
ISSN (Print): 2347-6710
International Journal of Innovative Research in Science,
Engineering and Technology
(A High Impact Factor, Monthly, Peer Reviewed Journal) Visit: www.ijirset.com
Vol. 6, Issue 10, October 2017
From IS: 456 – 2000, table 19
Pt= 215.38*100 / (1000*121)
= 0.178%
τc = 0.78 N/mm2
Here τu<τc * ok
Hence safe in shear.
6. CHECK FOR DEFLECTION:
Pt=0.12%
For Pt=0.12, Modification factor Kt =1.769 (L/D) max=26xKt=20x1.769=45mm (Lx/D) provided=4050/150=27mm
(Lx/D) provided<(L/D) max, Safe in deflection.
Typical Design of Stair case:
Staircase room= 2.6x 4.75m Floor height=3.05m
Live load =3 KN/m2
Treads = 300 mm Rise =145.2mm
Height of each flight=3.05 /2=1.525m No of rises in each flight = 1500/145.2=11 No of treads in each flight =11-1 =10 Width of landing = 1.2m
Effective span = Going + landing + bearing/2 = (0.3 x 10) + (1.2) + (0.15/2) = 4.3 m Assuming the waist slab thickness = 150mm
To meet durability of concrete in moderate condition and 2 hrs fire resistance [from table 16 and 16 A of IS 456-2000 pg 47] nominal cover required 30mm.
Taking clear cover = 30 mm
Assuming bar diameter for main reinforcement as 10mm Effective depth d= 150 - 30 – 10/2= 115 mm
Loads on-going:
Self weight of slab = 0.150x 25 = 3.75 KN/m2
Equivalent of this load in plan (on Horizontal plane)
= load on slope x
=3.75 x √(3002+145.22)/300= 4.166KN/m2
Self weight of steps = average rise x density= (0.145.2/2)x25=1.815 KN/m2
Live load = 3 KN/m2
Floor finish (50mm thick) = 0.05 x 25 = 1 KN/m2
Total load on stair = 4.166+1.815+1+3=9.99 KN/m2
Factored load w1=1.5*10=15=20
Calculations for landing:
Provide landing slab thickness = waist slab thickness Dead load of landing=0.15*25=3.75KN
provided
steel
of
c/s
of
Area
required
steel
c/s
of
Area
Fy x
x
0.58
Fs
242215
180
x
500
x
0.58
ISSN(Online): 2319-8753
ISSN (Print): 2347-6710
International Journal of Innovative Research in Science,
Engineering and Technology
(A High Impact Factor, Monthly, Peer Reviewed Journal) Visit: www.ijirset.com
Vol. 6, Issue 10, October 2017
Floor finishes =1 KN Live load=3KN
Ultimate load w2=11.625
Ra=w1a(2l-a)+w2c2/2L=41.2KN
Rb=w2c(2l-c)+w1a2/2L=33.76KN
M max at X=R1/W1 when R1<w1a =R12/2w
X=2.1
M max = R12/2w1=42.43 KN-m
Check for effective depth:
For balanced section, MU = MU,lim= 0.133 fckbd2
From SP-16, Pt=0.478 %
ASt = 717 mm2
Main steel; provide 12 # @ 115 mm c/c Distribution steel: 0.15% of gross area Provide 8 # @ 200mm c/c.
Check for shear:
Vu= reaction= 41.2KN
τu =Vu/bd=41200/(1000*125)
=0.3296
Min % of steel 100Ast/bd=0.478
τc =0.49
Here τu<τc * ok
d= =
√( .
. ) =112.9mm 150mm
Hence it is safe. Reinforcement:
=1.88
b
f
Mu
ck
ISSN(Online): 2319-8753
ISSN (Print): 2347-6710
International Journal of Innovative Research in Science,
Engineering and Technology
(A High Impact Factor, Monthly, Peer Reviewed Journal) Visit: www.ijirset.com
Vol. 6, Issue 10, October 2017
III. CONCLUSION
The study presented an experimental and analytical study on The study reveals the necessity of performing nonlinear static analysis becomes important with increasing slenderness while the each additional floor creates a significant load upon the columns. With increasing slenderness the necessity to perform sequential analysis considering P-Delta effects, material characteristics and nonlinear of behavior of the structures become a significant issue. Construction sequence analysis in structures of both Steel and RCC is necessary to improve the analysis accuracy in terms of displacement, axial, moment and shear force in supporting beam and column near of it and also for the whole the structure overall. Moments and shear in supporting beam are higher in sequential analysis which must be considered during manual or computer aided design in the design phase for avoiding cracking of beam and column due to sequence effects.
REFERENCES
1) P.C.VARGHESE “LIMIT STATE DESIGN OF REINFORCED CONCRETE” second edition, prentice-Hall of India private limited, New Delhi.
2) “Reinforced Concrete Design” by UnnikrishnaPillai and DevdasMenon, Tata McGraw-Hill Publishing Company Limited, New Delhi 3) “Advanced Reinforced Concrete Design(IS:456-2000)” by N Krishnaraju, CBS Publishers&Distributers,New Delhi.