©
DOI: 10.1534/genetics.104.030080
Tree Scanning: A Method for Using Haplotype Trees in
Phenotype/Genotype Association Studies
Alan R. Templeton,*
,1Taylor Maxwell,* David Posada,
†,2Jari H. Stenga˚rd,
‡Eric Boerwinkle
§and Charles F. Sing**
*Department of Biology, Washington University, St. Louis, Missouri 63130-4899,†Variagenics, Cambridge, Massachusetts 02139, ‡Department of Epidemiology and Health Promotion, KTL-National Public Health Institute, Helsinki, Finland, FIN-00300,
§Human Genetics Center, University of Texas Health Science Center, Houston, Texas 77225-0334 and **Department of Human Genetics, University of Michigan School of Medicine, Ann Arbor, Michigan 48109
Manuscript received April 14, 2004 Accepted for publication September 20, 2004
ABSTRACT
We use evolutionary trees of haplotypes to study phenotypic associations by exhaustively examining all possible biallelic partitions of the tree, a technique we call tree scanning. If the first scan detects significant associations, additional rounds of tree scanning are used to partition the tree into three or more allelic classes. Two worked examples are presented. The first is a reanalysis of associations between haplotypes at theAlcohol Dehydrogenaselocus inDrosophila melanogasterthat was previously analyzed using a nested clade analysis, a more complicated technique for using haplotype trees to detect phenotypic associations. Tree scanning and the nested clade analysis yield the same inferences when permutation testing is used with both approaches. The second example is an analysis of associations between variation in various lipid traits and genetic variation at theApolipoprotein E(APOE) gene in three human populations. Tree scanning suc-cessfully identified phenotypic associations expected from previous analyses. Tree scanning for the most part detected more associations and provided a better biological interpretative framework than single SNP analyses. We also show how prior information can be incorporated into the tree scan by starting with the traditional three electrophoretic alleles at APOE. Tree scanning detected genetically determined phenotypic heterogeneity within all three electrophoretic allelic classes. Overall, tree scanning is a simple, powerful, and flexible method for using haplotype trees to detect phenotype/genotype associations at candidate loci.
M
ANY studies attempt to associate trait variation An evolutionary tree of the haplotypes at a candidate locus or DNA region can be estimated when there is with genetic variation at a candidate gene byemploying separate tests at each polymorphic nucleo- little to no recombination in the DNA region. Given that there is increasing evidence for areas of low recom-tide site within the gene, even when the sites display
bination separated by recombination hotspots ( Tem-extensive linkage disequilibrium. Increasingly, there is
pletonet al.2000;Jeffreyset al.2001;Reichet al.2002), an appreciation that using haplotypes can often
aug-haplotype variation in many genomic regions can be ment power for detecting phenotypic associations and
organized into haplotype trees. Just as SNPs can be can eliminate the difficulties of statistical dependence
placed into the context of a haplotype to increase the among polymorphic sites showing linkage
disequilib-level of biological information, so can haplotypes be rium (Drysdaleet al.2000;Martinet al.2000;Seltman
placed into their evolutionary context to further
aug-et al. 2001; Balciuniene et al. 2002; Knoblauch et al.
ment the amount of biological information.Templeton 2002;Van Eerdewegh et al. 2002; Zaykin et al. 2002).
et al. (1987) were the first to propose using haplotypes The tendency for haplotype analyses to show increased
and their evolutionary trees in phenotype/genotype as-power over single-nucleotide polymorphism (SNP)
analy-sociation studies through nested clade analysis (NCA) ses is not surprising if SNPs do not always affect phenotypes
in which the branches of the haplotype tree are used in isolation but rather affect the phenotype through the
to define a nested hierarchy of clades (“branches”) of joint genetic effects of two or more SNPs.
haplotypes. The fundamental premise of NCA is that any mutation having functional significance will be im-1Corresponding author:Department of Biology, Campus Box 1137,
bedded in the historical framework defined by the
hap-Washington University, St. Louis, MO 63130-4899.
lotype tree and therefore whole branches (clades) of
E-mail: [email protected]
this tree will show similar functional attributes. Nesting 2Present address:Departamento de Bioquı´mica, Gene´tica e
Inmuno-logı´a, Facultad de BioInmuno-logı´a, Universidad de Vigo, Vigo 36310, Spain. has several advantages. First, nesting categories are
termined exclusively by the evolutionary history of the all branches of the haplotype tree detects an allelic partition of the tree whose resulting genotypes explain haplotypes without any consideration of phenotypic
data, thereby eliminating a source of potential bias in a significant amount of phenotypic variance, additional rounds of tree scanning within the two significant allelic phenotype/genotype association studies. Second, the
clades define a nested design that makes full and effi- classes defined by the initial round are used to partition the tree into three or more allelic classes. In analogy with cient use of the available degrees of freedom and
per-forms only evolutionarily relevant contrasts. Third, sta- a genome scan that uses marker loci to localize phenotypic associations to physical sections of a chromosome, the tistical power is enhanced by pooling haplotypes into
clades, thereby directly addressing the problem of too tree scan uses the mutations that arose in evolutionary history to localize phenotypic associations to temporal much haplotype diversity eroding statistical power by
creating sparse data sets. sections of the haplotype tree. Just as adjacent markers
in a genome scan yield highly correlated phenotypic Despite these advantages, NCA has a serious
limita-tion: the nested design is for haplotypes, not genotypes. associations, so do adjacent branches in a tree scan. Therefore, one expects to see a peak of association that This is not a problem when the phenotype is biologically
expressed in a haploid or effectively haploid individual falls off with increasing distance in the haplotype tree, just as genome scans produce peaks of phenotypic asso-at the candidasso-ate gene, such as associasso-ations between an
X-linked candidate gene with a male phenotype, or with ciation that fall off with increasing physical distance on the chromosome from the responsible variation. homozygous strains, as in the Drosophila example first
analyzed by Templeton et al.(1987). However, when Unlike NCA, tree scanning is straightforward to
im-plement for diploid data and can directly address domi-dealing with diploid genotypes in natural populations, a
single individual will likely bear two distinct haplotypes. nance because it uses the haplotype tree to define a series of standard single-gene phenotype/genotype as-The haploid nature of the nested design is not a
prob-lem for some types of studies with diploid data. For ex- sociation tests. Two worked examples are given. The first is thealcohol dehydrogenase(Adh) data from Drosophila ample, many case control studies test for differences in
relative allele frequency between cases and controls. (Aquadro et al. 1986) that were previously analyzed with NCA (Templetonet al.1987). This example allows Given that allele frequency is a haploid genetic measure,
it is straightforward to extend NCA to case-control stud- a direct comparison of NCA with tree scanning. For a second example, we analyze variation at the human ies (Templeton1995). NCA can also be used in designs
based upon the transmission disequilibrium test that autosomal Apoprotein E (APOE) gene for associations with various blood measures of lipid metabolism. uses the gamete types transmitted from parent to
off-spring for estimating genotype/phenotype associations (Seltmanet al.2001).
MATERIALS AND METHODS Other than these special designs, NCA requires a
sta-tistical mapping of diploid phenotypes upon haploid
Population samples:Aquadroet al.(1986) bred 41
homozy-haplotypes when the data include heterozygous diploid gous strains of the fruit fly Drosophila melanogasterthat were genotypes (Templeton et al. 1988). Such a mapping coisogenic except for a small region around the Adhgene. They surveyed the 41 homozygous strains for restriction site can be executed with the traditional quantitative genetic
variation at the Adh gene and measured them for alcohol measurement of average excess (Templetonet al.1988)
dehydrogenase enzyme activity.
or average effect (Hallmanet al. 1994). Unfortunately, For theAPOE study, three human populations were sam-such a diploid NCA is cumbersome and difficult to im- pled: 702 unrelated African-Americans (483 females and 219 plement in many cases. Moreover, average excesses or males) from Jackson, Mississippi ( J); 337 unrelated individuals (188 females and 149 males) from North Karelia, Finland (N); effects are measures of the marginal phenotypic effects
and 854 unrelated non-Hispanic European-Americans (456 (the “additive genetic” component of phenotypic
vari-females and 398 males) from Rochester, Minnesota (R). Be-ance in quantitative genetics) of a haplotype or clade
cause we excluded haplotypes found fewer than five times of haplotypes, and the phenotypic variance attributable in the combined sample (see below), some individuals were
to dominance effects is ignored. excluded for a total in this study of 470 females and 214 males
from the Jackson population, 187 females and 146 males from To circumvent these problems, we propose a new
the North Karelia population, and 449 females and 392 males method called tree scanning. Tree scanning partitions
from the Rochester population. Individuals were genotyped the haplotype tree into two or more mutually exclusive
for theAPOESNPs that were found to be segregating in their and exhaustive clades and then treats each clade as an respective population in the resequencing study of a 5.5-kb “allele” in a genotypic analysis of phenotypic associa- section of theAPOEgene (Fullertonet al.2000): 16 SNPs for J, 14 for N, and 13 for R, for a total of 21 distinct SNPs. tions. A tree scan starts by exhaustively examining all
All individuals were measured for fasting (12 hr for J and R, possible biallelic partitions of the haplotype tree created
4 hr for N) blood levels of total cholesterol (TC), high-density by cutting a branch in the haplotype tree and then
lipoprotein cholesterol (HDL-C), triglycerides (TG), and apol-grouping together all the haplotypes on one side of the ipoprotein E (ApoE).
1992) was estimated from the 39ApoE haplotypes with the
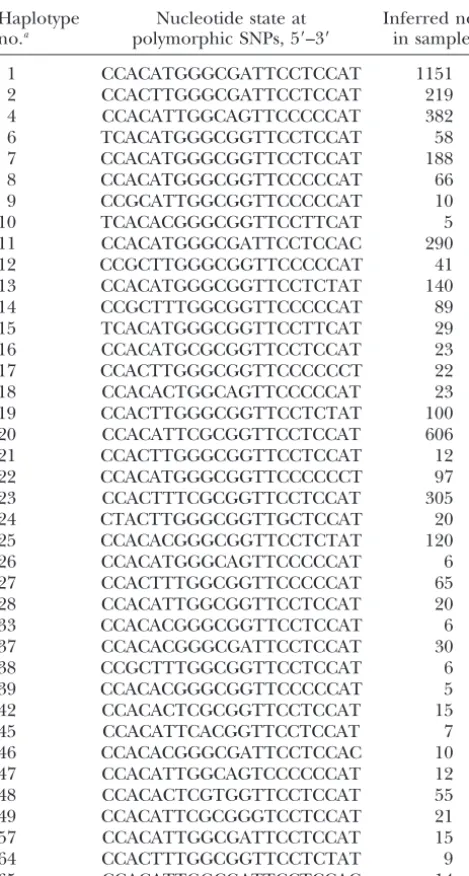
TABLE 1
program TCS (Clementet al.2000; available at http://darwin.
InferredAPOEhaplotypes used in this study uvigo.es). TCS does not always give a single best tree, but
instead retains all branches that have 95% confidence under Haplotype Nucleotide state at Inferred no. a neutral, finite-sites model of DNA evolution, which often no.a polymorphic SNPs, 5⬘–3⬘ in sample results in phylogenetic ambiguity in the haplotype network due to multiple mutational hits at the same site. The estimated 1 CCACATGGGCGATTCCTCCAT 1151 tree forAPOEhad several loops reflecting multiple hits and/or 2 CCACTTGGGCGATTCCTCCAT 219 haplotype inference errors. When possible, loops were re-4 CCACATTGGCAGTTCCCCCAT 382 solved using the coalescent criteria given byCrandalland
6 TCACATGGGCGGTTCCTCCAT 58 Templeton(1993).
7 CCACATGGGCGGTTCCTCCAT 188 Implementation of the tree scan:Tree scanning is imple-8 CCACATGGGCGGTTCCCCCAT 66 mented with the program TREESCAN, downloadable from 9 CCGCATTGGCGGTTCCCCCAT 10 http://darwin.uvigo.es. In the first round of tree scanning, a 10 TCACACGGGCGGTTCCTTCAT 5 branch is cut in the haplotype tree. All of the haplotypes on 11 CCACATGGGCGATTCCTCCAC 290 one side of the cut are grouped together and treated as a single allele, sayA. All the haplotypes on the other side of the
12 CCGCTTGGGCGGTTCCCCCAT 41
cut are grouped together and treated as a single allele, sayB.
13 CCACATGGGCGGTTCCTCTAT 140
These two alleles define three potential genotypes: AA, AB,
14 CCGCTTTGGCGGTTCCCCCAT 89
andBB. Associations between phenotypes and these genotypes
15 TCACATGGGCGGTTCCTTCAT 29
are measured by the F-statistic from a standard one-way
AN-16 CCACATGCGCGGTTCCTCCAT 23
OVA. (This analysis assumes continuous phenotypes, the only
17 CCACTTGGGCGGTTCCCCCCT 22
case considered in this article. For discrete phenotypes,
pheno-18 CCACACTGGCAGTTCCCCCAT 23
type/genotype associations would be evaluated using a
differ-19 CCACTTGGGCGGTTCCTCTAT 100
ent statistic, such as a contingency chi square.)
20 CCACATTCGCGGTTCCTCCAT 606
The human samples were stratified by population and
gen-21 CCACTTGGGCGGTTCCTCCAT 12
der, for a total of six separate analyses of each of the four
22 CCACATGGGCGGTTCCCCCCT 97
lipid traits. In all three human samples, the distributions of
23 CCACTTTCGCGGTTCCTCCAT 305
TG and ApoE were significantly positively skewed in both
24 CTACTTGGGCGGTTGCTCCAT 20
genders. The natural log (ln) transformation of these variables 25 CCACACGGGCGGTTCCTCTAT 120 (ln TG and ln ApoE) reduced skewness to nonsignificant 26 CCACATGGGCAGTTCCCCCAT 6 values (P⬎0.05) in all cases. Therefore the human traits used 27 CCACTTTGGCGGTTCCCCCAT 65 in this study are TC, HDL, ln TG, and ln ApoE. All traits 28 CCACATTGGCGGTTCCTCCAT 20 within each population and gender were adjusted for age by 33 CCACACGGGCGGTTCCTCCAT 6 using the residuals after a linear regression on age.
37 CCACACGGGCGATTCCTCCAT 30 Because some of the genotypes defined by this procedure 38 CCGCTTTGGCGGTTCCTCCAT 6 may be empty or have few observations, the statistical signifi-39 CCACACGGGCGGTTCCCCCAT 5 cance of the resulting F-test statistic is evaluated under the 42 CCACACTCGCGGTTCCTCCAT 15 null hypothesis of no phenotype/genotype association by ran-45 CCACATTCACGGTTCCTCCAT 7 domly permuting the phenotypic observations across the ge-46 CCACACGGGCGATTCCTCCAC 10 notypic categories to generate the null distribution. In the 47 CCACATTGGCAGTCCCCCCAT 12 current analyses, 5000 random permutations were used to
generate these null distributions.
48 CCACACTCGTGGTTCCTCCAT 55
TheBoerwinkleandSing(1986) bias-corrected estimator
49 CCACATTCGCGGGTCCTCCAT 21
of genetic variance, s2
G, is used to obtain an estimate of the
57 CCACATTGGCGATTCCTCCAT 15
contribution of the genetic model to explaining phenotypic
64 CCACTTTGGCGGTTCCTCTAT 9
variance that is adjusted for the number of genotypic classes
65 CCACATTGGCGATTCCTCCAC 14
considered in the model aThe haplotype number refers to the number in the original
set of 78 inferred haplotypes. Only 39 haplotypes are in this s2 G⫽
兺
k
i⫽1
ni(Yi⫺Y)2
n ⫺
k⫺1
n
兺
k
i⫽1
兺
nij⫽1
(Yij⫺Yi)2
n⫺k , (1) table.
wherenis the total sample size,kis the number of genotypic classes with observations,Y is the sample grand mean, niis haplotypes were inferred from the SNP genotypic data using
the number of individuals in theith genotypic class, andYijis the program PHASE, version 1 (Stephenset al. 2001), that
the phenotype of thejth individual with genotypei. Equation 1 estimates haplotypes using a Bayesian procedure with a prior
can be divided by the total phenotypic variance to obtainpvk, based on neutral, coalescent theory. PHASE was applied
sepa-an estimate of the proportion of the total phenotypic varisepa-ance rately to each of the three samples. A total of 78 haplotypes
in the population sampled explained by thekgenotypes. were inferred for the combined three samples. Recent studies
The above steps are repeated for each branch of the haplo-(Adkins2004) indicate that haplotype inference is accurate
type tree. Because some partitions result in one of the alleles for haplotypes with a frequency ofⱖ1%. Given that our
hu-being extremely rare, we implement tree scanning with the man samples averaged ⵑ600 individuals, we therefore
dis-option of skipping the test when the rarer allele hasc observa-carded any haplotypes that were inferred to occur five or fewer
tions or less. This cuts down on computational time by avoid-times in the combined sample, leaving a total of 39 haplotypes
ing those cases thata priorihave little chance of yielding a in the combined sample (Table 1).
statistically significant result and augments statistical power
Estimation of haplotype trees: We use theAdhhaplotype
by reducing the total number of tests when correcting the tree thatAquadroet al.(1986) estimated through maximum
setc⫽5. For theAdhdata set we performed all tests regardless Further rounds are possible, but we found no additional phenotypic signals after two rounds in either of the two data of sample sizes. This was done so that the tree-scanning results
would be comparable to those of the original NCA uponAdh sets analyzed. Another extension is to cut certain branches on the basis of prior information and then cut an additional (Templetonet al.1987) in which no contrasts were excluded.
After performing the above analyses upon each branch in the branch to search for significant phenotypic associations in addition to that associated with the branches cut on the basis tree (or the subset not culled ifc⬎1), the significance levels
of the permutation tests are adjusted for multiple testing of prior information. For example, two polymorphic coding sites (at positions 3937 and 4075) that jointly determine the through the step-down, stepwise, resampling method of
West-fallandYoung(1993) with enforced monotonicity that in- three common protein electrophoretic allelesε2, ε3, andε4 at theAPOElocus have been associated with many phenotypic corporates correlation structure. Details are in the TREESCAN
documentation available at http://darwin.uvigo.es. effects related to blood lipids and coronary artery disease in previous studies (SingandDavignon1985;Boerwinkleet al. The highly correlated nature of the haplotype categories
defined by cutting adjacent branches can sometimes result in 1991;Kaprioet al.1991;Stengardet al.1995, 1996). Accord-ingly, an analysis was implemented forAPOEusing the pro-multiple significant test results being clustered in the
haplo-type tree. We identify all sets of branches such that each branch gram MacAnova 4.13 (BinghamandOehlert2003) in which the two branches associated with these two positions are cuta in the set has a significantpvk(P-valuesⱕ0.05) and is adjacent
in the tree to one or more other branches in the same set. prioriand a third branch is then cut to search for heterogeneity within the traditional electrophoretic allele classes.
For each set we identify the branch associated with the highest,
statistically significant value ofpvkand call it the peak branch Single SNP analysis:To compare the results of tree scanning to the more typical analysis in which each SNP is tested one-for its set. The peak branch one-for each set is regarded as cut in
the second round of the tree scan, which therefore begins by-one for phenotypic associations, a statistical analysis for phenotypic heterogeneity was performed upon the genotypes with the haplotypes already clustered into two or more alleles.
The second round of tree scanning subdivides one of the defined by each SNP (all were biallelic) using the sameF- sta-tistics, permutational testing procedure, correction for the alleles from the first-round scan into two alleles. For example,
if the first round of tree scanning cut a single branch to create number of genotypic categories (Equation 1), and method for correcting for multiple tests that were used in the tree scan. two allelic categories, sayAandB, then the second round of
tree scanning subdivides either theAallele into two alleles, sayA⬘andA″, or theBallele intoB⬘andB″, thereby converting
the first-round two-allele system into a three-allele system. RESULTS Once again, the association between phenotypes and
geno-types is measured by an F-statistic from a one-way ANOVA. Adhin Drosophila:Figure 1 shows theAdhhaplotype However, the testing procedure is now altered to reflect the tree and the nested design used by Templeton et al. conditional nature of the inference. For example, suppose
(1987). The NCA of the activity of the enzyme alcohol the first round subdivided the tree into two alleles,AandB,
dehydrogenase (Adh) identified four branches with sta-and a second-round cut is made within theAallele to form
tistically significant associations (P⬍0.05) using a stan-three alleles,A⬘,A″, andB. The test results should focus
exclu-sively upon the variation associated with theA⬘andA″alleles dard, parametric nested analysis of variance (
Tem-(the new alleles created by the second round of tree scanning) pletonet al.1987), as indicated by asterisks in Figure 1. because theBallele is regarded as given. These three alleles Table 2 gives the initial results of the tree-scan tests define six possible genotypes:A⬘A⬘,A⬘A″,A″A″,A⬘B, A″B, and
for association between the phenotype of Adh activity
BB. TheBBgenotype bears none of the second-round alleles,
and theAdhhaplotype tree based upon 5000 permuta-and it has already been inferred to have significant phenotypic
differences from some or all of those genotypes withAcategory tions. Figure 2 shows these same results graphically. The alleles. Hence, individuals who areBBare completely excluded partition that splits the tree between haplotypes1and from the second-round permutation procedure. The remain- 15explains 81% of the variance of Adh activity and is ing five genotypes are subdivided into two categories, those
the only peak. The1–15branch is therefore cut to form that have onlyAclass alleles (A⬘A⬘,A⬘A″, andA″A″), and those
two allelic classes, A (haplotypes 1–14) and B (haplo-that have oneAclass allele and oneBallele (A⬘BandA″B).
types15–25). The results of the second round are given To fix the effect of theBallele so that it can make no
contribu-tion to the significance of theF- statistic, phenotypes are per- in Table 3 and shown in Figure 3. Eighty-four percent mutated only within the two genotypic categories of having of the phenotypic variance was explained by the0-8split twoAclass alleles or of having oneAclass allele and oneB
withinAwhen coupled with the first-round1-15split. allele. By excludingBBand restricting the permutations within
The two branches with significant phenotypic associa-genotypic classes with the same number ofBalleles (either 0
tions in the tree scan are identical to two branches with or 1), the significance of our second-roundF-statistics depends
exclusively upon the phenotypic differences associated with the strongest statistical signal in the original NCA. The theA⬘andA″alleles. Similar considerations hold in the sec- tree-scan analysis is therefore consistent with the nested ond-round cut in theBclass to createB⬘andB″alleles or when clade analysis, but appears to have detected fewer associ-there are multiple first-round allelic categories.
ations. However, this appearance may be misleading. After the statistical significance of the second-round cuts
The NCA and tree-scan analyses of the Adh haplotype has been determined, the correction for multiple comparisons
is applied separately to the branches cut within the Aallele tree differ in three regards: (1) using the haplotype tree and to branches cut within theBallele. This reflects the condi- to define a nested design vs. using the haplotype tree tional nature of the second round of the tree scan in which to define bi- and triallelic genotype contrasts, (2) evalu-we consider the two distinct biological hypotheses of
heteroge-ating the significance through a parametric nested anal-neity withinAand of heterogeneity withinB. Accordingly all
ysis of variance (NANOVA)vs.nonparametric permuta-corrections for multiple testing are stratified withinAandB.
TABLE 2
Initial tree scan of theAdhhaplotype tree for
the phenotype of Adh activity
Corrected Branch F- statistic pvk Probability probability
1–15 176.09 0.81 0.0000 0.0000
1–2 124.57 0.75 0.0000 0.0000
2–3 66.68 0.62 0.0000 0.0000
15–22 16.14 0.27 0.0002 0.0010
22–24 6.84 0.12 0.0106 0.0994
15–20 6.54 0.12 0.0050 0.1026
3–13 5.28 0.09 0.0244 0.1796
13–14 4.74 0.08 0.0290 0.2120
20–21 4.68 0.08 0.0086 0.2900
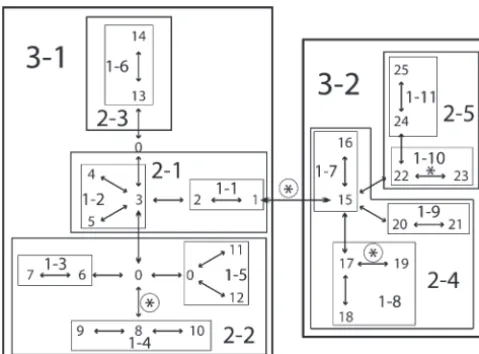
Branches are indicated by the two haplotypes they intercon-Figure1.—The nested clade analysis of theAdhhaplotype nect. The probability of theF-statistic under the null hypothe-tree with the phenotype of Alcohol dehydrogenase activity in sis of no phenotypic differences across genotypes is evaluated Drosophila melanogaster. Haplotypes are indicated by the num- through random permutation testing, and these probabilities bers 1–25. Each double-headed arrow corresponds to a single are then corrected for multiple comparisons. Only branches mutational change in this unrooted tree. A 0 indicates an that are significant at the P ⱕ 0.05 level, with or without intermediate haplotype state not found in the current sample correction, are reported.
but inferred through maximum parsimony. Haplotypes are nested together into one-step clades, indicated by 1-. One-step clades are then nested into two-One-step clades, indicated by
uncorrected P-value of 0.048 for this branch in the 2-, which in turn are nested into the three step clades, 3-1
and 3-2. A nested analysis of variance without correction for nested clade analysis with permutational testing (
Tem-multiple testing detected statistically significant phenotypic pletonet al.1988, Table 1). Hence, when comparable transitions on four branches, as indicated by asterisks (Tem- statistical tests and criteria are used, the nested clade pletonet al. 1987). A nonparametric permutation test
de-analysis and the tree-scan de-analysis of theAdh data set tected three significant phenotypic transitions, as indicated
yield identical inferences at similarP-levels. by the circled asterisks, but without correction for multiple
testing (Templetonet al.1988). APOEtree-scan analysis:Much phylogenetic ambigu-ity is present in the statistical parsimony tree of the APOE haplotypes, as shown in Figure 4. This ambiguity can be resolved to yield 48 distinct trees, each with 38 multiple testsvs.such an adjustment. To focus just on
branches. We applied tree scanning to all possible reso-the impact of how reso-the haplotype tree was used
(differ-lutions of this tree as a check on the robustness of our ence 1), we need to make the nested clade and tree-scan
inferences to phylogenetic ambiguity. With 48 alterna-analyses comparable for the latter two points. Difference
2 (NANOVAvs.permutation testing) has already been tive trees each with 38 branches, there are a total of 48⫻38⫽1824 branches. Because the alternative trees addressed for theAdhtree (Templetonet al.1988).
Fig-ure 1 shows that only three significant effects are de- affect only a few allele groupings, the phylogenetic am-biguity shown in Figure 4 adds only 22 additional tected in the NCA using permutational testing,
includ-ing the two detected by tree scanninclud-ing. These results are branches to our analysis of APOE, for a total of 60 branches. Moreover, because not all haplotypes are pres-consistent with the well-known fact that nonparametric
tests are generally of lower power than appropriate para- ent in every population sample and many haplotypes or groups of haplotypes have fewer than five observa-metric tests. The advantage of the nonparaobserva-metric test
is greater robustness to deviations from the parametric tions in a given stratum, the tree scan of any particular sample always involved⬍60 branches.
distributional assumptions, including applicability to
statistics whose distributional properties are poorly Table 4 presents those branches that had statistically significant phenotypic associations (Pⱕ0.05, after ad-known. Moreover, the nonparametric test is applicable
to effectively haploid samples as well as outbred diploid justing for multiple testing) in each of the six samples defined by geographic location and gender. Many of samples, whereas the parametric NANOVA can be
ap-plied only to effectively haploid samples. the significant branches for a particular phenotype in
a given population are adjacent on the haplotype tree, To adjust for the fact that the NCA with permutational
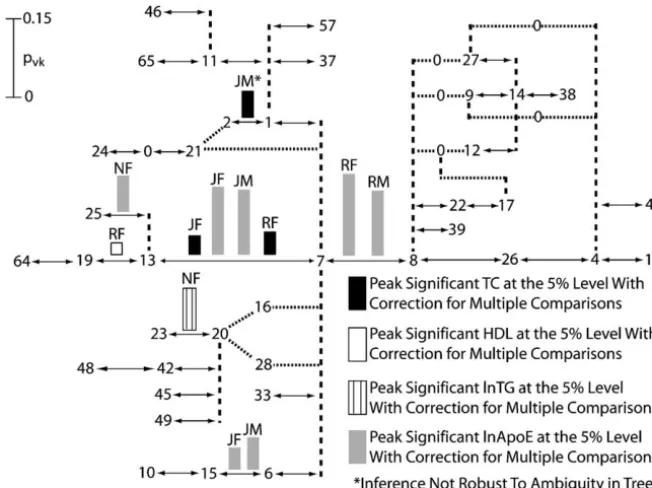
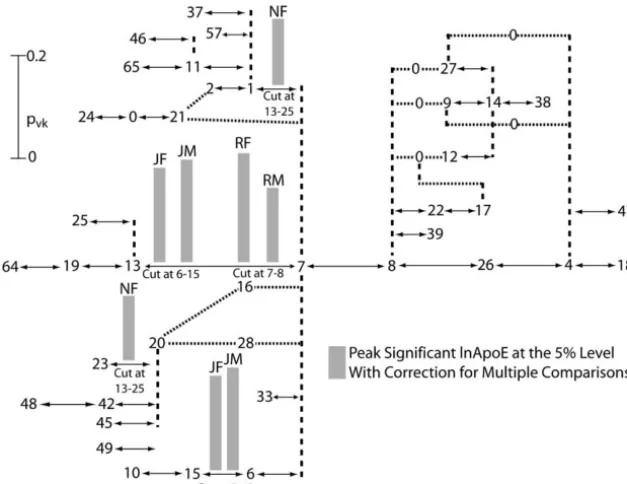
testing did not correct for multiple tests (Templeton so Figure 5 shows only the peak branches from Table 4. To obtain the second round of tree scanning for the
et al.1988), we examine the tree-scan tests without
cor-rection for multiple testing. As can be seen from Table 3, APOEtree, all peak branches for a particular trait and population sample identified in the first round of testing the uncorrected P-value for the 17–19 branch in the
Figure 2.—The results of the first round of tree scanning on theAdhhaplotype tree for the phenotype of Adh activity. The haplotype tree is the same as shown in Figure 1, but drawn in a different fashion. Double-headed arrows indicate single mutational changes. Dashed vertical lines are used to indicate multiple branches coming off a single node, but the dashed lines themselves do not indicate any mutational change. Thepvk values that were statistically significant at the 0.05 level of probability with and without correcting for multiple tests are shown above the branch with which they were associated.
and population sample were analyzed by an additional 7–13(Figures 5 and 6). Moreover, the strongest pheno-typic effects are associated with these two branches. Even cut in the APOE tree conditioned on the first-round
peak being cut. Table 5 shows the branches conditioned though these two branches are adjacent in the APOE
tree (Figure 4), two rounds of tree scanning successfully on the cut branch that had statistically significant
associ-ations (Pⱕ0.05) after adjusting for multiple testing in separated their effects. For example, Figure 5 shows that the first round of tree scanning detected a significant the second round of tree scanning and Figure 6 shows
peak association on the7–8branch with the phenotype the second-round peaks. The combined analyses over
of ln ApoE in both Rochester males and females, our all traits and population samples carried out in the two
largest sample. The7–8branch was therefore cut in the rounds of tree scanning as summarized in Figures 5 and
6 identified 16 significant peak splits in theAPOEtree located on eight distinct branches, 11 of which are asso-ciated with ln ApoE, the phenotype most directly related to the function of the candidate gene.
The tree-scan results are consistent with the prior literature that branches7–8(ε3 vs.ε4) and7–13(ε3 vs.
ε2) should delineate significant phenotypic effects. Ten of the 16 distinct phenotypic associations found by tree scanning include branches7–8and/or7–13(Tables 4 and 5) and 8 peak associations map to branches7–8or
TABLE 3
Results from the second round of tree scanning theAdh
data set conditioned on the1–15branch being cut
to define two initial alleles,AandB
Corrected Branch F- statistic pvk Probability probability
WithinA
Figure3.—The results of the second round of tree scanning
0–8 109.59 0.84 0.0004 0.0006
on theAdhhaplotype tree for the phenotype of Adh activity
8–9 94.59 0.82 0.0248 0.2740
conditioned upon cutting the branch between haplotypes1 and15to make two prior allelic classes,AandB. Thepvkvalues WithinB
in this case show the amount of phenotypic variance explained
17–19 136.56 0.87 0.0388 0.1962
by cutting the1–15branch and a second branch withinAor B. Thepvkvalues are shown above the branch cut in addition Only branches that are significant at the Pⱕ 0.05 level,
Figure 4.—The esti-mated haplotype tree for ApoEunder statistical parsi-mony. Haplotypes are desig-nated by the numbers given in Table 1, with 0 indicating intermediate haplotypes not present in the sample. Each double-headed arrow indicates a single-nucleo-tide change, and the dotted lines show possible alterna-tive branches that are due to phylogenetic ambiguity. The number by each dou-ble-headed arrow indicates the DNA position that mu-tated using the numbers given in Fullerton et al. (2000). Boxes enclose those haplotypes that belong to the three major electropho-retic allele classes: ε2, ε3, andε4.
Rochester populations for the second round of tree of tree scanning is with the phenotype of ln ApoE and maps to a branch adjacent to the7–13 branch, which scanning on the phenotype of ln ApoE. As can be seen
in Figure 6, a second peak association was mapped in is also statistically significant (Table 4). In this case, the peak defined by thepvkvalues is not very pronounced, the second round of tree scanning to the7–13branch
in both genders. going from 7.4% for the 13–25 branch to 7.0% for
the7–13branch. It is therefore possible that the true Besides the 7–8 and7–13 branches that define the
traditional protein electrophoretic alleles at theAPOE phenotypic association in this case is actually due to the 7–13 branch and that tree scanning assigned the gene, the only other branch that shows replication in
its phenotypic associations in the tree scan is the6–15 association to an adjacent branch due to stochastic fluc-tuations arising from the shallowness of the peak. How-branch for the phenotype of ln ApoE in Jackson males
and females (Figures 5 and 6). This branch is absent ever, the remaining three associations in North Karelia females do not include any of the branches associated in the other two populations, so replication across
popu-lations cannot be tested. Interestingly, the6–15branch with amino acid changes in the statistically significant set (Tables 4 and 5), so North Karelia females remain is defined by an amino acid coding change at site 4036
in the APOE DNA sequence. Only 4 of the 21 SNPs an outlier in the tree-scan analysis. The North Karelia
sample is also atypical because it has one of the highest scored in this study involve coding sequence, yet 10 of
the 16 peaks map to three branches defined by amino incidences of coronary artery disease known from stud-ies of human populations throughout the world ( Tun-acid coding SNPs. Hence, all three of these amino Tun-acid
changes appear to be important in the Jackson popula- stall-Pedoeet al.1994).
Only one detected association is sensitive to the ambi-tion in influencing the level of ln ApoE. These results
suggest that theε3allelic class has internal phenotypic guity of the tree topology (the1–2branch in Figure 5). When haplotype21 connects directly to haplotype 2, heterogeneity in the Jackson sample and should be
sub-divided into two alleles by the state of this third polymor- we detect a significant association with the phenotype of total cholesterol on the1–2branch in Jackson males, phic amino acid coding position.
Of the remaining six phenotypic peaks, four are de- but when haplotype21connects to haplotype7, no sig-nificant association is detected. Until this evolutionary tected in North Karelia females on three branches
(branch 13–25 for ln ApoE, branch 20–23 for ln TG ambiguity can be resolved (which in turn may be due
to an error in an inferred haplotype), we would regard and ln ApoE, and branch1–7for ln ApoE). All three
of these branches are found in all population samples, such phylogenetically sensitive inferences as tentative. APOE tree-scan analysis using prior knowledge: Ta-so the lack of replicability across populations is not
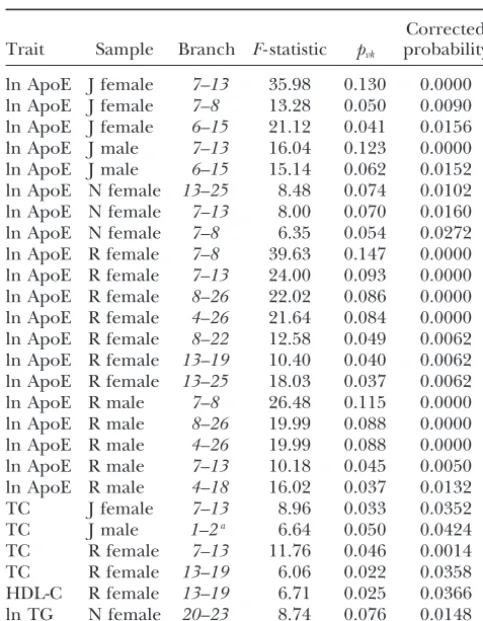
TABLE 4 ations were discovered after correction for multiple test-ing. Eighteen of these SNP associations correspond to
Branches with statistically significant (ⱕ0.05) phenotypic
the mutations that define branches with significant
asso-associations after correcting for multiple testing from
ciations in the tree scan for the corresponding trait,
the first round of tree scanning of theAPOE
haplotype tree in six human samples population, and gender. Four SNP associations have no
defined by geographical corresponding significant branch in the tree-scan
analy-location and gender sis, and 10 branch associations have no corresponding
significant SNP association. Therefore, although the two Corrected analyses yield largely concordant inferences, the tree Trait Sample Branch F- statistic pvk probability scan detected more associations overall than the single
SNP analysis. ln ApoE J female 7–13 35.98 0.130 0.0000
ln ApoE J female 7–8 13.28 0.050 0.0090 ln ApoE J female 6–15 21.12 0.041 0.0156
DISCUSSION ln ApoE J male 7–13 16.04 0.123 0.0000
ln ApoE J male 6–15 15.14 0.062 0.0152
The analysis of the DrosophilaADHtree allows a direct ln ApoE N female 13–25 8.48 0.074 0.0102
comparison between the nested clade analysis and tree ln ApoE N female 7–13 8.00 0.070 0.0160
scanning. When comparable statistical tests and criteria ln ApoE N female 7–8 6.35 0.054 0.0272
are used, the nested clade analysis and the tree-scan ln ApoE R female 7–8 39.63 0.147 0.0000
ln ApoE R female 7–13 24.00 0.093 0.0000 analysis of theAdhdata set yield identical inferences at ln ApoE R female 8–26 22.02 0.086 0.0000 similarP- levels. Hence, these two different methods use ln ApoE R female 4–26 21.64 0.084 0.0000 the evolutionary historical information in the haplotype ln ApoE R female 8–22 12.58 0.049 0.0062
tree in a similar fashion. In contrast, a standard paramet-ln ApoE R female 13–19 10.40 0.040 0.0062
ric analysis of variance (ANOVA) on these data that makes ln ApoE R female 13–25 18.03 0.037 0.0062
no use of theAdhhaplotype tree detects only the pheno-ln ApoE R male 7–8 26.48 0.115 0.0000
typic effects associated with the1–15branch (Templeton
ln ApoE R male 8–26 19.99 0.088 0.0000
ln ApoE R male 4–26 19.99 0.088 0.0000 et al.1987, 1988) even with no correction for multiple ln ApoE R male 7–13 10.18 0.045 0.0050 tests. Both nested clade analysis and tree scanning de-ln ApoE R male 4–18 16.02 0.037 0.0132 tected additional allelic categories with distinct
phe-TC J female 7–13 8.96 0.033 0.0352
notypic associations that are invisible to the standard
TC J male 1–2a 6.64 0.050 0.0424
ANOVA (Templetonet al.1987, Table 1). Thus, placing
TC R female 7–13 11.76 0.046 0.0014
haplotypes into their evolutionary context clearly
aug-TC R female 13–19 6.06 0.022 0.0358
ments our ability to detect current genotype/phenotype HDL-C R female 13–19 6.71 0.025 0.0366
ln TG N female 20–23 8.74 0.076 0.0148 associations in this example.
The APOE analysis identified the associations ex-The populations sampled are J, Jackson; N, North Karelia;
pected from the prior literature as well as several addi-and R, Rochester.
tional associations. Of 16 different peak inferences, only aThis branch association was sensitive to the phylogenetic
ambiguity in the tree and did not hold up for all possible one was sensitive to the ambiguity reflected by the 48 phylogenetic resolutions. distinct haplotype trees under statistical parsimony. The
existence of even this one phylogenetically sensitive in-ference illustrates the importance of estimating haplo-theAPOEhaplotype tree were cut on the basis of prior type trees with an algorithm such as TCS, which yields a information that the traditional ε2, ε3, and ε4 allelic 95% confidence set of phylogenetic connections rather classes have strong phenotypic associations. Two new as- than just a single best tree. In a fully resolved tree ofn sociations emerge with the addition of this prior infor- haplotypes, there will be n ⫺ 1 branches. In the case mation (Table 6) beyond that already shown in Figures 5 ofAPOE, we had 39 haplotypes, so a fully resolved tree and 6: a significant effect on HDL-C in North Karelia would require scanning 38 branches. However, because females that is evenly distributed across three adjoining of ambiguities in tree topology and/or haplotype infer-branches within the ε4 portion of the haplotype tree ence, we had to consider alternative resolutions, causing and a significant effect on ln TG in Rochester males us to consider a total of 60 possible branches. The num-localized to branch4–18, also within theε4portion of ber of tests performed has a direct impact on the statisti-the haplotype tree. The results shown in Table 6 along cal power to detect phenotypic associations when the with the original tree-scan results in Tables 4 and 5 correction for multiple tests is executed. Hence, if the indicate that there is significant functional heterogene- APOEtree were more resolved, our statistical power would ity within all three of the traditional electrophoretic increase. Nevertheless, the APOE results clearly show
allelic classes at theAPOEgene. that tree scanning can and does work even when there
APOEsingle SNP analysis: Table 7 shows the results is much ambiguity in the tree topology.
associ-Figure5.—Results of the first round of tree scanning on theApoEhaplotype tree for four lipid phenotypes in three human populations stratified by gender. The tree drawing conventions are the same as those given in Figure 2, but with the addition of dotted lines that show possible alternative branches that are due to phylogenetic ambi-guity. Only the peak associations after cor-rection for multiple testing are shown. Above every peak association are letters that indicate the population and gender for which the association was found: JF, Jackson females; JM, Jackson males; NF, North Kare-lia females; RF, Rochester females; and RM, Rochester males.
can be completely avoided by testing for associations The results for Jackson females reveal an additional benefit of tree scanning over single SNP analyses. The sin-with the SNPs directly. This has the advantage of directly
increasing power by reducing the number of tests. There gle SNP analyses find a significant association of ln ApoE with SNPs 3937, 4036, and 4075 (Table 7); the tree scan are only 21 SNPs, but there are 38 branches in a fully
resolved tree and 60 branches in the set of probable finds the phenotype of ln ApoE is significantly associated with branches7–8(defined by SNP 3937),6–15(defined trees. If tree scanning is to have an advantage over SNP
analyses, it must tap into sufficient additional biological by SNP 4036), and7–13(defined by SNP 4075) (Tables 4 and 5). Although the results seem to be identical, information that more than compensates for this
pen-alty in statistical power when correcting for multiple they are not. The three SNPs associated with ln ApoE variation in the single SNP analyses are tightly linked tests. As can be seen by contrasting Tables 4 and 5vs.7,
more traits had significant associations in more popula- in a small portion of the APOE gene spanning just 138 bp. An investigator obtaining these results would tions with tree scanning than with multiple single SNP
analyses. Obviously, there is biological information in be faced with the conundrum of whether or not these three statistically significant signals were three biologi-the haplotypes and biologi-their evolutionary relationships that
more than compensates for the need of additional testing. cally independent signals or just one signal confounded
TABLE 5
Branches with statistically significant (ⱕ0.05) phenotypic associations after correcting for multiple testing
from the second round of tree scanning of theApoEhaplotype tree in six human populations
defined by geographical location and gender
First-round Second-round Corrected
Trait Sample cut branch branch F- statistic pvk probability
ln ApoE J females 7–13 6–15 35.90 0.182 0.0334
ln ApoE J females 6–15 7–13 35.90 0.182 0.0000
ln ApoE J females 6–15 7–8 14.38 0.079 0.0170
ln ApoE J males 7–13 6–15 14.40 0.200 0.0024
ln ApoE J males 6–15 7–13 14.40 0.200 0.0000
ln ApoE J males 6–15 7–8 8.85 0.128 0.0122
ln ApoE N females 13–25 1–7 6.31 0.124 0.0294
ln ApoE N females 13–25 7–8 6.25 0.123 0.0312
ln ApoE N females 13–25 20–23 7.29 0.119 0.0424
ln ApoE R females 7–8 7–13 24.24 0.206 0.0014
ln ApoE R males 7–8 7–13 13.74 0.140 0.0426
Figure6.—Results of the second round of tree scanning on theApoEhaplotype tree for four lipid phenotypes in three human popula-tions stratified by gender. The tree-drawing conventions are the same as those given in Figure 5. Only the peak associations after cor-rection for multiple testing are shown above the branch cut in addition to the conditional cut, which is indicated below the correspond-ingpvkvalue. Above every peak association are letters that indicate the population and gender for which the association was found: JF, Jack-son females; JM, JackJack-son males; NF, North Kar-elia females; RF, Rochester females; and RM, Rochester males.
by tight linkage. The results of the single SNP analyses ln ApoE to a smaller number of branches and identifies distinct associations. In general, when dealing with small
per se yield no insight into how to resolve this
conun-drum. In contrast, the tree-scan analysis makes it clear DNA regions characterized by much internal linkage disequilibrium, the results of multiple single SNP analy-on the first round (and canaly-onfirmed by the secanaly-ond round)
that these three significant sites map onto two biologi- ses are difficult to interpret biologically. By utilizing the structure of the haplotype tree (one of the major deter-cally distinct impacts on the phenotype of ln ApoE; one
peak is associated with branch7–13(SNP 4075) and a minants of the pattern of linkage disequilibrium in the DNA region), tree scanning makes use of the internal second,distinctpeak is associated with branch6–15(SNP
4036). Similar situations occur in Jackson males and in linkage disequilibrium and identifies subsets of the statistically significant associations that represent bio-Rochester females and males for ln ApoE. In all of these
cases, SNP analyses find multiple SNPs showing linkage logically distinct phenotypic associations. This is a tre-mendous advantage of tree scanning (and nested clade disequilibrium that are associated with variation in ln
ApoE. Tree scanning identifies the branches associated analysis) over single SNP analyses.
Another advantage of tree scanning is how it deals with with these same SNPs, but then localizes these effects on
TABLE 6
Branches with statistically significant (ⱕ0.05) phenotypic associations after correcting for multiple testing
conditioned upon the prior cutting of the7–8and7–13branches of theApoEhaplotype tree
in six human samples defined by geographical location and gender
Branches with significant effects for the phenotype of
Sample ln TG TC HDL-C ln ApoE
J females 6–15(4036)
J males 1–2a(560) 6–15(4036)
N females 20–23(560) 8–22(4951):8–26(1998):4–26a(832) 13–19(560):13–25(624) 20–23(560)
N males 4–18(624) R females
R males
The populations sampled are J, Jackson; N, North Karelia; and R, Rochester. Branches are indicated by the haplotypes they connect, and the SNP number associated with the branch is indicated in parentheses. Sets of branches that are contiguous in the tree are separated by a colon whereas noncontiguous sets appear on separate lines
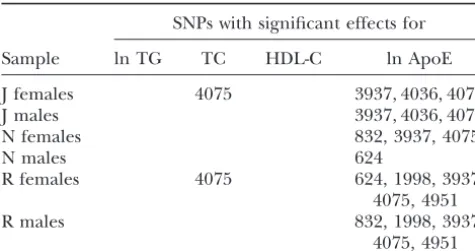
TABLE 7 age disequilibrium with a functional marker, its signal of phenotypic association is not diluted by pooling it
SNPs with statistically significant (ⱕ0.05) phenotypic
with the other homoplasious mutational events. Thus,
associations after correcting for multiple testing in
tree scanning can detect an association with a branch
six human samples defined by geographical
location and gender associated with a homoplasious marker site that is
invisi-ble to single SNP association studies.
SNPs with significant effects for This advantage of tree scanning in dealing with homo-plasy is lost when the nucleotide site showing homohomo-plasy
Sample ln TG TC HDL-C ln ApoE
is also the functional site. Note that the single SNP analy-J females 4075 3937, 4036, 4075 sis detected a significant association of site 832 with the
J males 3937, 4036, 4075 phenotype of ln ApoE in North Karelia females and
N females 832, 3937, 4075 Rochester males, but none of the branches associated
N males 624
with a significant impact on ln ApoE in the tree scan
R females 4075 624, 1998, 3937,
are marked by this SNP. Site 832 also shows much homo-4075, 4951
plasy, mutating at least six times in theAPOEhaplotype
R males 832, 1998, 3937,
4075, 4951 tree. However, unlike site 560, there is evidence that site 832 codes for a functional variation. This site is in the The populations sampled are J, Jackson; N, North Karelia;
promotor region of theAPOEgene, and lower levels of and R, Rochester. SNPs are indicated by the DNA position
the ApoE protein are associated with theTnucleotide numbers given inFullertonet al.(2000).
state at this SNP as compared to theGstate, an effect that may be attributable to differential binding of nuclear proteins involved withcis-acting transcriptional regula-homoplasy. Homoplasy occurs when the same
muta-tional transition occurs more than once in the evolution- tion (Artigaet al. 1998). If the functional effect of a homoplasious SNP does not depend greatly upon the ary history of the gene region. Homoplasy is a common
phenomenon, found in almost all human haplotype trees, context defined by other SNPs, the single SNP analysis will have greater sensitivity than the tree scan because including theAPOEtree. The commonness of multiple
mutational hits at the same nucleotide site is to be ex- the tree scan splits up the sample into many separate allelic categories. To test the functionality of homoplasi-pected because the mutagenic process is highly
nonran-dom in humans, resulting in mutational hotspots (Tem- ous sites, we recommend that each homoplasious SNP (identifiable from the haplotype tree) also be subjected pletonet al.2000). The impact of homoplasy upon the
relative merits of tree scanningvs.SNP analyses depends to a single-site analysis for phenotypic association. A discrepancy in which the single SNP analysis finds a upon whether or not the nucleotide site showing
multi-ple mutational hits is also a functional site. In most cases, phenotypic association and the tree scan does not would suggest that the homoplasious site itself might have a SNP will be a marker rather than a directly functional
mutation, and in this case tree scanning has a great functional significance. Instead of such a discrepancy being a problem, tree scanning coupled with single ho-advantage over multiple single SNP analyses because
the tree itself adjusts for homoplasy. For example, tree moplasious site analyses enables us to make more power-ful biological inference and leads to avenues of investi-scanning found significant associations of ln TG and ln
ApoE with branch20–23in the North Karelia females gation that would not otherwise be known. In this case, tree scanning can suggest functional hypotheses for in-and of HDL C with branch13–19in Rochester females,
all defined by mutations at site 560. The single SNP dividual sites, as it does in the case of site 832.
Another advantage of tree scanning is that it is easy analysis of site 560 found none of these associations,
despite itsa priori advantage in statistical power when to incorporate prior information. As mentioned above, there is much prior information that sites 3937 and correcting for multiple testing. Site 560 shows much
homoplasy, having mutated a minimum of four times 4075 are functionally important. When we incorporated
this prior information, thereby starting with a three-in the APOE tree. Thus, when one pools together all
the copies of this gene withAat site 560 into one allele allele system (corresponding to the traditional ε2,ε3, and ε4 alleles), tree scanning detected two additional and all the copies withTat this site into a second allele,
one is actually pooling together into a single allele the peak associations (Table 6) and showed that there is functional heterogeneity within each of the traditional products of two or more distinct mutations. In
popula-tion genetics parlance, these alleles are identical-by-state electrophoretic alleles. The fact that additional associa-tions were found in this analysis indicates that prior but not identical-by-descent. If the site being used to
define such alleles is not functionalper se, the signal of knowledge can augment the power of the tree scan. We can also use Table 6 to compare tree scanning with functionality due to linkage disequilibrium with another
site is weakened by pooling sequences that are not iden- the work of Stenga˚rd et al. (2002) on the same data set analyzed in this article. Stenga˚rdet al. (2002) also tical-by-descent. In contrast, tree scanning considers
link-for heterogeneity within these three allelic classes by ask- concordant with prior information about allele classes with functional significance, indicating that the tree-ing if addtree-ing on a third SNP in addition to SNPs 3937
and 4075 (the two that define theε2,ε3, andε4alleles) scan inferences have biological validity in this case. Tree scanning found more phenotypic associations than sin-would significantly improve the explanation of
pheno-typic variance. Thus, contrasting their results with the gle SNP analyses and other alternatives did, particu-larly at sites that have experienced multiple mutational results given in Table 6 provides a direct comparison
of the strategies of adding a third SNPvs.cutting a third hits. This is an important property of tree scanning be-cause SNPs associated with mutagenic sites are extremely branch in the prior allelic classes.Stenga˚rdet al. (2002)
found five cases in which a third SNP did indeed result common in some candidate regions (Templetonet al. 2000). Finally, tree scanning provides clearer biological in significant improvement in explaining phenotypic
variance, and three of these are also found by tree scan- interpretations than single SNP analyses do, such as the ability to identify biologically distinct associations within ning (the ones found in Jackson females and males in
Table 6). However,Stenga˚rdet al. (2002) did not cor- a highly correlated data set.
rect for multiple tests, so to make the analyses more We thank Deborah Nickerson for genotyping theAPOESNPs and comparable, we must look at the uncorrectedP-values Gary W. Oehlert and Christopher Bingham for the help in using the MacAnova program. We thank the following employees of Variagenics
in the tree. Using uncorrectedP- values, the same SNPs
for their valuable input into the general problem of phenotype/
identified as significant by Stenga˚rd et al. (2002) are
genotype associations and into the development of the tree-scanning
also identified by tree scanning with similar levels of
un-program: Vincent Stanton, Jr., Daniel Chasman, Lakshman
Subrahman-corrected significance with the exception of SNP 1575 yan, and Carsten Wiuf. We thank Anthony Brown and three anonymous in North Karelia males for ln ApoE. Because we ex- reviewers for their suggestions on an earlier draft of this article. We gratefully acknowledge support from the Burroughs Wellcome Fund
cluded some of the data as described inmaterials and
Innovation Award in Functional Genomics (100133); a National
Sci-methods, there were no observations to test the branch
ence Foundation predoctoral fellowship award to Taylor Maxwell;
associated with SNP 1575 (branch 42–48) in the tree- and the National Institutes of Health grants HL39107, HL58240, scan analysis. Thus, tree scanning detected all of the HL072905 and GM65509.
effects found byStenga˚rdet al. (2002) that were possi-ble to test. The main difference between tree scanning
and adding a third SNP is that tree scanning detected LITERATURE CITED
five additional branches with significant phenotypic
as-Adkins, R., 2004 Comparison of the accuracy of methods of
compu-sociations even with correction for multiple testing (Ta- tational haplotype inference using a large empirical dataset. BMC
Genet.5:22.
ble 6). These five associations were actually stronger
Aquadro, C. F., S. F. Desse, M. M. Bland, C. H. LangleyandC. C.
than the two detected byStenga˚rd et al. (2002) that
Laurie-Ahlberg, 1986 Molecular population genetics of the
were not significant after correction for multiple testing Alcohol dehydrogenase gene region ofDrosophila melanogaster.
Genetics114:1165–1190.
in the tree scan. The reason these stronger associations
Artiga, M. J., M. J. Bullido, I. Sastre, M. Recuero, M. A. Garcia
were not detected byStenga˚rd et al. (2002) is due in
et al., 1998 Allelic polymorphisms in the transcriptional
regula-all cases to homoplasy: the highly homoplasious SNPs tory region of the apolipoprotein E gene. FEBS Lett.421:105–108.
Balciuniene, J., L.Emilsson, L.Oreland, U.Petterssonand E. E.
560, 624, and 832 define these additional branches.
Jazin, 2002 Investigation of the functional effect of monoamine
Overall, the tree scan detected the same effects as that
oxidase polymorphisms in human brain. Hum. Genet.110:1–7.
by adding a third SNP in the analysis ofStenga˚rdet al. Bingham, C.,andG. W. Oehlert, 2003 MacAnova Reference Manual,
Version 4.13, Technical Report No. 618. School of Statistics,
Uni-(2002), but found additional and stronger phenotypic
versity of Minnesota, Minneapolis.
associations with branches defined by homoplasious
Boerwinkle, E., andC. F. Sing, 1986 Bias of the contribution of
SNPs than with those found just by adding a third SNP. single locus effects to the variance of a quantitative trait. Am. J.
Hum. Genet.39:137–144.
The examples analyzed in this article show that tree
Boerwinkle, E., S. A. Brown, K. Rohrbach, J. A. M. GottoandW.
scanning has much promise as a tool for discovering
Patsch, 1991 Role of apolipoprotein E and B gene variation
phenotypic associations with genetic variation in candi- in determining response of lipid, lipoprotein, and
apolipopro-tein levels to increased dietary cholesterol. Am. J. Hum. Genet.
date genes. TheAdh example indicates that tree
scan-49:1145–1154.
ning is comparable to nested clade analyses using
per-Clement, M., D. PosadaandK. Crandall, 2000 TCS: a computer
mutation testing. The concordance of the results also program to estimate gene genealogies. Mol. Ecol.9:1657–1659.
Crandall, K. A., and A. R. Templeton, 1993 Empirical tests of
indicates that both methods extract comparable
in-some predictions from coalescent theory with applications to
formation from the haplotype tree. When standard
intraspecific phylogeny reconstruction. Genetics134:959–969.
NANOVA is not an option, tree scanning has many Drysdale, C. M., D. W. McGraw, C. B. Stack, J. C. Stephens, R. S.
Judsonet al., 2000 Complex promoter and coding region beta
advantages over nested clade analysis: it is simple to
2-adrenergic receptor haplotypes alter receptor expression and
implement; it allows an evaluation of all the phenotypic
predict in vivo responsiveness. Proc. Natl. Acad. Sci. USA97:
effects associated with genotypes, including dominance 10483–10488.
Fullerton, S. M., A. G. Clark, K. M. Weiss, D. A. Nickerson, S. L.
and recessiveness; it is simple to accommodate
phyloge-Tayloret al., 2000 Apolipoprotein E variation at the sequence
netic ambiguity in the tree; and it is easy to incorporate
haplotype level: implications for the origin and maintenance of
prior information about functional variation. TheAPOE a major human polymorphism. Am. J. Hum. Genet.67:881–900.
Hallman, D. M., S. Visvikis, J. SteinmetzandE. Boerwinkle, 1994
The effect of variation in the apolipoprotein B gene on plasmid Stephens, M., N. J. SmithandP. Donnelly, 2001 A new statistical lipid and apolipoprotein B levels. I. A likelihood-based approach method for haplotype reconstruction from population data. to cladistic analysis. Ann. Hum. Genet.58:35–64. Am. J. Hum. Genet.68:978–989.
Jeffreys, A., L. KauppiandR. Neummann, 2001 Intensely punctate Templeton, A. R., 1995 A cladistic analysis of phenotypic
associa-meiotic recombination in the class II region of the major histo- tions with haplotypes inferred from restriction endonuclease compatibilty complex. Nat. Genet.29:217–222. mapping or DNA sequencing. V. Analysis of case/control
sam-Kaprio, J., R. E. Ferrell, B. A. Kottke, M. I. KambohandC. F. pling designs: Alzheimer’s disease and the Apoprotein E locus.
Sing, 1991 Effects of polymorphisms in apolipoproteins E, A-IV, Genetics140:403–409.
and H on quantitative traits related to risk for cardiovascular Templeton, A. R., E. BoerwinkleandC. F. Sing, 1987 A cladistic disease. Arterioscler. Thromb.11:1330–1348. analysis of phenotypic associations with haplotypes inferred from
Knoblauch, H., A. Bauerfeind, C. Krahenbuhl, A. Daury, K. restriction endonuclease mapping. I. Basic theory and an analysis
Rohdeet al., 2002 Common haplotypes in five genes influence of alcohol dehydrogenase activity in Drosophila. Genetics 117:
genetic variance of LDL and HDL cholesterol in the general 343–351.
population. Hum. Mol. Genet.11:1477–1485. Templeton, A. R., C. F. Sing, A. KesslingandS. Humphries, 1988
Martin, E. R., E. H. Lai, J. R. Gilbert, A. R. Rogala, A. J. Afshari A cladistic analysis of phenotypic associations with haplotypes
et al., 2000 SNPing away at complex diseases: analysis of single- inferred from restriction endonuclease mapping. II. The analysis nucleotide polymorphisms around APOE in Alzheimer disease. of natural populations. Genetics120:1145–1154.
Am. J. Hum. Genet.67:383–394.
Templeton, A. R., K. A. CrandallandC. F. Sing, 1992 A cladistic
Reich, D. E., S. F. Schaffner, M. J. Daly, G. McVean, J. C. Mullikin
analysis of phenotypic associations with haplotypes inferred from
et al., 2002 Human genome sequence variation and the
influ-restriction endonuclease mapping and DNA sequence data. III. ence of gene history, mutation and recombination. Nat. Genet.
Cladogram estimation. Genetics132:619–633.
32:135–142.
Templeton, A. R., A. G. Clark, K. M. Weiss, D. A. Nickerson,
Seltman, H., K. RoederandB. Devlin, 2001
Transmission/disequi-E. Boerwinkle et al., 2000 Recombinational and mutational
librium test meets measured haplotype analysis: family-based
asso-hotspots within the humanLipoprotein Lipasegene. Am. J. Hum. ciation analysis guided by evolution of haplotypes. Am. J. Hum.
Genet.66:69–83. Genet.68:1250–1263.
Tunstall-Pedoe, H., K. Kuulasmaa, P. Amouyel, D. Arveiler, A.
Sing, C. F., andJ. Davignon, 1985 Role of the Apolipoprotein E
Rajakangaset al., 1994 Myocardial infarction and coronary deaths
polymorphism in determining normal plasma lipid and
lipopro-in the World Health Organization MONICA Project. Registration tein variation. Am. J. Hum. Genet.37:268–285.
procedures, event rates, and case-fatality rates in 38 populations
Stenga⬚rd, J. H., K. E. Zerba, J. Pekkanen, C. Ehnholm, A. Nissinen
from 21 countries in four continents. Circulation90:583–612.
et al., 1995 Apolipoprotein E polymorphism predicts death from
Van Eerdewegh, P., R. D.Little, J.Dupuis, R. G. D.Mastro, K.
coronary heart disease in a longitudinal study of elderly Finnish
Fallset al., 2002 Association of the ADAM33 gene with asthma
men. Circulation91:265–269.
and bronchial hyperresponsiveness. Nature418:426–430.
Stenga⬚rd, J. H., J. Pekkanen, C. Ehnholm, A. NissinenandC. F.
Sing, 1996 Genotypes with the Apolipoprotein Epsilon-4 allele Westfall, P. H., andS. S. Young, 1993 Resampling-Based Multiple
are predictors of coronary heart disease mortality in a longitudi- Testing. John Wiley & Sons, New York.
nal study of elderly Finnish men. Hum. Genet.97:677–684. Zaykin, D. V., P. H. Westfall, S. S. Young, M. A. Karnoub, M. J.
Stenga⬚rd, J. H., A. G. Clark, K. M. Weiss, S. Kardia, D. A. Nickerson Wagneret al., 2002 Testing association of statistically inferred
et al., 2002 Contributions of 18 additional DNA sequence varia- haplotypes with discrete and continuous traits in samples of unre-tions in the gene encoding Apoliprotein E to explaining variation lated individuals. Hum. Hered.53:79–91.
in quantitative measures of lipid metabolism. Am. J. Hum. Genet.