DOI: 10.1534/genetics.104.036293
A Comparison of Three Estimators of the Population-Scaled Recombination
Rate: Accuracy and Robustness
Nick G. C. Smith and Paul Fearnhead
1Department of Mathematics and Statistics, Lancaster University, Lancaster LA1 4YF, United Kingdom
Manuscript received September 14, 2004 Accepted for publication May 6, 2005
ABSTRACT
We have performed simulations to assess the performance of three population genetics approximate-likelihood methods in estimating the population-scaled recombination rate from sequence data. We measured performance in two ways: accuracy when the sequence data were simulated according to the (simplistic) standard model underlying the methods and robustness to violations of many different aspects of the standard model. Although we found some differences between the methods, performance tended to be similar for all three methods. Despite the fact that the methods are not robust to violations of the underlying model, our simulations indicate that patterns of relative recombination rates should be inferred reasonably well even if the standard model does not hold. In addition, we assess various techniques for improving the performance of approximate-likelihood methods. In particular we find that the composite-likelihood method of Hudson(2001) can be improved by including log-likelihood contributions only for pairs of sites that are separated by some prespecified distance.
K
NOWLEDGE of how recombination rates vary across genomes is of critical importance in evolutionary studies (What are the causes and implications of such variation?) and mapping studies (How can we best map disease genes?). In particular, the study of fine-scale re-combination rate variation across the human genome is a focus of current research efforts (Crawfordet al.2004; McVeanet al.2004). A variety of methods are available for measuring recombination rates: pedigree methods, sperm typing methods, and population genetics methods. Pedigree data give recombination maps that when compared with physical maps yield estimates of recom-bination rates per base pair. Pedigree data provide whole-genome coverage and offer sufficient resolution to study recombination rate variation at the megabase scale. The frequency with which recombination occurs across smaller physical distances makes it impracticable to get accurate measures of recombination rates at such smaller scales. (For example, for a 100-kb region, the probability of recombination is0.001 on the basis of the genomewide average recombination rate, and10,000 informative meioses will be necessary to get a reasonably accurate estimate of the recombination prob-ability.) Sperm typing yields recombination rate esti-mates at the finest possible scale of resolution, i.e., distances between individual segregating sites (Tens to hundreds of base pairs), but would be exceedingly costly to extend to whole-genome studies. In both pedigree
and sperm typing methods recombination events (more precisely their consequences in terms of sequence variation) are observed directly, with pedigree data looking at meioses going back a few generations and sperm typing considering only present-day meioses.
Unlike the other two methods, population genetics methods do not directly observe the consequences of re-combination events, but instead make use of sequence variation data that contain information concerning the history of recombination in the population going back thousands of generations. Furthermore, population ge-netics methods cannot estimater, the rate of crossing over per base pair; instead they estimate the scaled pa-rameterr¼4Ner, whereNeis the effective population size. The inference of recombination rates using pop-ulation genetics methods requires models of how recom-bination events affect patterns of sequence variation. The benefit of population genetics methods is that they offer the potential to study fine-scale variation in re-combination rates across whole genomes, and it is in this area that considerable research effort is being directed. In this study we have addressed the two important prop-erties of current population genetics methods for esti-mating recombination rates: accuracy and robustness.
Consider the problem of estimating a constant re-combination rateracross a region of a chromosome of interest. A number of approaches have been developed (see Stumpf and McVean2003, for a review). Ideally we would estimaterfrom sequence data via calculating the full-likelihood curve of r, for example, using the methods of Griffithsand Marjoram(1996), Kuhner
et al. (2000), or Fearnhead and Donnelly (2001). Each of these methods uses computationally intensive This article is dedicated to the memory of Nick Smith.
1Corresponding author: Department of Mathematics and Statistics,
Lancaster University, Lancaster LA1 4YF, United Kingdom. E-mail: [email protected]
statistical methods to approximate the likelihood curve, and even the most efficient of these can accurately esti-mate this curve only for small data sets (Fearnheadand Donnelly2001). Since full-likelihood analyses of whole-genome data are too computationally intensive, it is nec-essary to use approximate-likelihood methods. Various approximate-likelihood methods have been proposed, but comparisons of these methods are not readily avail-able (it is hard to compare separate simulation studies on different methods due to differences in parameter set-tings). We have considered three approximate-likelihood methods that make use of full-sequence data (Hudson 2001; Fearnheadand Donnelly2002; Liand Stephens 2003), and we have compared their accuracy directly in estimating recombination rates using simulated se-quence data. We have not considered simpler types of methods for estimating recombination rates with moment-based estimators or summary statistics (see Stumpfand McVean, 2003 for a list of such methods).
When simulating sequence data for the initial com-parison of the approximate-likelihood methods, we ad-hered to the standard model assumptions of the neutral coalescent for a panmictic constant-sized population. Given that many of the standard model assumptions may not hold for real sequence data, it is important to see how different methods compare when model assump-tions are violated. Little is known about the robustness of approximate-likelihood recombination rate estima-tors except for the few studies summarized below, all of which used models chosen to mimic human evolution.
Fearnheadand Donnelly(2001) considered various models of population growth and population subdi-vision and found that the performance of their full-likelihood importance-sampling estimator differed little from the case of panmixia and constant population size. However, due to the computational limitations of full-likelihood methods Fearnhead and Donnelly consid-ered only small data sets for which recombination inference is fairly poor even if the model assumptions hold, so perhaps the power of their test of robustness was weak. Liand Stephens(2003) considered the per-formance of their approximate-likelihood method in detecting and quantifying a recombination hotspot under models of population growth and population structure. They found that population growth affected hotspot detection (through either reduced power or increased type I error), although hotspot detection was robust to population structure. When they considered quantification of the magnitude of the hotspot relative to the background recombination rate, population struc-ture was actually found to increase accuracy, although population growth led to overestimation of the magni-tude of the hotspot. McVeanet al. (2004) considered the robustness of their method for analyzing fine-scale recombination rate variation, on the basis of Hudson’s (2001) approximate-likelihood method, to various vio-lations of the standard model. Neither SNP
ascertain-ment nor gene conversion seemed to bias estimates ofr, but both population growth and a population bottle-neck caused recombination rates to be underestimated (see McVeanet al.2004, Table S1). Chris Spencer and Gil McVean (C. Spencerand G. McVean, personal com-munication) found that the LDhat method, a modified finite-sites version of Hudson’s (2001) method, is ro-bust to a variety of forms of natural selection, at least for the parameter ranges investigated.
To give a more comprehensive overview of robustness, we have considered the effects on the three approximate-likelihood methods of many different violations of the standard model assumptions: population growth, pop-ulation bottleneck, poppop-ulation structure, gene conver-sion, nonuniform recombination rates, selective sweeps, finite sites, SNP ascertainment, and genotypic data.
MATERIALS AND METHODS
Recombination rate estimators:We consider three approx-imate-likelihood approaches to estimating a constant recom-bination rate,r, from sequence variation data from a region of interest. These are two composite-likelihood approaches and an approach based on using the likelihood for a simplified model. Throughout we refer to these methods by the names of the computer programs that implement them: maxhap, sequenceLD, and Rholike. The programs can be downloaded from http://home.uchicago.edu/rhudson1/, www.maths.lancs. ac.uk/fearnhea, and www.stat.washington.edu/stephens/home. html, respectively. All models perform inference under a neutral coalescent model for a panmictic constant-sized population.
The primary focus of this article is on analyzing haplotype data, and we describe each of these three methods in this case—with brief discussion of the extensions to analyzing genotype data.
Maxhap:The first composite-likelihood approach is that of Hudson(2001), which involves first calculating the likelihood curve for all pairs of segregating sites and then multiplying together all these curves. So ifris the recombination rate per kilobase, and for segregating sitesiandj
LijðrÞ ¼PrðData at sitesiandjjSitesiandjsegregating;rÞ
is the conditional likelihood of the data at sitesiandjgiven that these sites are segregating, then the composite likelihood is
CLð1ÞðrÞ ¼YLijðrÞ; ð1Þ
where the product is over all pairs of segregating sites. The composite log-likelihood is defined as Cl(1)(r)¼log CL(1)(r).
maxdip, does this) and to analyze data under a finite-sites mutation model (McVeanet al.2002).
A generalization of this approach is to consider composite log-likelihoods of the form
Cl*ðrÞ ¼XwijlogLijðrÞ; ð2Þ
where the sum is over all pairs of segregating sites, and thewij’s are nonnegative weights. It was shown in Fearnhead(2003) that if the weights decay sufficiently quickly as the distance between the sites increases quickly, then the composite likeli-hood in (2) produces a consistent estimator ofrin the limit as the length of the region analyzed (and hence the number of segregating sites) tends to infinity. The composite likelihood in (1) is the special case wherewij¼1 for alliandj; in this case the weights do not decay, and it is not clear whether we obtain a consistent estimator of the recombination rate.
SequenceLD: The second composite-likelihood method was suggested by Fearnheadand Donnelly(2002). It is based on dividing the region of interest into subregions, calculating the likelihood curve for each subregion, and then multiplying all these subregions together. So ifris the recombination rate per kilobase, andLi(r) is the likelihood curve for subregioni, then
CLð2ÞðrÞ ¼Y
i LiðrÞ;
where the product is over all subregions. The results of Fearnhead(2003) show that this composite likelihood pro-duces a consistent estimator as the length of the region of interest increases.
In practice we calculate the approximate marginal likelihood (see Fearnheadand Donnelly2002) for each subregion—this gives a very accurate approximation to the true likelihood, but can be orders of magnitude quicker to calculate.
The accuracy of the composite likelihood also depends on the choice of subregions, and for the results we present in this article we first removed all singleton sites from the data (as these contain little information about the recombination rate) and then chose subregions to each have eight segregating sites. We determined the optimal subregion size by coalescent simulations, as follows. We used the ms program of Dick Hudson (Hudson2002) to give 100 data sets with 50 hap-lotype samples per data set, 10-kb sequences, and mutation and recombination parameters ofu¼1/kb andr¼1/kb. We then ran sequenceLD with different subregion sizes of 6, 8, and 10 sites and found that the root mean square relative error (RMSE) was lowest for subregions of 8 sites (sites, RMSE: 6, 0.62; 8, 0.50; and 10, 0.58).
For this approach it took of the order of half an hour to cal-culate the likelihood curves for each subregion (on the basis of 100,000 draws from the proposal distribution in the importance-sampling scheme), using the program sequence LD.
Note that this is the least flexible of the three approaches we consider. It can be generalized to estimating recombination models easily only where there is a constant recombination rate within each subregion (although it has been used to detect recombination hotspots; see Fearnheadet al.2004), and it can be used only for haplotype data. To analyze genotype data, the phase needs to be estimated, for example, using Phase (Stephenset al.2001; Stephensand Donnelly2003).
Rholike: The final method we consider is that of Li and Stephens(2003), which is based on a tractable approximation to the conditional likelihood of the type ofith haplotype given the types of the firsti1 haplotypes. A likelihood is then con-structed by multiplying these approximate conditional like-lihoods together for an ordered sample of chromosomes. One problem with this method is that the likelihood curve is dependent on the order of the chromosomes in the sample,
and in practice a likelihood curve is obtained as an average over a random subset of possible orderings.
The program Rholike implements this approach to esti-mating a constant recombination rate. We specified Rholike to average the likelihoods calculated over 20 different orderings of the chromosomes.
The method for constructing an approximate likelihood underlying Rholike can also be used to estimate variable recombination rates, to analyze genotypic data, and to detect recombination hotspots (Liand Stephens2003; Crawford et al.2004). There are no theoretical results for this method.
In comparing the three different methods we did not evaluate performance in terms of speed, but instead used rea-sonable and recommended settings for each of the three methods. We found that Rholike was much slower than max-hap but slightly quicker than sequenceLD. For a single simulated data set as described above in the sectionSequenceLD, analysis over a grid of 101r-values from 0 to 2/kb took1 sec for maxhap, 15 min for Rholike, and 80 min for sequenceLD.
Simulation of sequence data:Unless otherwise stated, se-quence data were simulated using the ms program of Hudson (2002), which allows specification of a wide variety of coa-lescent models. In all cases 50 haplotype samples were gen-erated: we did not investigate the effect of changes in sample size. Two classes of simulations were performed. In the first set of simulations the standard assumptions (constant population size, panmixia, neutrality, infinite-sites mutation model, re-combination modeled as a uniform rate of crossing over) were adhered to, and the simulation schemes differ only in terms of the mutation and recombination parametersuandr. We fixed uat 1/kb (roughly that found for humans) and so the ex-pected number of sites was determined by the length of se-quence for which samples were simulated: 2, 10, 25, or 100 kb. Given that the simulations do not fix the observed number of sites in each data set, and so for smallusome data sets may contain very little sequence information, we specified the additional restriction that each data set must contain at least four nonsingletons.
In the second class of simulations we considered various violations of the standard assumptions, generally considering one violation at a time. For all such models, 100 data sets were simulated for 10-kb sequences with bothuandrof 1/kb, al-though additional combinations ofr,u, and sequence length were simulated for some models.
Gene conversion: Instead of all recombination being solely due to crossing over, we simulated recombination by both crossing over and gene conversion, with uniform rates over sequences. The recombination (crossing-over) rate was fixed at 1/kb in all cases, while data sets were simulated with the rate of gene conversion initiation at 1, 5, and 10/kb. Gene con-version tract lengths were distributed exponentially with a mean of 100 bp, within the range of gene conversion tract lengths determined by sperm typing studies ( Jeffreysand May 2004). The effective recombination combining both crossing over and gene conversion was calculated according to Equation 1 in Frisseet al. (2001): this formula gaver0of 1.02, 1.10, and 1.20/kb across the complete 10-kb sequence for the gene conversion rates of 1, 5, and 10/kb.
sequence with a mean of 1/kb. In the latter case we assumed that randomly sized segments across the region (each with an exponential distribution with mean length 1 kb) had inde-pendent recombination rates.
Population growth: Population growth was modeled in the coalescent framework, assuming that the human effective pop-ulation size has increased exponentially from 10,000, 20,000 years ago (or 1000 generations ago assuming a 20-year gen-eration time), to 1 million now (values are similar to those used in Walland Przeworski2000). The problem with scenarios involving changing population sizes is that the expected value ofris unknown: ifNehas been changing over time, then so has r¼4Ner. For such a situation it seems sensible to estimater/u, which should be relatively unaffected by changes inNe. We scaled the mutation rate to give a number of segregating sites per kilobase similar to that under the standard neutral model,
4.5. The recombination rate was scaled by the same amount as the mutation rate. This procedure is equivalent to esti-matingrover Watterson’s estimate ofu, but also ensuring the same amount of sequence data as that for a constant popula-tion size.
Population bottleneck: As an alternative model of changing population size we simulated sequence data according to a bottleneck scenario for the human population:Neconstant at 10,000 until 40,000 years ago, then a bottleneck ofNe¼1000 for 20,000 years, and then back toNe¼10, 000 for 20,000 years (values similar to those used in Walland Przeworski2000). As for the population growth model, years were converted to generations assuming 20 years/generation. Again we user/u, scaling the mutation rate for the simulated data so that on average the same number of segregating sites is observed per kilobase as that in the standard neutral case, with the re-combination rate scaled by the same amount.
Population structure: Sequence data were simulated under the symmetric island model of population structure. For both two and four islands, even and uneven sampling schemes (differing in how the 50 samples were taken from the different islands) were simulated: two-island even, 25 from each island; two-island uneven, 40 from one island and 10 from the other; four-island even, 13 from two islands and 12 from the other two; four-island uneven, 40 from one island, 10 from another, and none from the other two. The migration compound param-eter, 4Nem, which determines the level of population structure, was chosen to achieve averageFST-values of0.25, toward the higher end ofFST-values for distantly related human popula-tions for the cases of even sampling.FSTreflects, among other demographic processes, levels of population subdivision and varies between 0 (panmixia) and 1 (complete isolation). We specified 4Nem¼1.5 for the two-island scheme, which yields an expectedFSTof 0.25 according to Equation 5 in Hudsonet al. (1992), and 4Nem ¼ 3.0 for the four-island scheme, which yields an expectedFSTof 0.27 according to the same formula. The realizedFST-values were determined for the simulated se-quences, using Equation 3 in Hudsonet al.(1992) to estimate FST, with negativeFST-estimates adjusted to zero.
Selective sweep:Sequence data were simulated for a full ( just completed) selective sweep using the SelSim program of Spencerand Coop(2004). The strength of directional genic selection was quantified bys¼2Nes¼50, wheresis the se-lective coefficient between homozygotes, and the selected site was chosen to be in the middle of the 10-kb sequence.
Finite sites:Sequence data were simulated under a finite-sites model of sequence evolution with among-site rate variation for sequences of different lengths (2, 5, and 10 kb) and different values ofuper site (0.001, 0.005, 0.01, and 0.02). First, the ms program (Hudson2002) was used to simulate a treefile (con-sisting of a set of genealogies and branch lengths for different portions of the sequence) under the standard neutral model
withr of 1/kb and different sequence lengths. Then DNA sequence data were simulated on the basis of the treefile with the seq-gen program (Rambautand Grassly1997), under a symmetric biallelic mutation model. Data were simulated both with no rate variation (constant) and with strong rate variation among sites corresponding to the gamma distribution with shape parameter 0.5 (varying). The resultant sequence data were analyzed using the maxhap and Rholike methods. The speed of maxhap was sufficient to analyze all data sets in a reasonable time, even those with many sites (the 10-kb simulations withuof 0.02 had on average 782 sites). However, Rholike ran into numerical precision problems with large data sets, and we analyzed only data sets for which the mutation rate across the sequence was#25.
SNP ascertainment:The standard model describes sequence variation when segregating sites are identified by complete genotyping of random samples, but not when sites are se-quenced in new samples on the basis of polymorphism in pre-vious samples at those same sites. When additional genotyping is performed on the basis of previously identified polymor-phism the polymorpolymor-phism frequency spectrum is skewed to-ward alleles with intermediate frequencies. To investigate the effect of this bias on recombination rate estimation we sim-ulated data according to two SNP ascertainment schemes. In the first scheme (SNP ascertainment 1) we simulated 50 sam-ples of 10-kb sequences withranduof 1/kb, but then retained only those sites polymorphic in a subset of 2 samples (note the same 2 samples for all sites). In the second scheme (SNP ascertainment 2) we simulated 54 samples again withranduof 1/kb, which we divided into a panel of 4 samples and the simulation set of the remaining 50 samples. At each segregat-ing site 2 of the panel samples were chosen at random, and only if there was a polymorphism in the 2 panel samples was the site retained in the simulation set. For both SNP ascertainment schemes there was an additional requirement for at least eight SNPs in each data set.
Evaluation of recombination rate estimation methods:We used a variety of approaches for evaluating the performance of methods for inferring recombination rates. These approaches divide into two main groups depending on whetherris esti-mated by combining results across multiple data sets (typically 100 for each specific simulation model) or whether the var-iation inr-estimates among data sets is analyzed directly.
For each specific simulation model, all three recombination rate estimation methods generate a log-likelihood curve
lðr;DÞfor each data setD. Typically, the true value ofr,r0, will be known. Each data set generates an independent ML estimate ofr, and the accuracy of this collection ofrestimates can be measured by RMSE and by g, the proportion of es-timates within a certain factor ofr0(Wall2000).
Particularly when testing the robustness of the three approximate-likelihood methods to misspecification of the underlying model, it is useful to generate a single estimate ofr. Rather than use the mean or median of ther-estimates across data sets, both of which will be affected by the size of the data set analyzed, we summarized each method’s performance on the basis of an expected log-likelihood curve.
Consider a method which for a data setDproduces a log-likelihood curve lðr;DÞ. Then the expected log-likelihood curve is defined as
lðrÞ ¼Eðlðr;DÞÞ;
ofrwill be close to the position of the maximum of this curve (see Fearnhead2003).
For each specific simulation model we simulated (typically) 100 data sets, and for each approximate-likelihood method we estimated the expected log-likelihood curve by averaging the log-likelihood curves we got for each of the 100 data sets. We then calculatedr, the value of rfor which this sample average log-likelihood curve was maximum. Ifr0is the true value ofr then the value ofr=r0is a measure of robustness. Values close to 1 suggest that the approximate-likelihood method is robust to analyzing data under the model of interest. Values,1 and
.1 show that the approximate-likelihood method will tend to underestimate and overestimate recombination rates, respec-tively. The value of the ratio gives a measure of this, with, for example, values of 0.5 and 2.0 suggesting that the approximate-likelihood method will respectively underestimate and over-estimate the recombination rate by a factor of 2.
RESULTS
Performance of approximate-likelihood methods for data simulated under the standard assumptions:
We first consider the performance of the three different estimators of the recombination rate with data simu-lated under the assumptions that underpin the approx-imate methods: constant population size, panmixia, neutrality, and recombination modeled as a uniform rate of crossing over across different sizes of regions of interest. We further assume an infinite-sites mutation model, which is assumed by maxhap. Samples of 50 chro-mosomes were simulated for 2-, 10-, and 25-kb regions (we setu¼1/kb throughout) with differing strengths of recombination (see Table 1). For the 2- and 10-kb simulations withr¼1/kb 1000 data sets were generated; otherwise 100 data sets were generated. Likelihoods were evaluated over grids of typically 101 points, evenly spaced and ranging fromrnear 0 to twice the true value ofr,r0(2 kb,r¼16; 25 kb), or fives timesr0(the five other r and u combinations). Evaluating likelihoods over finite grids avoids the occasional estimation of infinite recombination rates.
Results in Table 1 are summaries of the accuracy of the maximum-likelihood estimates (MLEs) across indepen-dent data sets, based on theg(proportion of estimates within a certain factor of the truth) and RMSE statistics (see materials and methods). We considered the three approximate methods on their own, together with two extra estimators based on combinations of methods. We used two estimators based on averaging MLE esti-mates across methods [as suggested by C. Spencerand G. McVean(personal communication)] and an estimator based on the MLE from a composite log-likelihood curve, a weighted average of the approximate log-likelihood curves. The composite log-likelihood curve was obtained by weighting the maxhap log-likelihood values by 1/S, the inverse of the number of segregating sites; the other two log-likelihood values were unweighted. (We tested other weightings and also a composite likelihood us-ing only maxhap and sequenceLD, as suggested by Fearnhead and Donnelly2002; the results for these were qualitatively similar to those for the composite-likelihood method presented in Table 1).
First we consider the performance of the three in-dividual methods. For the small data sets of 2 kb with roughly nine sites on average sequenceLD appears to be most accurate; while Rholike has smaller RMSE for two of the scenarios this is due to the method tending to underestimate the recombination rate, by close to a factor of 2, in both situations (this bias disappears for ther¼16/kb scenario). The fact that sequenceLD per-forms well for small data sets is not surprising: for many of these data sets only a single subregion is required, in which case the estimates are close to the full-likelihood MLEs. For larger data sets Rholike appears to be the most accurate except for the 10-kb data set withr¼1
4=kb, where maxhap performs better. Relative to the other methods, the performance of maxhap deteriorates with increasingr.
Improvements over the individual methods can be obtained either by using the average of the MLEs or by
TABLE 1
Comparison of five estimators of the recombination rate
Maxhap SequenceLD Rholike Average Composite
kb r/kb RMSE g RMSE g RMSE g RMSE g RMSE g
2 1 1.70 0.39 1.41 0.38 1.26 0.29 1.26 0.43 1.31 0.38
2 4 1.43 0.57 1.29 0.62 1.20 0.44 1.15 0.66 1.18 0.64
2 16 0.68 0.60 0.60 0.70 0.66 0.59 0.60 0.74 0.61 0.70
10 1
4 0.81 0.64 1.02 0.43 1.05 0.56 0.79 0.64 0.93 0.59
10 1 0.58 0.86 0.57 0.80 0.47 0.90 0.50 0.89 0.45 0.91
10 4 0.37 0.93 0.32 0.95 0.23 0.98 0.25 1.00 0.25 0.99
25 1 0.36 0.73 0.33 0.71 0.31 0.85 0.28 0.82 0.27 0.86
using a composite likelihood of the three method’s like-lihood curves, although improvements appear marginal. Motivated by the thoeretical results for the approximate-likelihood methods calculated by maxhap (seematerials and methods), we considered a generalization of this composite likelihood where only the likelihood for pairs of sites within a fixed distance was included. This is a simple way of allowing the weights in Equation 2 to de-cay as the distance between sites increases. Results based on simulated data sets of 100 kb (u¼r¼100) are shown in Table 2. Including only pairs of sites within 10 kb of each other gives a statistically significant improvement in the performance of the estimate ofr.
Finally we examined the distribution of the likelihood-ratio statistics for each of the three methods (see Figure 1). As maxhap assumes that all pairs of sites are indepen-dent, in which case the information in the data would increase quadratically withSinstead of at best linearly withS, we scaled the likelihood-ratio statistics obtained by maxhap by 1/S. The distributions of the likelihood-ratio statistics appear to be roughly linearly related to a chi-square distribution with 1 d.f. (x2
1). The accuracy of the approximation of the distribution of the (scaled) likelihood-ratio statistic of maxhap by ax2
1 appears to improve for larger data and will produce conservative confidence intervals. No obvious improvement in such an approximation is observed for sequenceLD or
Rho-like, and each will produce slightly anticonservative confidence intervals. The theory of Fearnhead(2003) suggests that thex2
1-approximation for sequenceLD will get progressively worse for larger data sets.
Robustness to violations of the standard assump-tions:Table 3 gives the results of our measure of robust-ness for the three methods under various demographic and selective scenarios (seematerials and methods). These values are obtained from analyzing 100 10-kb data sets in each case (this measure depends on the data sets simulated, so approximate confidence intervals are also given). For the case of population growth and bottle-neck, the results are for estimating the ratior/u(since the expected value ofris not uniquely defined for these scenarios).
The striking result is that each scenario appears to af-fect the three methods in similar ways. Apart from pop-ulation growth, the effect of violations of the assumptions of the standard model is to cause underestimation ofr. We considered the possible use of two sequence data summary statistics, Tajima’sD(hereafterD) andFST, in reducing the bias due to violations of null demographic assumptions of constant population size and panmixia. Table 3 shows that negative Tajima’s D (population growth) leads to an overestimate of r, while positive Tajima’sD(bottleneck and population structure) leads to underestimates ofr, and bias inDcorresponds with bias in estimates ofr. On the other hand, bias inFSTdoes not correspond simply with bias in estimates of r: al-though the bias inris smallest for the model with the smallest FST, the model with the largest FST does not have the largest bias inr.
The covariation ofDand maxhap estimates ofris also found within the different demographic models (i.e., among data sets): all six demographic models show a negative relationship between the MLEs of r and D, although the Spearman rank correlation is significant only in two cases (growth and two islands with even
TABLE 2
Accuracy of estimates of the recombination rate (measured by root mean square relative error) based on the composite likelihood calculated by maxhap, but using only likelihoods from pairs of sites within a fixed distance from each other
All 50 kb 20 kb 10 kb 5 kb
RMSE 0.221 0.211 0.204 0.190 0.210
Results are based on simulate 100-kb data sets.
Figure 1.—QQ plots of the likelihood-ratio (LR) statistics of the three methods with ax2
sampling). However, even for these two demographic models only very slight improvements in robustness were obtained by the removal of data sets with significant
D-values (D significance tested using 5th and 95th percentiles of simulations under the standard model; for growth, the value ofr that maximized the average log-likelihood improved from 1.16 to 1.15; and for two islands with even sampling the value ofrimproved from 0.80 to 0.85).
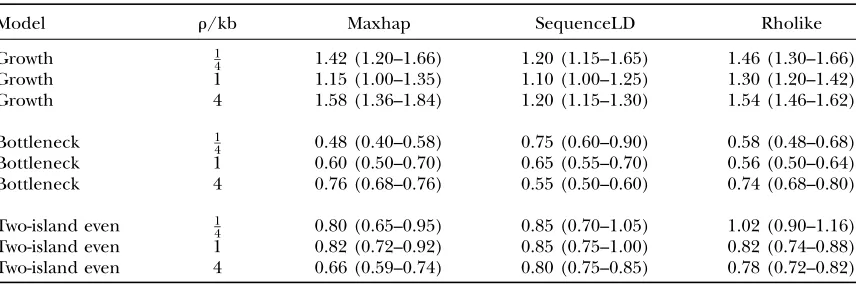
Although it is clear that violations of the assumptions underlying the three approximate methods do affect absolute estimates ofrandr/u, it is also important to investigate the effect on studies of variation in recom-bination rates (see Table 4), a focus of much present research. The bias due to growth does not appear to change with the amount of recombination, suggesting robustness at estimating relative recombination rates in different regions of the genome. For the case of pop-ulation bottleneck, increasing recombination rates ap-pears to slightly reduce the bias of maxhap and Rholike and to increase that of sequenceLD. For population
structure, the bias of maxhap and Rholike appears to be increased for the increasingr. However, even for these cases, results suggest that a fourfold increase inrwill be estimated (on average) as something between a three-fold and fivethree-fold increase.
In the case of maxhap intuition suggests that the length of the region analyzed will also affect the robust-ness of the estimator to population structure—as for such models linkage disequilibrium extends much fur-ther than that under a model that assumes random mating, and thus longer sequences should lead to greater biases. We thus tested both maxhap and Rholike for such an effect (as sequenceLD uses only information within small subregions, the length of the region ana-lyzed will have no effect on its robustness). We again considered just the two-island model with even sampling and simulated sequences of 10, 50, and 100 kb, withrat 4/kb and a constant total u of 10. For both methods there was a tendency for the bias to increase with sequence length (measure of bias for 10, 50, and 100 kb—maxhap, 0.65, 0.50, and 0.45; Rholike, 0.78, 0.75, and 0.65).
TABLE 3
Robustness of the three methods under various demographic and selective scenarios (seeMATERIALS AND METHODSfor full details)
Model D FST Maxhap SequenceLD Rholike
Growth 0.53 1.15 (1.00–1.35) 1.10 (1.00–1.25) 1.30 (1.20–1.42) Bottleneck 0.25 0.60 (0.50–0.70) 0.65 (0.55–0.70) 0.56 (0.50–0.64) Sweep –1.25 1.02 (0.78–1.32) 0.95 (0.80–1.10) 0.94 (0.84–1.06) Four-island even 0.14 0.19 0.85 (0.75–0.95) 0.80 (0.70–0.90) 0.88 (0.82–0.96) Four-island uneven 0.25 0.21 0.60 (0.50–0.70) 0.65 (0.55–0.75) 0.62 (0.56–0.68) Two-island even 0.19 0.22 0.82 (0.72–0.92) 0.85 (0.75–1.00) 0.82 (0.74–0.88) Two-island uneven 0.21 0.25 0.76 (0.68–0.86) 0.80 (0.80–0.95) 0.76 (0.70–0.84)
For each scenario and method the average log-likelihood curve across 100 10-kb data sets was calculated; the value given is the ratio of the value ofrthat maximizes this curve over the true value ofr0. This ratio gives the factor by which the estimator will tend to under- or overestimate the true recombination rate. A value of 1 shows that the method is robust; values of 2 or 0.5 would suggest that for large data sets the estimates will tend to be respectively twice or half the truth. In parentheses are95% confidence intervals based on the curvature of the expected log-likelihood curves. For each scenario the average values of Tajima’sDand (for the island models)FSTare given.
TABLE 4
The effect of the strength of recombination on the robustness of the methods for three different scenarios
Model r/kb Maxhap SequenceLD Rholike
Growth 1
4 1.42 (1.20–1.66) 1.20 (1.15–1.65) 1.46 (1.30–1.66) Growth 1 1.15 (1.00–1.35) 1.10 (1.00–1.25) 1.30 (1.20–1.42) Growth 4 1.58 (1.36–1.84) 1.20 (1.15–1.30) 1.54 (1.46–1.62)
Bottleneck 1
4 0.48 (0.40–0.58) 0.75 (0.60–0.90) 0.58 (0.48–0.68) Bottleneck 1 0.60 (0.50–0.70) 0.65 (0.55–0.70) 0.56 (0.50–0.64) Bottleneck 4 0.76 (0.68–0.76) 0.55 (0.50–0.60) 0.74 (0.68–0.80)
Two-island even 1
4 0.80 (0.65–0.95) 0.85 (0.70–1.05) 1.02 (0.90–1.16) Two-island even 1 0.82 (0.72–0.92) 0.85 (0.75–1.00) 0.82 (0.74–0.88) Two-island even 4 0.66 (0.59–0.74) 0.80 (0.75–0.85) 0.78 (0.72–0.82)
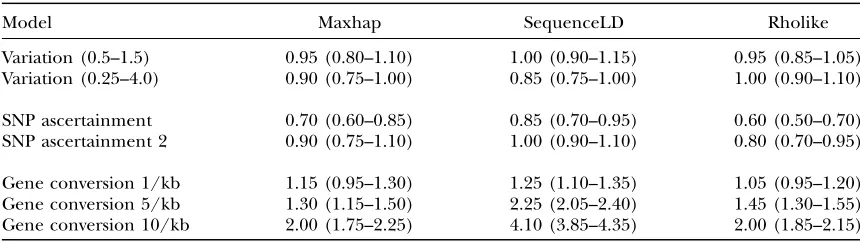
Table 5 shows how estimates of recombination rates are affected by three additional violations of the standard model. We considered the effect of weak variation in recombination rates across sequences, as opposed to the strong variation between background recombina-tion rates and recombinarecombina-tion hotspots, and found reasonable robustness for all three methods. We found that SNP ascertainment biases cause recombina-tion rates to be underestimated across all three meth-ods, in agreement with Nielsen and Signorovitch’s simulation results using Hudson’s (2001) method (Nielsenand Signorovitch2003). However, the level of bias was greatly reduced in the second SNP ascer-tainment scheme, which is probably more realistic in practice.
The simulations with both crossing over and gene con-version show that all three methods, run under the assumption that all recombination is due to crossing over, overestimate the total amount of recombination in the sequences (r0was calculated for the complete se-quence). The differences among the methods in their degrees of bias can be readily understood by consider-ing how they partition the sequence data. The effect of gene conversion on effective recombination rates is much greater at short distances than at long distances (see Frisse et al.2001, Equation 1). Gene conversion causes overestimation of recombination rates because the effect of one gene conversion event is equivalent to two crossing-over events close together. Thus sequen-ceLD, which considers small subregions of the sequence data 2 kb in size, is the most biased method. The pairwise approach of maxhap means a mixture of high bias from pairs of sites close together and low bias from pairs of sites far apart. Since the mean distance between all pairs of sites in a 10-kb sequence is4 kb, the bias for maxhap is much less than that for sequenceLD. Rholike considers all the data together, equivalent to weighting all pairs of sites equally as in maxhap, so the bias for Rholike and maxhap is similar. Despite being biased by gene conversion to different degrees, the inferred
recombination rates do scale reasonably well with the level of gene conversion for all three methods: in each case the estimate ofris1.00 plus some constant times the amount of gene conversion.
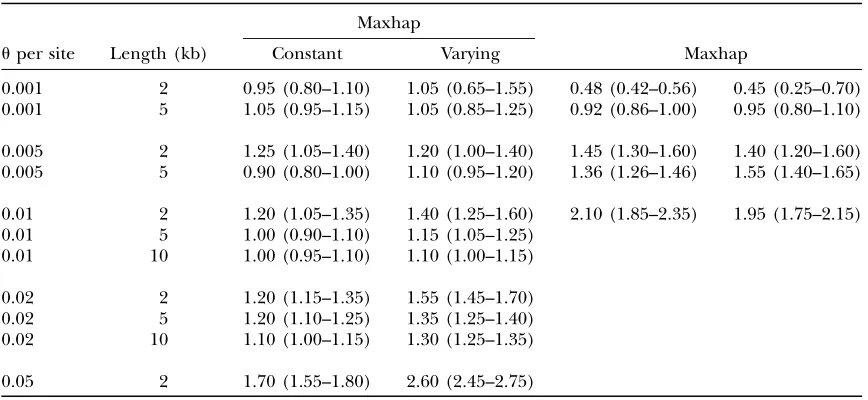
We examined the robustness of the maxhap and Rholike methods to violations of the infinite-sites muta-tion model. Sequence data were simulated under a finite-sites model with both constant and strongly varying rates among sites for a range of sequence lengths and u-values. For both levels of variation and for both methods, the general trends are as expected: recombi-nation rates are overestimated, and bias increases asu increases and as sequence length decreases. For largeu, biases are smaller for the constant mutation rate case. Finite-sites mutation models cause the overestimation of recombination rates because such models can gen-erate pairs of sites with all four haplotypes, a pattern that can be generated only by recombination under infinite-sites models. The higher the value of the mutation rate is, the more likely are such four-haplotype pairs. The effect of sequence length is due to the closer four-haplotype pairs having a greater effect on estimates of crossing over than the more distant four-haplotype pairs. Rholike is more biased than Maxhap for the situations where we were able to compare the two methods.
Finally we considered the accuracy of inferring recom-bination rates using genotypic data: 100 data sets of 50-haplotype samples of 10-kb sequences were simulated under the standard model withranduof 1/kb. Then the haplotypes were (randomly) combined to give 25 genotypes. These genotypic data were used to infer recombination rates directly using Hudson’s maxdip program (available at the same website as maxhap). The program PHASE (version 2.1, available at the same web-site as Rholike) was used to infer haplotypes (we took the ‘‘best guess’’ haplotypes in the nomenclature of the PHASE manual), as well as to provide a point ML esti-mate of recombination rates using the same methodol-ogy as that underlying Rholike. The inferred haplotypic data were then analyzed using the three programs
TABLE 5
Robustness of the three methods to variations in recombination rates, SNP ascertainment, and the presence of gene conversion
Model Maxhap SequenceLD Rholike
Variation (0.5–1.5) 0.95 (0.80–1.10) 1.00 (0.90–1.15) 0.95 (0.85–1.05) Variation (0.25–4.0) 0.90 (0.75–1.00) 0.85 (0.75–1.00) 1.00 (0.90–1.10)
SNP ascertainment 0.70 (0.60–0.85) 0.85 (0.70–0.95) 0.60 (0.50–0.70) SNP ascertainment 2 0.90 (0.75–1.10) 1.00 (0.90–1.10) 0.80 (0.70–0.95)
Gene conversion 1/kb 1.15 (0.95–1.30) 1.25 (1.10–1.35) 1.05 (0.95–1.20) Gene conversion 5/kb 1.30 (1.15–1.50) 2.25 (2.05–2.40) 1.45 (1.30–1.55) Gene conversion 10/kb 2.00 (1.75–2.25) 4.10 (3.85–4.35) 2.00 (1.85–2.15)
maxhap, sequenceLD, and Rholike. The values of r that maximized the average log-likelihoods for maxdip, maxhap, sequenceLD, and Rholike were all close tor0¼ 1.00 (1.05, 1.00, 1.00, and 1.05 respectively), while the mean of the PHASE estimates over the 100 data sets was 1.00. A more pertinent comparison is with regard to the accuracy of recombination rate estimation as measured using RMSE: maxdip, 0.65; maxhap, 0.58; sequenceLD, 0.50; Rholike, 0.54; and PHASE, 0.50. Comparison of these RMSE values with those in Table 1 shows that haplotypes are estimated very well by PHASE so that re-combination rates can be estimated well with all meth-ods. It is not surprising that the point estimates of PHASE have the lowest RMSE, since PHASE correctly allows for the uncertainty in the haplotypes. Another interesting result is that maxhap was more accurate than maxdip. S. E. Ptak, M. Przeworski, and R. Hudson (cited in Ptak et al. 2004) have suggested that using 25 genotypes should be better than using 25 haplotypes but worse than using 50 haplotypes, so if we can infer the 50 haplotypes well we do expect maxhap to do better than maxdip. One caveat to bear in mind is that haplotype reconstruction, just like recombination rate inference, is based on the standard model, so violations of the standard model would affect the performance of PHASE.
DISCUSSION
We have examined the performance of three approximate-likelihood estimators of the population-scaled recom-bination rate. We assessed the accuracy of the methods when sequence data were simulated according to the standard model (neutral coalescent, panmixia, constant population size, infinite sites, and recombination as crossing over) underlying the three methods (Table 1). Overall, it appeared that Rholike performed best, al-though the fact that Rholike tends to underestimate recombination rates when there are few sites and recom-bination rates are low does cause some concern with regard to its accuracy in measuring small-scale variation in recombination rates. However, given that low back-ground rates of recombination are thought to extend over long stretches between recombination hotspots (60 kb according to McVeanet al. 2004 and Crawford
et al.2004), this problem seems unlikely to apply to human data. Despite Rholike being slightly better than maxhap and sequenceLD, all three methods gave pretty similar levels of accuracy. Also there is little to be gained in attempting to combine methods, either through sim-ple averaging of results or through more sophisticated composite-log-likelihood methods.
In this article we focused on just three methods for estimating recombination rates from population data. Other methods summarize the data by such statistics as the number of haplotypes and the number of segre-gating sites and then perform likelihood inference for
this summary (e.g., the method of Wall 2000). Wall’s method has been shown to give performance similar to that of maxhap, albeit on the basis of a less extensive simulation study (Hudson2001).
Our comparison has focused on the accuracy of each method in estimating a constant recombination rate. Of much recent interest is estimating how recombination rates vary over small scales across the genome, and two methods have been developed for this problem, one im-plemented in LDhat, which is based on using a pairwise likelihood (like maxhap), and the other implemented in PHASE, which uses the same approximate likelihood as Rholike. While it is difficult to perform a detailed comparison of these two methods, we compared the performance of both LDhat and PHASE at estimating recombination rates from simulated 25-kb data sets that contained a central 2-kb ‘‘hotspot,’’ in whichrwas be-tween 20 and 30/kb,50 times the averagerof 0.4/kb in the remaining 23 kb of sequence (henceforth the
background rate). There is evidence from sperm studies ( Jeffreyset al.2001) that this simplistic scenario may be a reasonable model for human recombination rates.
To analyze data under a model of varying recombina-tion rate using either LDhat or PHASE requires the user to specify parameters that govern the amount of rate variation that is expected. We measured accuracy using
gfor both within and outside the hotspot. We defined
gas the proportion of positions along the sequence at which the estimate ofrwas within a factor of 2 of the truth. For a variety of settings of these parameters we found only small changes in the performance of each method, and so we report results based on settings sug-gested in published studies (McVean et al. 2004 and Crawfordet al. 2004) and program manuals. We found that LDhat was substantially more accurate at estimating the recombination rate within the hotspot (g¼0.45 as compared to 0.05) but less accurate at estimating the background rate (g¼0.5 as compared to 0.73).
rates suggest that a method based on the approximate-likelihood method of Li and Stephens (2003) that correctly modeled the spatial correlation in recombi-nation rates along a region of a chromosome could be the most accurate approach to estimating varying re-combination rates.
Given that real sequence data are likely to be affected by processes not incorporated into the standard model, we considered the robustness of the three methods to various violations of the standard model, first looking at selection and demography (Table 3). For many de-mographic models the effective population size is not uniquely defined, and so we used the ratio of recombina-tion rate to mutarecombina-tion rate, where mutarecombina-tion rate is esti-mated using the number of segregating sites (Watterson’s estimate of u). As such the results in Table 3 can be interpreted as describing the effect that a given de-mographic model has on estimates ofrrelative tou. An alternative approach is to look at estimates of the ratio of recombination rate to mutation rate, where mutation rate is estimated using the mean pairwise difference in chromosomes (this is equivalent to defining effective population sizes in terms of mean pairwise coalescent times). If such an approach is taken the effects on the results in Table 3 are small but would tend to lead to greater biases (overestimation ofr relative toudue to population growth would increase by 17%, and under-estimation due to population bottleneck would increase by 8%). We also measured the robustness of relative recombination rates (for example, If the true recombi-nation rate increases by a factor of 4, by what factor does the estimated recombination rate increase?—see Table 4). This measure has the advantage that the results are no longer confounded by the choice of estimatinguand is important for evaluating the potential robustness of methods that estimate varying recombination rates.
The most surprising finding was the close similarity of the three methods with regard to levels of bias. Although certain demographic scenarios, in particular population structure, do bias the recombination rate estimates, the levels of bias are not large compared to the unavoidable uncertainty in recombination rate in-ference. In addition, the level of bias measured as r overr0remains fairly constant as recombination rates increase (Table 4), indicating that even if absolute r-estimates may be unreliable at least relativer-estimates may be useful.
The directions of bias due to different demographic scenarios that we found in our simulations match well with studies relating demographic effects to expected levels of linkage disequilibrium (LD). We found that population growth causes overestimates ofr, consistent with the findings in McVean (2002) that population growth decreases LD below the level expected under the standard model. We found that population structure and bottlenecks cause underestimates of r, in agree-ment with Pritchard and Przeworski (2001) and
Wall and Pritchard (2003), who found such de-mographic effects to increase LD above the level expected under the standard neutral model. Thus our findings may help to explain the results of Ptaket al. (2004), who compared absolute recombination rates (c) based on sequence data and pedigree data for both African-American and European populations. For the African-Americanscbased on sequence data was higher thancbased on pedigree data, while for the Europeans the reverse was found. Such biases might be due to biases in recombination rate estimation if the demog-raphy of the African-Americans is dominated by pop-ulation growth while that of the Europeans is dominated by population structure and population bottlenecks.
We considered various techniques to improve the ac-curacy and robustness of recombination rate estimation. For maxhap we restricted analysis to pairs of sites within a certain threshold distance. As expected on the basis of theory, we found that for simulations of 100 kb androf 1/kb according to the standard model RMSE was mini-mized at an intermediate threshold distance of 10 kb (Table 2). This quantitative finding is related to the inves-tigation of Hudson(2001) into the asymptotic variance of maxhapr-estimates, where it was found that variance was minimized at a distance ofr ¼5. Thus keeping all pairs of sites withinr¼10 of each other is using the most informative pairs of sites to make inference.
Given that demographic effects can be identified through summary statistics we attempted to use Tajima’s
DandFSTvalues to improve robustness. Although there was some indication that such a strategy might work for
D, with data less biased inDbeing also less biased with regard tor-estimates, in practice very little improvement in robustness was achieved. In particular the strategy of testing for significant Tajima’s D values, and then as-suming the standard neutral model if Tajima’sDis not significant, provides negligible improvement in the robustness of the estimates forr.
and estimating recombination rates from different sequence lengths. It appears that robustness can be substantially improved by making the demographic model approximately correct.
We found that with recombination rates estimated under a crossing-over model the presence of gene con-version caused recombination rates to be overestimated, particularly over short distances (Table 5). Although gene conversion and crossing over can be estimated simultaneously in maxhap and related methods, simu-lation studies indicate that such approaches require huge amounts of sequence data for reliable inference (Wall2004).
We considered two alternative SNP ascertainment schemes and found large biases only for the more ex-treme scenario (Table 5). If the process of SNP ascer-tainment is known then it is possible and indeed highly desirable to incorporate the process into recombination rate estimation (Nielsen and Signorovitch 2003). The incorporation of SNP ascertainment modeling is easier for pairwise estimators like maxhap than for full-or approximate-likelihood functions based on multiple linked loci (such as Rholike and sequenceLD).
We also performed simulations with a finite-sites mutation model with both constant mutation rates and strong among-site rate variation (gamma distribution shape parameter 0.5) to determine the effects of this assumption (Table 6). Our results indicate that finite-sites effects, the occurrence of multiple mutations at the same site, can cause recombination rates to be greatly overestimated, particularly with short sequences, large mutation rates, and strong among-site variation. Al-though for human data, where u is of the order of
0.001/bp, assuming an infinite-sites mutation model appears to cause little bias.
Hudson’s (2001) method that is implemented in maxhap has been extended to include a finite-sites mu-tation model in the LDhat program of McVeanet al. (2001); and a finite-sites mutation model is already part of sequenceLD. However, both these extensions require the mutation rate at each segregating site to be known. So while they enable correct inference for finite-sites data with a constant mutation rate across sites, they will still have biases in the case of substantial mutation rate variation.
Finally we considered recombination rate estimation using genotypic data and found that haplotype recon-struction using PHASE was so good that accuracy was almost unchanged relative to haplotypic data. In partic-ular, first estimating haplotypes and then analyzing these with maxhap gave better estimates than using maxdip to analyze the genotype data.
We thank two anonymous referees for their comments and sug-gestions. This work was supported by Engineering and Physical Sci-ences Research Council grant GR/S18786/01.
LITERATURE CITED
Crawford, D. C., T. Bhangale, N. Li, G. Hellenthal, M. J. Rieder
et al., 2004 Evidence for substantial fine-scale variation in re-combination rates across the human genome. Nat. Genet.36:
700–706.
Fearnhead, P., 2003 Consistency of estimators of the
population-scaled recombination rate. Theor. Popul. Biol.64:67–79. Fearnhead, P., and P. Donnelly, 2001 Estimating recombination
rates from population genetic data. Genetics159:1299–1318. Fearnhead, P., and P. Donnelly, 2002 Approximate likelihood
methods for estimating local recombination rates (with discus-sion). J. R. Soc. Sci. Ser. B64:657–680.
TABLE 6
The effect of finite-sites mutation on maxhap and Rholike
Maxhap
uper site Length (kb) Constant Varying Maxhap
0.001 2 0.95 (0.80–1.10) 1.05 (0.65–1.55) 0.48 (0.42–0.56) 0.45 (0.25–0.70) 0.001 5 1.05 (0.95–1.15) 1.05 (0.85–1.25) 0.92 (0.86–1.00) 0.95 (0.80–1.10)
0.005 2 1.25 (1.05–1.40) 1.20 (1.00–1.40) 1.45 (1.30–1.60) 1.40 (1.20–1.60) 0.005 5 0.90 (0.80–1.00) 1.10 (0.95–1.20) 1.36 (1.26–1.46) 1.55 (1.40–1.65)
0.01 2 1.20 (1.05–1.35) 1.40 (1.25–1.60) 2.10 (1.85–2.35) 1.95 (1.75–2.15) 0.01 5 1.00 (0.90–1.10) 1.15 (1.05–1.25)
0.01 10 1.00 (0.95–1.10) 1.10 (1.00–1.15)
0.02 2 1.20 (1.15–1.35) 1.55 (1.45–1.70) 0.02 5 1.20 (1.10–1.25) 1.35 (1.25–1.40) 0.02 10 1.10 (1.00–1.15) 1.30 (1.25–1.35)
0.05 2 1.70 (1.55–1.80) 2.60 (2.45–2.75)
Fearnhead, P., R. M. Harding, J. A. Schneider, S. Myersand
P. Donnelly, 2004 Application of coalescent methods to reveal
fine-scale variation and recombination hotspots. Genetics167:
2067–2081.
Frisse, L., R. R. Hudson, A. Bartoszewicz, J. D. Wall, J. Donfack
et al., 2001 Gene conversion and different population histories may explain the contrast between polymorphism and linkage dis-equilibrium levels. Am. J. Hum. Genet.69:831–843.
Griffiths, R. C., and P. Marjoram, 1996 Ancestral inference from
samples of DNA sequences with recombination. J. Comput. Biol.
3:479–502.
Hudson, R. R., 2001 Two-locus sampling distributions and their
application. Genetics159:1805–1817.
Hudson, R. R., 2002 Generating samples under a Wright-Fisher
neutral model of genetic variation. Bioinformatics18:337–338. Hudson, R. R., M. Slatkinand W. P. Maddison, 1992 Estimation of
levels of gene flow from DNA sequence data. Genetics132:583–589. Jeffreys, A. J., and C. A. May, 2004 Intense and highly localized
gene conversion activity in human meiotic crossover hot spots. Nat. Genet.36:151–156.
Jeffreys, A. J., L. Kauppiand R. Neumann, 2001 Intensely punctate
meiotic recombination in the class II region of the major histo-compatibility complex. Nat. Genet.29:217–222.
Kuhner, M. K., J. Yamatoand J. Felsenstein, 2000 Maximum
likeli-hood estimation of recombination rates from population data. Genetics156:1393–1401.
Li, N., and M. Stephens, 2003 Modeling LD and identifying
recom-bination hotspots from SNP data. Genetics165:2213–2233. McVean, G. A. T., 2002 A genealogical interpretation of linkage
dis-equilibrium. Genetics162:987–991.
McVean, G. A. T., P. Awadallaand P. Fearnhead, 2002 A
coales-cent method for detecting recombination from gene sequences. Genetics160:1231–1241.
McVean, G. A. T., S. R. Myers, S. Hunt, P. Deloukas, D. R. Bentley
et al., 2004 The fine-scale structure of recombination rate vari-ation in the human genome. Science304:581–584.
Nielsen, R., and J. Signorovitch, 2003 Correcting for
ascertain-ment biases when analyzing SNP data: applications to the estimation of linkage disequilibrium. Theor. Popul. Biol. 63:
245–255.
Pritchard, J. K., and M. Przeworski, 2001 Linkage disequilibrium
in humans: models and data. Am. J. Hum. Genet.69:1–14. Ptak, S. E., K. Voelpeland M. Przeworski, 2004 Insights into
re-combination from patterns of linkage disequilibrium in humans. Genetics167:387–397.
Rambaut, A., and N. C. Grassly, 1997 Seq-Gen: an application for
the Monte Carlo simulation of DNA sequence evolution along phylogenetic trees. Comput. Appl. Biosci.13:235–238. Spencer, G. C. A., and G. Coop, 2004 SelSim: a program to simulate
population genetic data with natural selection and recombina-tion. Bioinformatics20:3673–3675.
Stephens, M., and P. Donnelly, 2003 A comparison of Bayesian
methods for haplotype reconstruction. Am. J. Hum. Genet.70:
1162–1169.
Stephens, M., N. J. Smithand P. Donnelly, 2001 A new statistical
method for haplotype reconstruction from population data. Am. J. Hum. Genet.68:978–989.
Stumpf, M. P. H., and G. A. T. McVean, 2003 Estimating
recombina-tion rates from popularecombina-tion-genetic data. Nat. Rev. Genet.4:959– 968.
Wall, J. D., 2000 A comparison of estimators of the population
re-combination rate. Mol. Biol. Evol.17:156–163.
Wall, J. D., 2004 Estimating recombination rates using three site
likelihoods. Genetics167:1461–1473.
Wall, J. D., and J. K. Pritchard, 2003 Haplotype blocks and LD in
the human genome. Nat. Rev. Genet.4:587–597.
Wall, J. D., and M. Przeworski, 2000 When did the human
popu-lation size start increasing? Genetics155:1865–1874.