DOI: 10.1534/genetics.106.068874
An Exact Nonparametric Method for Inferring Mosaic Structure
in Sequence Triplets
Maciej F. Boni,*
,†,1David Posada
‡and Marcus W. Feldman
†*Stanford Genome Technology Center, Palo Alto, California 94304,†Department of Biological Sciences, Stanford University, Stanford, California 94305 and‡Department of Biochemistry, Genetics and Immunology, University of Vigo, Vigo 36310, Spain
Manuscript received November 27, 2006 Accepted for publication March 18, 2007
ABSTRACT
Statistical tests for detecting mosaic structure or recombination among nucleotide sequences usually rely on identifying a pattern or a signal that would be unlikely to appear under clonal reproduction. Dozens of such tests have been described, but many are hampered by long running times, confounding of selection and recombination, and/or inability to isolate the mosaic-producing event. We introduce a test that is exact, nonparametric, rapidly computable, free of the infinite-sites assumption, able to distinguish between recombination and variation in mutation/fixation rates, and able to identify the breakpoints and sequences involved in the mosaic-producing event. Our test considers three sequences at a time: two par-ent sequences that may have recombined, with one or two breakpoints, to form the third sequence (the child sequence). Excess similarity of the child sequence to a candidate recombinant of the parents is a sign of recombination; we take the maximum value of this excess similarity as our test statisticDm,n,b. We present a method for rapidly calculating the distribution ofDm,n,band demonstrate that it has comparable power to and a much improved running time over previous methods, especially in detecting recombina-tion in large data sets.
M
OSAIC structure exists in a nucleotide sequenceif different segments of the sequence descend from different ancestors. A nucleotide sequence can be a mosaic of other sequences as a result of recombina-tion or gene conversion; mosaic structure in bacterial DNA can also result from transduction, transformation, or conjugation, which are collectively referred to as hor-izontal gene transfer. The detection of mosaic structure has received much attention over the past two decades as a result of both a proliferation of sequence data and leaps in computing power, which together have allowed for the inference of multiple ancestral contributions to a nucleotide sequence. The biological questions at the source of this recent attention range from interest in
the evolution of pathogens (Awadalla 2003; Moya
et al.2004; Wilsonet al.2005) and the characterization of linkage disequilibrium in large genomes (Pritchard and Przeworski2001; Ardlieet al.2002; Gabrielet al. 2002) to theoretical questions about clonality and the definitions of clonal and nearly clonal organisms (MaynardSmithet al.1993; Halkettet al.2005). For reviews on the methods and results in this field, see Posadaet al.(2002) and Stumpfand McVean(2003). MaynardSmith(1999) recognized that the contin-uum between completely clonal and freely recombining organisms naturally gives rise to two distinct problems:
determining whether recombination occurs and mea-suring its frequency. In this investigation, we focus on the former. Detecting recombination usually involves searching groups of sequences for candidate recombi-nants or recombination signals and testing whether these represent statistically significant departures from expectation under a null hypothesis of no recombina-tion. Dozens of statistical tests have been developed (Stephens 1985; Sawyer 1989; Balding et al. 1992; Karlin and Brendel 1992; Maynard Smith 1992; Takahata 1994; Sneath 1995; Goss and Lewontin 1996; Jakobsenand Easteal1996; Grasslyand Holmes 1997; MaynardSmithand Smith1998; Sneath1998; Awadallaet al.1999; Crandalland Templeton1999; Holmeset al.1999; MaynardSmith1999; Wall1999; Gibbset al.2000; Martinand Rybicki2000; Worobey 2001; Bruen et al. 2006) and evaluated (Wall 2000; Brownet al.2001; Posadaand Crandall2001; Wiuf et al. 2001; Posada 2002) in this endeavor, none of which has yet emerged as the single standard test to be used for identifying recombination. In addition to testing for the existence of recombination, certain methods are also able to locate recombination break-points and, sometimes, the parent sequences involved in the recombination event, although the latter can be quite difficult. Methods that do not focus on parent sequences and breakpoints usually rely on detecting a recombination signal—for example, a phylogenetic incongruence or an excess of homoplasies—but may have trouble isolating the actual recombination event, 1Corresponding author: Stanford Genome Technology Center, 855
S. California Ave., Palo Alto, CA 94304. E-mail: [email protected]
which entails identifying particular parent sequences that recombined at particular breakpoints to form a recombinant offspring sequence.
Some methods (Takahata 1994; Robertson et al.
1995; Crandall and Templeton 1999; Holmes et al. 1999; Gibbs et al. 2000; Martin and Rybicki 2000; Martinet al.2005) perform tests on three sequences at a time, which allows them to posit candidate parent sequences and candidate breakpoints. The proposed arrangement is then tested with a likelihood analysis, by visual detection of similarity in different sequence regions, or against a null distribution that would be ex-pected under clonal evolution. The most common among
these triplet tests—the Chimaera method (Posada
and Crandall2001; Posada2002), which is based on ax2-statistic (MaynardSmith1992), and the Martin– Rybicki (MR) binomial distribution test (Martinand Rybicki 2000)—identify unusually high levels of se-quence similarity inside a predefined window or on either side of a candidate breakpoint. We also take this approach by introducing a simple and intuitive statistic describing how identity varies along a sequence within a sequence triple. Our test statisticDm,n,bis discrete and
nonparametric. Describing its distribution, in principle, would require a computing time that grows exponentially with the number of informative sites (a subset of the poly-morphisms) in the given sequence triple; to avoid this costly brute-force computation, we introduce a method for computing probabilities andP-values in polynomial time. Our method is memory intensive but very fast: computation of exactP-values takes seconds on a per-sonal computer when there are,250 informative sites in the proposed sequence triple.
Our triplet test represents an advance over Chimaera and the MR method in that we eliminate the need for a sliding window, use a nonparametric statistic, and in-troduce a computation scheme that is exact and orders of magnitude faster. In evaluating our method’s power to detect recombination in sequence triplets, we find that we always have higher power than the MR method and comparable power to Chimaera. In repeated appli-cations of our triplet test to data sets with more than three sequences, we show that our method is among the most powerful of 16 previously tested methods.
STATISTICAL TESTS
We begin with three homologous sequences of the same length. The relationship among these three se-quences is similar in practice to the relationship formu-lated by Crandalland Templeton(1999, pp. 166–167) among networks of sequences. From our three sequen-ces, we designate one as the child sequence and inves-tigate whether it could be a recombinant of the other two sequences, which we call parent sequences. We first present the simple case of a single-breakpoint recombi-nant but later focus on the more interesting and realistic
case of a double-breakpoint recombinant. Considering our sequence triple, we ask whether one can reject the null hypothesis that the evolutionary history among the three sequences was completely clonal.
We call our parent sequencespandqand our child sequence c. For sequence lengthL, we can represent our three sequences as vectors of nucleotides:p¼(p1,
p2,. . .,pL),q¼(q1,q2,. . .,qL), andc¼(c1,c2,. . .,cL).
A single-breakpoint recombinant between the parent sequences at positionlcan be denoted
ðpqÞl¼ ðp1;. . .;pl;ql11;. . .;qLÞ;
with 0#l#L.
Writingjp qjas the number of nucleotide differ-ences between sequdiffer-encespandq, we say that the most likely recombination breakpointlminimizesj(pq)lcj,
the number of differences between the observed child sequence and a possible recombinant of the parent se-quences. If this candidate recombinant is much closer (than either parent) to the child sequence, then we may have reason to believe that the evolutionary history of sequencecis better explained by a recombination or a gene conversion than by strictly clonal reproduction. If the candidate recombinant (pq)lis only slightly closer
than the parents to the child sequence, then the can-didate recombinant’s additional sequence similarity may simply be an accident of how mutations accumulated on either side of the breakpointl. Assessing whether the locations of the mutations (relative to the breakpoint) are significantly nonrandom is the foundation for the maximumx2-test (MaynardSmith1992), the Chimaera
method (Posadaand Crandall 2001; Posada2002),
the exact test based on the binomial distribution sug-gested by Martinand Rybicki(2000), and the heuristic test suggested by Crandalland Templeton(1999); it is also the focus of our analysis.
We introduce a nonparametric statistic slightly differ-ent from the ones above, but one that is more direct at detecting potential mosaics. Let
dNoRec¼minfjpcj;jqcjg ð1Þ
be the minimum distance from the child to either of the parents, and let
dRec;1¼ min
0#l#LfjðpqÞlcjg ð2Þ
be the minimum distance from the child to a candidate recombinant of the parents (including the boundary case recombinants, which are just the parents them-selves); the subscript ‘‘1’’ indicates that there is just one breakpoint in the recombinant. Then, we define
D1¼dNoRecdRec;1: ð3Þ
The quantity D1 describes the difference, between
history between the child and the closer parent; by nonclonal evolution we mean, here, an evolutionary his-tory that allows for a single recombination event with a single breakpoint. ClearlyD1$0, and even if there had truly been no recombination or gene conversion among the sequences, a particular sequence triple could give the appearance of recombination with a high value ofD1if, by chance, the pattern of mutations was such that the left side of the child sequence appeared to be more closely related to parentpand the right side appeared to be closer to parentq. The distribution of this recombi-nation signal D1 under the null hypothesis of clonal reproduction can be easily computed (see next section). The difference in (3) is affected only by informative sites of the sequence triple (p,q,c). For our purposes, we define informative sites as those where the child’s nucleotide matches exactly one of the parents’ nucleo-tides. Uninformative sites are sites where (i) all three sequences agree, (ii) all three sequences differ, or (iii) the parents have matching (i.e., identical) nucleotides that differ from the child’s. Our definition of informa-tive sites is identical to that used in the Chimaera method and to the sister groups defined by Takahata(1994).
Suppose that there arem informative sites wherep
and c match and n informative sites where q and c
match. The quantity D1 in (3) is then more precisely defined asDm,n,1. Under the null hypothesis of clonal evolution among sequences p, q, and c, Dm,n,1 is a random variable that describes the maximum number of mutation events one could ‘‘explain away’’ by recom-biningpwithqat a single breakpoint.
A two-breakpoint recombinant of sequencespandq
can be described by
ðpqpÞij ¼ ðp1;. . .;pi;qi11;. . .;qj;pj11;. . .;pLÞ;
wherei#j. Letting
dRec;2¼ min
0#i#j#LfjðpqpÞijcjg; ð4Þ
we define
Dm;n;2¼dNoRecdRec;2; ð5Þ
wheremandnare again the numbers of the two types of informative sites.
Dm,n,1andDm,n,2are random variables that describe single-breakpoint and double-breakpoint recombina-tion signals, respectively, under the null hypothesis of no recombination. They are discrete random variables with range 0# Dm,n,b#min {m,n}, wherebis the number
of breakpoints. Observed D-quantities can be quickly calculated [inOðLÞ-time, for anyb] from sequence data, and the null hypothesis of clonal evolution can be rejected if they are too high. In the next two sections, we review what is already known about the distribution of Dm,n,1and present a method for calculating the distri-bution ofDm,n,2.
Single-breakpoint recombinant:Consider a sequence triple (p,q,c) withminformative sites wherepandc
match and n informative sites where q and c match.
Moving left to right across the informative sites on the child sequence, we can assign each informative site a letter based on probable ancestry (determined by the parent to which it is identical) and obtain a sequence such as PPPQPPPQQQQ, where a P denotes an in-formative site at which the child sequence and parent
pshare a nucleotide, and Q denotes an informative site at which the child sequence and parentq share a nu-cleotide. Under the null hypothesis of clonal reproduc-tion, the placement of P’s and Q’s in the sequence should be completely random; i.e., each of the (m 1
n)!/(m!n!) possibilities has equal probability. In the example sequence above, it appears that the P’s cluster toward the left side of the sequence and the Q’s to the right side; therefore, this sequence may be a true (sta-tistically significant) recombinant.
This sequence of P’s and Q’s is most easily visualized as a random walk on a set of axes where P is a step up and Q is a step down. This is not a traditional random walk since the number of up steps is known to be m, the number of down steps is known to ben, and the only randomness is the order in which they appear. After s steps, the height Xsof the random walk is distributed
quasi-hypergeometrically [the quantity (Xs 1 s)/2 is
distributed hypergeometrically]. The probability of being at heighthafterssteps, whenjhj#sand 0#s# m1n, is
PðXs¼hÞ ¼
m s1h
2
! n
sh 2
!
m1n s
1
ifh1sis even;P(Xs¼h)¼0 ifh1sis odd. This type of
finite stochastic process can be called a hypergeometric random walk (HGRW). HGRWs have been previously analyzed in the probability literature in the form of ballot problems (Feller1957), wherein one candidate in an election receives m votes, the second candidate receives n votes, and the order in which the votes are counted is of interest. We denote a hypergeometric random walk withmup steps andndown steps by the random variable Hm,n. Given data, we refer to an
ob-served walk diagrammed from the informative sites of a sequence triple; examples of observed walks dia-grammed from real data are in Figure 1.
Given our sequence triple withm1ninformative sites and allowing only one breakpoint in a putative re-combinant, the observed value Dm,n,1is related to the maximum height of the walk diagrammed from the informative sites of sequencesp,q, andc, by the relation
Dm;n;1 ¼maxHm;n1minf0;nmg:
Using results from ballot theory (Bartonand Mallows
1965) and gambling problems (Whitworth 1901,
PðDm;n;1$kÞ ¼
m1n n1k
m1n n
whenm#n
m1n m1k
m1n n
whenm.n ;
8 > > > < > > > :
ð6Þ
or equivalently that
PðmaxHm;n$kÞ ¼ m 1n n1k
m1n n
: ð7Þ
From the observed maximum height of the dia-grammed walk of the informative sites of a sequence triple, the null hypothesis of clonal reproduction can be
rejected at the levelP as calculated in (6) or (7). This is implicitly a one-tailed test with rejection of the null hypothesis of clonal evolution when the observedDm,n,1 (or the maximum height of the observed walk) is large relative to mand n. An HGRW with a statistically im-probable maximum height will have its up steps clus-tered toward the beginning (left side) of the walk and its down steps clustered toward the end (right side) of the walk. This is precisely a mosaic pattern in a nucleotide sequence: a child sequence having ancestry inpin the left-hand side of its sequence and ancestry inq in the right-hand side of its sequence.
Double-breakpoint recombinant:Identifying mosaics with two breakpoints is the more relevant and interest-ing problem since in long sequence regions, converted tracts of DNA or horizontally transferred segments will usually have both breakpoints present. Identification of two breakpoints also allows for the removal of the hor-izontally acquired segment; the remaining segment(s) can then be tested again for clonal evolution, and multi-breakpoint mosaics could be inferred by repeating such a process. Note that the two-breakpoint case subsumes the one-breakpoint case since a one-breakpoint recom-binant can be viewed as having two breakpoints where one breakpoint is on the end of the sequence.
Again, considering only the informative sites of the se-quence triple (p,q,c) and viewing their ordering in the context of a hypergeometric random walk, the quantity Dm,n,2 can be calculated by identifying the maximum
descent(md) of the walk constructed from the arrange-ment of informative sites. Letting Xs be the height of
Hm,nat steps, the maximum descent is defined as
mdHm;n ¼ max
0#s#t#m1nðXsXtÞ;
and it can be shown that
PðDm;n;2¼kÞ ¼
PðmdHm;n¼kÞ whenm$n
PðmdHm;n¼k1nmÞ whenm,n
:
Statistical theory underlying a general class of statistics based on partial sum processes (Siegmund1988; Karlin et al.1990), change-point problems (Siegmund1986),
and maximal segmental sums (Karlin and Dembo
1992) provides asymptotic approximations that could be applied to calculate the probability that mdHm,nis
large relative tomandn. Notably, Lemmas 3 and 4 in Siegmund(1988) and Theorems 2 and 3 in Hoganand Siegmund(1986) contain the appropriate constructions to approximate probabilities of maximum descents in HGRWs. In the theory on ballot problems, the maximum descent of an HGRW represents the maximum lead change (in one direction only) when counting ballots in a two-candidate election; as far as we are aware, this distribution has not been calculated with the combina-torial methods and reflection techniques usually applied
Figure1.—Observed walks diagrammed from the
in ballot problems. Below, we provide a method for cal-culating this distribution exactly.
We use the shorthandxm,n,k¼P(mdHm,n¼k), and for
j,k$0, we define
ym;n;k;j¼PðmdHm;n ¼k\minHm;n¼ jÞ:
Then,
xm;n;k¼ Xk
j¼0
ym;n;k;j; ð8Þ
and the y-probabilities can be obtained by solving the recursions
j¼0: ym;n;k;0¼
m m1n
½ym1;n;k;11ym1;n;k;0 ð9Þ
j.k$0: ym;n;k;j ¼0 ð10Þ
j¼k.0: ym;n;j;j¼
n m1n
½ym;n1;j1;j11ym;n1;j;j1 ð11Þ
k.j.0: ym;n;k;j¼
m m1n
ym1;n;k;j111 n m1n
ym;n1;k;j1;
ð12Þ
with boundary conditions
ym;0;k;j ¼
1 fork¼j¼0
0 otherwise
ð13Þ
y0;n;k;j ¼ 1 fork¼j¼n
0 otherwise
ð14Þ
ym;n;0;0 ¼
1 forn¼0
0 otherwise
ð15Þ
ym;n;k;j ¼0 whenk.nork,nm ð16Þ
ym;n;k;j ¼0 whenj.norj,nm: ð17Þ
All of the above recursions can be proved with a simple but careful first-step analysis of the random walk Hm,n.
Below, the random variablesHm1,nandHm,n1refer to the subwalk ofHm,nthat starts after the first step ofHm,n.
As an example, recursion (11) can be proved by not-ing that the event {mdHm,n¼j\minHm,n¼ j} implies
that the first step ofHm,nmust be down (X1¼ 1) and that mdHm,n1must be eitherjorj1. Thus,
PðmdHm;n¼j\minHm;n¼ jÞ
¼PðmdHm;n ¼j\minHm;n¼ j
\X1¼ 1\mdHm;n1 ¼jÞ
1PðmdHm;n¼j\minHm;n¼ j
\X1¼ 1\mdHm;n1 ¼j1Þ: ð18Þ
In both summands of the right-hand side of (18), the last three events imply the first. We can rewrite the right-hand side of (18) as
PðminHm;n¼ j\X1¼ 1\mdHm;n1¼jÞ
1PðminHm;n¼ j\X1¼ 1\mdHm;n1¼j1Þ: ð19Þ
The events
fminHm;n¼ j\X1¼ 1g
[fminHm;n1¼ ðj1Þ \X1¼ 1g ð20Þ
are identical; one occurs if and only if the other occurs. Using this identity, we substitute into (19) and obtain
PðminHm;n1¼ ðj1Þ \X1¼ 1\mdHm;n1¼jÞ
1PðminHm;n1¼ ðj1Þ \X1¼ 1\mdHm;n1¼j1Þ: ð21Þ
By independence of the first step X1 ¼ 1 from the subwalkHm,n1, this becomes
PðX1¼ 1Þ PðminHm;n1¼ ðj1Þ \mdHm;n1¼jÞ
1PðX1¼ 1Þ PðminHm;n1¼ ðj1Þ \mdHm;n1¼j1Þ; ð22Þ
which is
n m1n
½ym;n1;j;j11ym;n1;j1;j1:
The other recursions can be proven similarly, and the boundary cases (13)–(17) are easily verifiable.
The computation time for any ym,n,k,j is bounded
above bymn3, which is the maximum table size required in memory to solve recursions (9)–(12);k11y-values must be computed to calculatexm,n,kvia Equation 8. On
a single 3-GHz processor with access to 2 GB RAM, the worst-case x-calculations for 250 informative sites take
,3 sec; mostx-probabilities can be calculated in,1 min for up to 400 informative sites. All calculations pre-sented in this article (except where noted) were done on a 3.2-GHz Linux laptop with 1 GB of RAM and 750 MB of virtual memory. C11source code for calculating thex- andy-variables is available from the authors.
For a given sequence triple in which we observe a Dm,n,2¼k, with aP-value of
Pn
j¼kxm;n;jwe can reject the
null hypothesis of completely clonal reproduction in favor of an evolutionary history that includes a two-breakpoint recombination event.
APPLICATIONS
Neisseria: We considered a classic example from the genus Neisseria and applied our tests to itsargFgene, which is widely believed to have mosaic structure as a result of horizontal gene transfer among different spe-cies (Zhou and Spratt 1992; Grassly and Holmes 1997; Husmeierand McGuire2003). Zhouand Spratt (1992)foundregions ofclusteredpolymorphism ina com-parison between theargFgenes of aNeisseria meningitidis isolate and aN. gonorrhoeaeisolate and deduced that this region of clustered polymorphisms had likely ancestry in the speciesN. cinerea(sinceN. meningitidisandN. cinerea were nearly identical in this region). The authors noted that there were two regions inN. meningitidisthat could have arisen by horizontal gene transfer, one of which might have been the result of variation in mutation rates or fixation rates (usually called ‘‘rate variation’’). Further
studies (Grassly and Holmes 1997; Husmeier and
McGuire 2003) suggested that additional regions in theargFgene may have arisen by recombination.
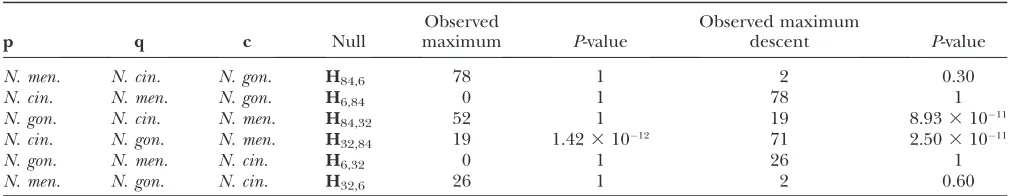
We used three of the Neisseria sequences, one of each species, from the studies mentioned above (GenBank accession nos. X64860, X64866, and X64869; 787 nt in length) and tested whether there is any parent–parent– child relationship among them that lends support to one sequence being a mosaic of the other two. Table 1 shows that of the six possible arrangements, one has a highly significant (P¼1012) single-breakpoint recom-bination signal, while the other five have none. This oc-curs because the first 202 nucleotides ofN. meningitidis cluster significantly with N. cinerea (3.5% divergent, while N. meningitidis and N. gonorrhoeae are 13% di-vergent in this region) and the final 585 nucleotides of N. meningitidis cluster significantly with N. gonorrhoeae (2.9% divergent, whileN. meningitidisandN. cinereaare 15% divergent in this region). This indicates that the first 202 nucleotides of N. meningitidis have probable ancestry inN. cinereawhile the final 585 nucleotides of N. meningitidishave probable ancestry inN. gonorrhoeae, a
view that is supported by the last two columns of Table 1, which allow for two breakpoints in the child sequence’s composition but support a mosaic structure almost iden-tical to the one-breakpoint case.
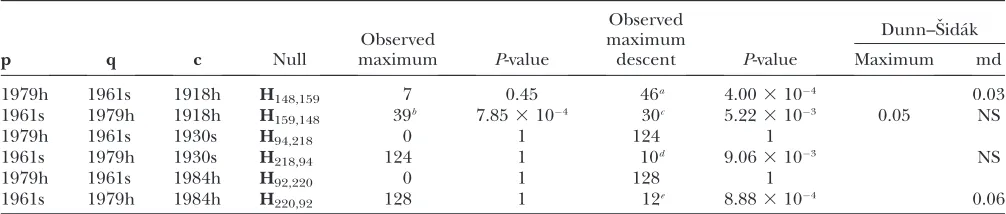
Influenza A: Gibbs et al.(2001) found evidence for recombination in the hemagglutinin gene of the 1918 ‘‘Spanish’’ influenza strain, but their results were later refuted by Worobeyet al.(2002) and Strimmeret al. (2003). We reanalyzed the five sequences presented by Gibbs that were the candidate recombiners and recom-binants: two swine sequences (A/swine/Iowa/15/30 and A/swine/Wisconsin/1/61) and three human sequen-ces (A/South Carolina/1/18, A/Kiev/59/79, and A/ Alma Ata/1417/84), where the last two numbers in the sequence names indicate the year the sequence was iso-lated. In Table 2 we show the results obtained using our D-method on the significant relationships presented in Figure 1 of Gibbset al.(2001).
With any type of analysis, detecting recombination in ancient influenza sequences is a challenge because of the high mutation rates in RNA viruses. A recombination that occurred 90 years ago would have its recombination signal obscured by mutations that accumulated after the recombination event. The relationship specified by the first two rows in Table 2, for example, requires a mini-mum of 104 years of evolution after the posited recom-bination event (61 years between the South Carolina and the Kiev strains and 43 years between the South Carolina and Wisconsin strains). Our five influenza se-quences are on average 10% divergent (range: 2.4– 18.3%), which means that detecting recombination events should be easy if the events were recent but difficult if they were ancient. On the timescale of influenza evolu-tion, the hypothesized recombination events in Table 2 would be quite ancient.
Nevertheless, our method does detect weak recombi-nation signals in the 1918 and 1984 human influenza strains. It is important to note that we are performing TABLE 1
Mosaic structure in NeisseriaargFgene
p q c Null
Observed
maximum P-value
Observed maximum
descent P-value
N. men. N. cin. N. gon. H84,6 78 1 2 0.30
N. cin. N. men. N. gon. H6,84 0 1 78 1
N. gon. N. cin. N. men. H84,32 52 1 19 8.9331011
N. cin. N. gon. N. men. H32,84 19 1.4231012 71 2.5031011
N. gon. N. men. N. cin. H6,32 0 1 26 1
N. men. N. gon. N. cin. H32,6 26 1 2 0.60
post hoctests on previously analyzed sequences for which Gibbset al. (2001) obtained statistically significant re-combination signals. Given these same five sequences without anya prioriknowledge about their relationships, we might computeP-values for all 60 possible parent– parent–child relationships among these sequences. The last two columns of Table 2 show which of these com-parisons would still be significant after a Dunn–Sˇida´k correction for 60 comparisons. The Dunn–Sˇida´k cor-rection is, of course, extremely conservative, especially since theD-values from our comparisons are positively correlated. A more accurate correction for multiple com-parisons would take into account that we have multiple significant results. Using an exact binomial test, the probability under H0that$3 of 60 comparisons would be significant at the 103level isP¼3.33105. To be slightly more conservative, we could say that the two P-values in rows 1 and 2 of Table 2 that are,103are in fact manifestations of the same arrangement of strains (Kiev, Wisconsin, and South Carolina); then, the prob-ability that$2 of 60 comparisons would be significant at the 103level isP¼1.73103.
Although it has been long believed that intragenic (homologous) recombination does not occur in influ-enza (Kilbourne1978), the occurrence of nonhomol-ogous recombination (Khatchikianet al.1989; Orlich et al.1994; Suarezet al.2004) together with the data pre-sented by Gibbs suggests that homologous recombina-tion in influenza may be possible. However, as pointed out by Worobeyet al.(2002), the observed substitution
pattern in the influenza hemagglutinin can also be explained by within-sequence rate variation that varies across the different branches of the phylogeny (lineage-specific rate variation). Using pairwise comparisons among human sequences of the influenza A hem-agglutinin, Worobey et al. described the HA1 region (nucleotide sites 151–920) as evolving more quickly than the HA2 region (sites 1–150 and 921–1695) in humans. If the opposite can be shown to be true for swine hem-agglutinin sequences—that the HA2 evolves more quickly than the HA1—then the detected mosaicism in the 1918 human influenza hemagglutinin would be best explained by lineage-specific rate variation. This type of rate var-iation has also been called heterotachy (Lopez et al. 2002), and it was first introduced in the context of a changing set of concomitantly variable codons by Fitch and Markowitz(1970). It has been suggested that, for influenza A viruses, heterotachous or lineage-specific rate variation is a more likely evolutionary history than an intragenic recombination event (E. C. Holmes, per-sonal communication).
SIMULATIONS
In addition to ourD-method’s theoretical appeal of being exact and nonparametric we show that it has the practical advantages of speed, power, and a low false-positive rate.
Power and false positives: We compared the power and false-positive rates of ourD-method to the 14 methods TABLE 2
Mosaic structure in influenza A hemagglutinin gene
Observed maximum
Observed maximum descent
Dunn–Sˇida´k
p q c Null P-value P-value Maximum md
1979h 1961s 1918h H148,159 7 0.45 46a 4.003104 0.03
1961s 1979h 1918h H159,148 39b 7.853104 30c 5.223103 0.05 NS
1979h 1961s 1930s H94,218 0 1 124 1
1961s 1979h 1930s H218,94 124 1 10d 9.063103 NS
1979h 1961s 1984h H92,220 0 1 128 1
1961s 1979h 1984h H220,92 128 1 12e 8.883104 0.06
The first three columns refer to the five influenza sequences mentioned in theInfluenza Asection. Here, the sequences are referred to by year and whether the sequence is human (h) or swine (s). The last two columns show the Dunn–Sˇida´k corrected P-values given that without any knowledge about which sequences are recombinant, 60 comparisons would have to be made to test all parent–parent–child combinations. The breakpoint descriptions listed in footnotesa–erefer to a gapped alignment of length 1778 nt; 80 positions are gapped.
aThere are 90 pairs of breakpoints that result in a maximum descent of 46 units in the diagrammed walk from these three sequences. The first breakpoint is in position 242–247, while the second one is in 953–955/971–982.
bThe maximum height of 39 for this triple can be attained by 15 different breakpoints, at positions 952–954/970–981. cThere are 30 pairs of breakpoints that result in a maximum descent of 30 for this sequence triple. The first breakpoint is in position 953–955/971–982; the second breakpoint is either in position 1653 or in position 1654.
d
There are 45 pairs of breakpoints that result in a maximum descent of 10 for this sequence triple. The first breakpoint is in position 953–955/971–982; the second breakpoint is in position 1049–1051.
e
evaluated in Posada and Crandall (2001). Figure 2 duplicates the conditions of Figure 1 in Posada and Crandall(2001); in addition, two of the methods de-scribed by Carvajal-Rodrı´guez et al. (2006) are in-cluded in the top two rows of comparisons in Figure 2. Power and false-positive rates are tested for different values of the population-genetic parameteru¼4NemL, whereNeis the effective population size,mis the per site per generation mutation rate, andL is the sequence length. Power is tested across different values of the re-combination parameterr¼4NerL, whereris the per site per generation recombination rate. False-positive rates are tested for different levelsaof rate variation (ais the shape parameter of a fixed-meanG-distribution of evo-lutionary rates as in Yang1996) since, as noted in the Neisseria and influenza examples, statistical tests for re-combination can confound rere-combination and varia-tion in mutavaria-tion/fixavaria-tion rates.
The left column of Figure 2 shows the power of 14 (or 16) other methods as well as the power of ourD-method, which was determined as follows. Each data point cor-responds to 100 simulated sequence sets with 10 se-quences in each set (details in Posadaand Crandall 2001). In a set of 10 sequences, there are 720 unique parent–parent–child arrangements; the quantityDm,n,2 was calculated for each of these 720 triplets and the P-value associated with that quantity was computed with recursions (9)–(12). The minimum of these 720P-values was corrected with a Dunn–Sˇida´k correction and then
reported as theP-value for rejecting clonal evolution in that 10-sequence set. This procedure was implemented
in C11 as a command-line Linux program called
3SEQ; source code is available from the authors. The number of sets in which clonal evolution could be re-jected at the 0.05 level was reported as the power of our D-method. The false-positive rates in the right-hand column of Figure 2 were computed in the same way.
Figure 2 shows that for a high enough mutation rate, our method is among the most powerful available for detecting recombination. For the sequence sets where u ¼10, the mean pairwise distance within each set of 10 sequences ranges from 1 to 30 nt. UsingDm,n,2to test for recombination requires a minimum of nine in-formative sites to reject clonality at the 0.05 level; when correcting with a Dunn–Sˇida´k correction for 720 com-parisons, a minimum of 20 informative sites is needed. For this reason, our method has low power for data sets with little polymorphism. For the tested parameter com-binations, our false-positive rate is at most 2% and among the lowest of all methods tested. It is important to note that some of the more powerful methods in the left-hand column had high false-positive rates in the right column. The plots in supplemental Figure S1 (http://www.genetics.org/supplemental/) show the ra-tios of power to false-positive rate for the 16 methods from Figure 2.
Supplemental Figure S2 at http://www.genetics. org/supplemental/ shows an additional false-positive
Figure 2.—Power and
false-positive comparisons to the 14 methods tested in Posada and Crandall
(2001). The top four graphs include two additional LPT methods described in Carvajal-Rodrı´guez et al.
(2006). The graphs in the left column plot power under dif-ferent recombination rates, while the right-hand column shows false-positive rates when there is variation in mu-tation rates but recombina-tion is not present; a ¼ ‘
analysis in data sets generated with autocorrelated muta-tion rates (from Figure 5c of Bruen et al. 2006); our false-positive rate was never.3.2% for these data sets. Supplemental Figure S3 at http://www.genetics.org/ supplemental/ shows a power analysis under conditions with population growth, using the simulated data from Figure 4 of Bruenet al.(2006).Dm,n,2is quite powerful under a scenario of population growth (as long as se-quence diversity is high enough), and it retains very high power even when the recombination parameter ris small.
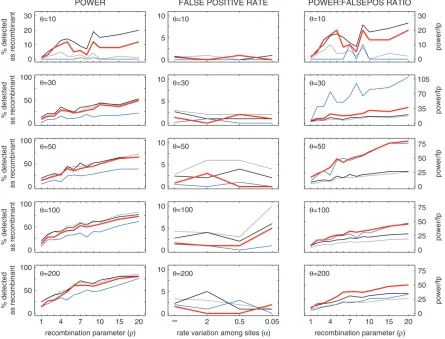
Since our statistical test is designed for sequence trip-lets we perform an additional power analysis that focuses exclusively on detecting recombination in sets of three sequences. We compareDm,n,2to three other common statistical tests designed to identify recombination in sequence triplets (a total of eight methods were tested of which the three most powerful are shown in Figure 3; details of and results for all eight methods are in
the supplemental materials at http://www.genetics.org/ supplemental/). For each data point in Figure 3, the program TREEVOLVE (Grasslyet al.1999) was used to generate 100 replicates of three sequences with the given population-genetic parameters, using the F84 model of nucleotide substitution (Felsensteinand Churchill 1996) withpA¼0.4,pC¼0.2,pG¼0.1,pT¼0.3, and a
transition/transversion ratio of two. The black line in Figure 3 denotes the power and false-positive rate of a single-breakpoint version of Chimaera with exactP-value
computations (Posadaand Crandall2001; Spencer
2003), the gray line corresponds to the most recent ver-sion of Chimaera (Chim-2006), and the blue line corre-sponds to the Martin–Rybicki method with window size 30 nt and step size 1 nt.
For statistical identification of mosaic structure in sequence triplets, our D-method is as powerful as the most powerful methods available. All four methods in Figure 3 have similar power and false-positive rates, with
Figure3.—Power and false-positive comparisons with MR and Chimaera on sequence triplets. The red line shows power and
false-positive rates forDm,n,2. The black line shows the power and false-positive rates for Chim-Sp, a single-breakpoint no-window Chimaera implementation (described on p. 14 of the supplemental materials of Posadaand Crandall2001) whoseP-values were
calculated using the method of Spencer(2003). The gray line shows the power and false-positive rates of Chim-2006, a new
Chi-maera implementation with a sliding-window and sliding-breakpoint scheme;P-values were computed by permuting alignment columns 1000 times. The blue line shows the power and false-positive rates for MR-30,1 (Martin–Rybicki method with window size 30 nt and step size 1 nt). The third column shows ratio of power to false-positive rate ata¼‘. False-positive rates ata¼‘were calculated with 1000 simulated triplets; all other data points were calculated with 100 simulated triplets.a¼‘in the left column;r
the distinguishing feature that Chimaera is the least con-servative method, MR is the most concon-servative, andDm,n,2 is somewhere in between. Foru $50,Dm,n,2has the best combination of power and false-positive rate.
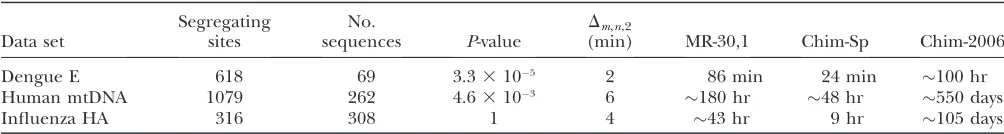
Speed: Table 3 shows the computation times of our method compared to MR and Chimaera. Our method has a clear advantage, especially in large data sets, since P-values are simply read from memory once a table of
ym,n,k,j-values is built. For example, analysis of the
influ-enza data (Boni 2007) requires reading 29 million P-values from memory, which is not a time-consuming task for a 3.2-GHz processor. Likewise, computing exact P-values using the method described by Spencer(2003) is quite fast; this is slightly slower than ourD-method since a new table needs to be built for eachP-value com-putation. On the other hand, performing 14.5 million sliding-windowx2-computations on each of 1000 ran-domized data sets (Chim-2006) or computing 9.6 millionP-values from a binomial distribution for each of 287 possible windows (MR-30,1) can be quite com-putationally expensive.
Note that nontriplet methods can be much faster than triplet methods. For example, analyzing the data in Table 3 withFw(Bruenet al.2006) takes seconds, but
the recombinant sequences cannot be isolated.
DISCUSSION
Comparison: Many statistical methods have already been developed for detecting recombination from se-quence data. The usual recombination signals that these methods attempt to identify are (i) varying patterns of sequence identity, (ii) phylogenetic incongruencies, (iii) excess homoplasies, (iv) clustered polymorphism, and (v) low linkage disequilibrium; our method is of the first type. Here, we summarize the main similarities/ differences between and advantages/disadvantages of our method and previous ones.
Most importantly, our method considers three se-quences at a time using the appropriate mechanistic framework in which to view mosaic structure: the exis-tence of one sequence that is a mosaic of a second and a third. MaynardSmith(1992) also acknowledged this
as the appropriate framework, although the test he de-veloped is designed for two sequences. Maynard Smith’s maximumx2-method was later reformulated as a proper three-sequence problem and is now called
maximum-match x2 or Chimaera (Posada and Crandall 2001;
Posada2002). Takahata(1994) recognized that one needed to look at a minimum of three sequences by focusing on sites that support a particular sister-group status where exactly two of three nucleotides agree. The BOOTSCAN search method (Salminemet al.1995) ex-amines candidate recombinants to see how different regions cluster with either of two parental sequences; bootstrap support, rather than a significance test, pro-vides a measure of reliability of the proposed clustering.
Recently, Martin et al. (2005) modified the
BOOT-SCAN method to search only sequence triples and to find recombinants statistically using the binomial test in Martinand Rybicki(2000). Finally, Holmeset al. (1999) describe a phylogenetic method called LARD that considers three sequences at a time and tests the hypothesis of completely clonal evolutionvs.the hypoth-esis of clonal evolution for segments on either side of a breakpoint; their problem is formulated similarly to ours, the main difference being that their method fo-cuses on phylogeny. It should be noted that some meth-ods (Robertsonet al.1995; Gibbset al.2000) require four sequences: three involved in a recombination event and a fourth used as an outgroup.
The mechanistic three-sequence approach contrasts with approaches that attempt to identify indirect signals from sequence data, such as an excess of homoplasies (Hudson and Kaplan 1985; Jakobsen and Easteal
1996; Maynard Smith and Smith 1998; Maynard
Smith1999; Bruenet al.2006) or a clustering of
poly-morphisms (Stephens 1985; Maynard Smith 1992;
Martinand Rybicki2000) that would be indicative of a recent recombination or gene conversion. While these methods can be quite effective, one must keep in mind that polymorphism clustering can be caused by se-lection or mutational hotspots and that an excess of homoplasies can be quite difficult to detect in rapidly mutating organisms such as RNA viruses.
Our method has several technical advantages. First, we do not use Monte Carlo methods to generate TABLE 3
Computation times (last four columns) for computing recombination statistics andP-values in large data sets Data set
Segregating sites
No.
sequences P-value
Dm,n,2
(min) MR-30,1 Chim-Sp Chim-2006
Dengue E 618 69 3.33105 2 86 min 24 min 100 hr
Human mtDNA 1079 262 4.63103 6 180 hr 48 hr 550 days
Influenza HA 316 308 1 4 43 hr 9 hr 105 days
All times and estimates are for a single 3.2-GHz processor. Dengue data are serotype 2 from Holmeset al.(1999); human
mi-tochondrial DNA sequences are a subset of distinct strains from Kivisildet al.(2006); influenza seqeunces are New Zealand H3N2
isolates from 2000–2005 analyzed in Boni(2007). TheP-value reported in this table is the minimumP-value (testing withD
P-values, which makes ourP-value computations very fast. Moreover, once a table is built in memory to calculate a particularxm,n,k, successiveP-values can simply be
ex-tracted from the table; this means that repeated ap-plication of our D-tests is limited only by how quickly the computer’s memory can be accessed. Monte Carlo methods have the additional disadvantage that the pre-cision of computed P-values is limited by the number of permutations that can be done; this could be prob-lematic in large data sets where preciseP-values may be needed to survive multiple-comparisons corrections. Sec-ond, we avoid the widely used sliding-window approaches (Salminemet al.1995; Siepelet al.1995; Grasslyand Holmes 1997; Lole et al.1999; Martin and Rybicki 2000; Strimmer et al. 2003; Martin et al. 2005) that require the user to define a window size at the scale at which recombination is believed to have occurred. By considering all possible breakpoints in expression (4), we find the optimal ‘‘window size’’ that should be used for inferring recombination in a particular sequence triplet. This allows for the detection of recombinant seg-ments at any scale.
By removing uninformative sites, our D-method
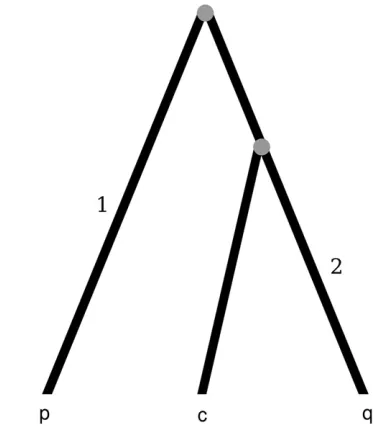
should not confound variation in mutation/fixation rates with recombination; indeed, the middle column of Figure 3 and supplemental Figure S2 at http://www. genetics.org/supplemental/ show that even under high rate variation our false-positive rate is at most 5% (and usually ,3%). However, lineage-specific or heterota-chous rate variation can, in the absence of recombina-tion, produce the pattern that is meant to be rejected by our D-distributions. Consider the tree in Figure 4. Branch 1 connects the root to sequencepwhile branch 2 connects the q–c common ancestor to sequence q. Differential environmental pressures on branches 1 and 2 can create the impression of mosaic structure. Sup-pose that the organism, during its evolution along branch 1, experiences an environment where the right-hand side of the sequence evolves rapidly and accumulates many substitutions while the left-hand side is either con-served or mutates neutrally. Suppose further that the organism, during evolution along branch 2, experien-ces an environment where the left-hand side of the se-quence evolves rapidly and accumulates substitutions while the right-hand side is conserved or mutates neu-trally. Under this scenario of clonal evolution, where en-vironmental pressure increases substitution rates in the right part of the sequence on branch 1 and in the left part of the sequence on branch 2, the resulting se-quence triple (p,q,c) will give the appearance that a recombination event occurred. In this case, the right part of sequence c will be very similar to sequence q
while the left part will be very similar to sequencep. This type of sequence identity in different sequence regions is exactly what ourD-statistics are designed to reveal.
While this combination of events may seem unlikely, the influenza sequences described here may have
under-gone just such evolutionary pressures. A key component in this scenario where mosaic structure is generated without recombination is that the organism experiences different selective environments on different branches of its phylogeny.
General conclusions:We have introduced exact, non-parametric statistical tests for identifying nucleotide se-quence mosaic structure with one or two breakpoints. Our test statistic is a function of a given sequence triple where one sequence is hypothesized to be a recombi-nant of the other two. Given a sequence triple, we calcu-late the difference in proximity (to the child sequence) between the closer parent sequence and the closest candidate recombinant sequence. This difference is de-noted Dm,n,b—wheremandndescribe the numbers of
informative sites at which the child sequence clusters with one or the other parent, andbdenotes the number of breakpoints allowed in a candidate recombinant— and it is studied as a random variable under the null hypothesis of clonal evolution. The distribution ofDm,n,1 has been described in the probability literature on bal-lot problems, while the distribution ofDm,n,2has been approximated but not described exactly. With brute-force methods, exact probabilities of the distribution of Dm,n,2would require exponentially growing computation
times that would become unmanageable oncem1n.
35. To remedy this problem, we derive a set of recursive equations to calculate the probability mass function of Dm,n,2 in Oðmn3Þ-time. These calculations can be performed in seconds on a single-processor personal
Figure4.—Phylogenetic tree that shows a possible clonal
computer (3 GHz, 2 GB RAM) as long asm1n,250.
When 250 , m 1 n , 400, most computations are
equally quick although some may require additional memory or the use of virtual memory.
Our method relies on deducing parent–child quence identity for different parents in different se-quence regions. If a recombination occurred between sequencespandq to create the sequencec, then one segment of sequencecshould be more similar to parent
pwhile the remaining segment(s) of sequencecshould be more similar to parentq. If this pattern is statistically significant—i.e., if it appears in the far right-hand tail of the distribution ofDm,n,b—we deduce that a
recombina-tion occurred.
OurD-method is among the most powerful available for detecting recombination in sequence data, even in highly recombinant data sets (generating data sets as in Figure 2 withr¼128, our method had 100% power for u $50) or in data sets generated under conditions of population growth (see supplemental Figure S3 at http:// www.genetics.org/supplemental/). For many of the sim-ulated data sets in this article,Dm,n,2appears to have the best combination of power and low false-positive rate. With comparable power to the best available methods, the most immediate practical advantage of usingDm,n,2 over other methods is its speed in large data sets. As can be seen in Table 3, computingP-values fromDm,n,2can be many orders of magnitude faster than other triplet methods, depending on the number of sequences and the amount of polymorphism in the data set. ForN se-quences, triplet methods will make on the order ofN3 comparisons, which forN. 1000 can be quite a large number for a personal computer. For example, 1000 in-fluenza sequences with a similar level of polymorphism as in Table 3 would take 137 min to analyze withDm,n,2, while 2000 sequences would take 18 hr. Fortunately, our method (along with most triplet methods) is completely parallelizable, which means that as sequence databases grow we can take advantage of parallel computing to search for recombinants in very large data sets. Note that if we have a particular query sequence that we would like to test for recombination, the number of comparisons is of orderN2.
Our choice of applications here represents only a small sample of the clonal or nearly clonal sequences we could analyze with ourD-statistics. They would also be quite useful in finding recombinants in human immu-nodeficiency virus databases and in larger dengue virus data sets and in analyzing the recently suggested re-combinants in measles (Schierupet al.2005). Human mitochondrial DNA is generally believed to evolve clonally, although the data set in Table 3 has quite strong mosaic signals; a reanalysis of other mtDNA data sets (Piganeauand Eyre-Walker2004; Piganeauet al. 2004) would help determine whether recombination occurred during the evolution of the mitochondrion. For the influenza virus, our test could be used on whole
(concatenated) influenza genomes, as in Holmeset al. (2005), to detect possible reassortment; hundreds of se-quenced whole influenza genomes have already been analyzed (Nelsonet al.2006) and thousands more have been deposited in GenBank. As sequence databases
expand in the genomic era, the D-method presented
here could become one of the most efficient methods for detecting recombination and finding recombinants in large data sets.
We thank E. C. Holmes for many discussions especially on the rate variation scenario for influenza; we thank T. C. Bruen for providing data sets for power analysis and false-positive analysis; and we thank N. A. Rosenberg, J. M. Macpherson, and J. Van Cleve for helpful comments and suggestions. An anonymous editor pointed us to the known result in Equation 7. This work was funded in part by National Institutes of Health grants GM28016 (M.F.B., M.W.F.) and HG000205 (M.F.B.). D.P. is funded by grant BFU2004-02700 of the Spanish Ministry of Education and Science and by the Ramo´n y Cajal program of the Spanish government.
LITERATURE CITED
Ardlie, K. G., L. Kruglyakand M. Seielstad, 2002 Patterns of
linkage disequilbrium in the human genome. Nat. Rev. Genet.
3:299–309.
Awadalla, P., 2003 The evolutionary genomics of pathogen
recom-bination. Nat. Rev. Genet.4:50–60.
Awadalla, P., A. Eyre-Walkerand J. MaynardSmith, 1999
Link-age disequilibrium and recombination in hominid mitochon-drial DNA. Science286:2524–2525.
Balding, D. J., R. A. Nicholsand D. M. Hunt, 1992 Detecting gene
conversion: primate visual pigment genes. Proc. R. Soc. Lond. Ser. B249:275–280.
Barton, D. E., and C. L. Mallows, 1965 Some aspects of the
ran-dom sequence. Ann. Math. Stat.36:236–260.
Boni, M. F., 2007 Vaccination and antigenic drift in influenza.
Vac-cine (in press).
Brown, C., E. C. Garner, A. K. Dunkerand P. Joyce, 2001 The
power to detect recombination using the coalescent. Mol. Biol. Evol.18:1421–1424.
Bruen, T. C., H. Philippeand D. Bryant, 2006 A simple and robust
statistical test detecting the presence of recombination. Genetics
172:2665–2681.
Carvajal-Rodrı´guez, A., K. A. Crandalland D. Posada, 2006
Re-combination estimation under complex evolutionary models with the coalescent composite-likelihood method. Mol. Biol. Evol.23:817–826.
Crandall, K. A., and A. R. Templeton, 1999 Statistical methods for
detecting recombination, pp. 153–176 inThe Evolution of HIV, edi-ted by K. A. Crandall. Johns Hopkins University Press, Baltimore.
Feller, W., 1957 An Introduction to Probability Theory and Its Applica-tions, Vol. I. John Wiley & Sons, New York.
Felsenstein, J., and G. A. Churchill, 1996 A hidden Markov
model approach to variation among sites in rate of evolution. Mol. Biol. Evol.13:93–104.
Fitch, W. M., and E. Markowitz, 1970 An improved method for
determining codon variability in a gene and its application to the rate of fixation of mutations in evolution. Biochem. Genet.
4:579–593.
Gabriel, S. B., S. F. Schaffner, H. Nguyen, J. M. Moore, J. Royet al.,
2002 The structure of haplotype blocks in the human genome. Science296:2225–2229.
Gibbs, M. J., J. S. Armstrongand A. J. Gibbs, 2000 Sister-scanning:
a Monte Carlo procedure for assessing signals in recombinant se-quences. Bioinformatics16:573–582.
Gibbs, M. J., J. S. Armstrongand A. J. Gibbs, 2001 Recombination
in the hemagglutinin gene of the 1918 ‘‘Spanish flu.’’ Science
293:1842–1845.
Goss, P. J. E., and R. C. Lewontin, 1996 Detecting heterogeneity of
substitution along DNA and protein sequences. Genetics143:
Grassly, N. C., and E. C. Holmes, 1997 A likelihood method for
the detection of selection and recombination using nucleotide sequences. Mol. Biol. Evol.14:239–247.
Grassly, N. C., P. H. Harveyand E. C. Holmes, 1999 Population
dynam-ics of HIV-1 inferred from gene sequences. Genetdynam-ics151:427–438. Halkett, F., J.-C. Simonand F. Balloux, 2005 Tackling the
popu-lation genetics of clonal and partially clonal organisms. Trends Ecol. Evol.20:194–201.
Hogan, M. L., and D. Siegmund, 1986 Large deviations for the
max-ima of some random fields. Adv. Appl. Math.7:2–22.
Holmes, E. C., M. Worobeyand A. Rambaut, 1999 Phylogenetic
evi-dence for recombination in dengue virus. Mol. Biol. Evol.16:405–409. Holmes, E. C., E. Ghedin, N. Miller, J. Taylor, Y. Bao et al.,
2005 Whole-genome analysis of human influenza A virus veals multiple persistent lineages and reassortment among re-cent H3N2 viruses. PLoS Biol.3:e300.
Hudson, R. R., and N. L. Kaplan, 1985 Statistical properties of the
number of recombination events in the history of a sample of DNA sequences. Genetics111:147–164.
Husmeier, D., and G. McGuire, 2003 Detecting recombination in
4-taxa DNA sequence alignments with Bayesian hidden Markov mod-els and Markov chain Monte Carlo. Mol. Biol. Evol.20:315–337. Jakobsen, I. B., and S. Easteal, 1996 A program for calculating and
displaying compatibility matrices as an aid in determining retic-ulate evolution in molecular sequences. Comput. Appl. Biosci12:
291–295.
Karlin, S., and V. Brendel, 1992 Chance and statistical significance
in protein and DNA sequence analysis. Science257:39–49. Karlin, S., and A. Dembo, 1992 Limit distributions of maximal
seg-mental score among Markov-dependent partial sums. Adv. Appl. Probab.24:113–140.
Karlin, S., A. Demboand T. Kawabata, 1990 Statistical
composi-tion of high-scoring segments from molecular sequences. Ann. Stat.18:571–581.
Khatchikian, D., M. Orlichand R. Rott, 1989 Increased viral
path-ogenicity after insertion of a 28S ribosomal RNA sequence into the hemagglutinin gene of an influenza virus. Nature340:156–157. Kilbourne, E. D., 1978 Molecular epidemiology—influenza as
ar-chetype. Harvey Lect.73:225–258.
Kivisild, T., P. Shen, D. P. Wall, B. Do, R. Sunget al., 2006 The role
of selection in the evolution of human mitochondrial genomes. Genetics172:373–387.
Lole, K. S., R. C. Bollinger, R. S. Paranjape, D. Gadkari, S. S.
Kulkarniet al., 1999 Full-length immunodeficiency virus type
1 genomes from subtype c–infected seroconverters in india, with evidence of intersubtype recombination. J. Virol.73:152–160. Lopez, P., D. Casaneand H. Philippe, 2002 Heterotachy, an
impor-tant process of protein evolution. Mol. Biol. Evol.19:1–7. Martin, D., and E. Rybicki, 2000 RDP: detection of recombination
amongst aligned sequences. Bioinformatics16:562–563. Martin, D. P., D. Posada, K. A. Crandall and C. Williamson,
2005 A modified bootscan algorithm for automated identifica-tion of recombinant sequences and recombinaidentifica-tion breakpoints. AIDS Res. Hum. Retroviruses21:98–102.
MaynardSmith, J., 1992 Analyzing the mosaic structure of genes.
J. Mol. Evol.34:126–129.
MaynardSmith, J., 1999 The detection and measurement of
re-combination from sequence data. Genetics153:1021–1027. MaynardSmith, J., and N. H. Smith, 1998 Detecting
recombina-tion from gene trees. Mol. Biol. Evol.15:590–599.
MaynardSmith, J., N. H. Smith, M. O’Rourkeand B. G. Spratt,
1993 How clonal are bacteria? Proc. Natl. Acad. Sci. USA90:
4384–4388.
Moya, A., E. C. Holmesand F. Gonza´ lez-Candelas, 2004 The
pop-ulation genetics and evolutionary epidemiology of RNA viruses. Nat. Rev. Microbiol.2:279–288.
Nelson, M. I., L. Simonsen, C. Viboud, M. A. Miller, J. Tayloret al.,
2006 Stochastic processes are key determinants of the short-term evolution of influenza A virus. PLoS Pathog.2:e125. Orlich, M., H. Gottwaldand R. Rott, 1994 Nonhomologous
re-combination between the hemagglutinin gene and the nucleo-protein gene of an influenza virus. Virology204:462–465. Piganeau, G., and A. Eyre-Walker, 2004 A reanalysis of the indirect
evidence for recombination in human mitochondrial DNA. He-redity92:282–288.
Piganeau, G., M. Gardnerand A. Eyre-Walker, 2004 A broad
sur-vey of recombination in animal mitochondria. Mol. Biol. Evol.
21:2319–2325.
Posada, D., 2002 Evaluation of methods for detecting recombination
from DNA sequences: empirical data. Mol. Biol. Evol.19:708–717. Posada, D., and K. A. Crandall, 2001 Evaluation of methods for
detecting recombination from DNA: computer simulations. Proc. Natl. Acad. Sci. USA98:13757–13762.
Posada, D., K. A. Crandalland E. C. Holmes, 2002 Recombination
in evolutionary genomics. Annu. Rev. Genet.36:75–97. Pritchard, J. K., and M. Przeworski, 2001 Linkage disequilibrium
in humans: models and data. Am. J. Hum. Genet.69:1–14. Robertson, D. L., B. H. Hahnand P. M. Sharp, 1995 Recombination
in AIDS viruses. J. Mol. Evol.40:249–259.
Salminem, M. O., J. K. Carr, D. S. Burkeand F. E. McCutchan,
1995 Identification of breakpoints in intergenotypic recombi-nants of HIV type 1 by bootscanning. AIDS Res. Hum. Retrovi-ruses11:1423–1425.
Sawyer, S., 1989 Statistical tests for detecting gene conversion. Mol.
Biol. Evol.6:526–538.
Schierup, M. H., C. H. Mordhorst, C. P. Muller and L. S.
Christensen, 2005 Evidence of recombination among
early-vaccination era measles virus strains. BMC Evol. Biol.5:52. Siegmund, D., 1986 Boundary crossing probabilities and statistical
applications. Ann. Stat.14:361–404.
Siegmund, D., 1988 Approximate tail probabilities for the maxima
of some random fields. Ann. Probab.16:487–501.
Siepel, A. C., A. L. Halpern, C. Macken and B. T. M. Korber,
1995 A computer program designed to screen rapidly for HIV type 1 intersubtype recombinant sequences. AIDS Res. Hum. Retroviruses11:1413–1416.
Sneath, P. H. A., 1995 The distribution of the random division of a
molecular sequence. Binary Comput. Microbiol.7:148–152. Sneath, P. H. A., 1998 The effect of evenly spaced constant sites on
the distribution of the random division of a molecular sequence. Bioinformatics14:608–616.
Spencer, M., 2003 Exact significance levels for the maximum x2
method of detecting recombination. Bioinformatics19:1368–1370. Stephens, J. C., 1985 Statistical methods of DNA sequence analysis:
detection of intragenic recombination or gene conversion. Mol. Biol. Evol.2:539–556.
Strimmer, K., K. Forslund, B. Hollandand V. Moulton, 2003 A
novel exploratory method for visual recombination detection. Genome Biol.4:R33.
Stumpf, M. P. H., and G. A. T. McVean, 2003 Estimating
recombina-tion rates from popularecombina-tion-genetic data. Nat. Rev. Genet.4:959–968. Suarez, D. L., D. A. Senne, J. Banks, I. H. Brown, S. C. Essenet al.,
2004 Recombination resulting in virulence shift in avian influ-enza outbreak, Chile. Emerg. Infect. Dis.10:693–699. Takahata, N., 1994 Comments on the detection of reciprocal
re-combination or gene conversion. Immunogenetics39:146–149. Wall, J. D., 1999 Recombination and the power of statistical tests of
neutrality. Genet. Res.74:65–79.
Wall, J. D., 2000 A comparison of estimators of the population
re-combination rate. Mol. Biol. Evol.17:156–163.
Whitworth, W. A., 1901 Choice and Chance, Ed. 5. Hafner
Publish-ing, New York.
Wilson, D. J., D. Falushand G. McVean, 2005 Germs, genomes,
and genealogies. Trends Ecol. Evol.20:39–45.
Wiuf, C., T. Christensenand J. Hein, 2001 A simulation study of
the reliability of recombination detection methods. Mol. Biol. Evol.18:1929–1939.
Worobey, M., 2001 A novel approach to detecting and measuring
recombination: new insights into evolution of viruses, bacteria, and mitochondria. Mol. Biol. Evol.18:1425–1434.
Worobey, M., A. Rambaut, O. G. Pybus and D. L. Robertson,
2002 Questioning the evidence for genetic recombination in the 1918 ‘‘Spanish flu’’ virus. Science296:211a.
Yang, Z., 1996 Among-site variation and its impact on phylogenetic
analyses. Trends Ecol. Evol.11:367–371.
Zhou, J., and B. G. Spratt, 1992 Sequence diversity within theargF, fbp
andrecAgenes of natural isolates ofNeisseria meningitidis: interspecies recombination within theargFgene. Mol. Microbiol.6:2135–2146.