DOI: 10.1534/genetics.109.110411
The Evolution of Control and Distribution of Adaptive Mutations
in a Metabolic Pathway
Kevin M. Wright
1and Mark D. Rausher
Department of Biology, Duke University, Durham, North Carolina 27708
Manuscript received September 29, 2009 Accepted for publication November 17, 2009
ABSTRACT
In an attempt to understand whether it should be expected that some genes tend to be used disproportionately often by natural selection, we investigated two related phenomena: the evolution of flux control among enzymes in a metabolic pathway and properties of adaptive substitutions in pathway enzymes. These two phenomena are related by the principle that adaptive substitutions should occur more frequently in enzymes with greater flux control. Predicting which enzymes will be preferentially involved in adaptive evolution thus requires an evolutionary theory of flux control. We investigated the evolution of enzyme control in metabolic pathways with two models of enzyme kinetics: metabolic control theory (MCT) and Michaelis–Menten saturation kinetics (SK). Our models generate two main predictions for pathways in which reactions are moderately to highly irreversible: (1) flux control will evolve to be highly unequal among enzymes in a pathway and (2) upstream enzymes evolve a greater control coefficient then those downstream. This results in upstream enzymes fixing the majority of beneficial mutations during adaptive evolution. Once the population has reached high fitness, the trend is reversed, with the majority of neutral/slightly deleterious mutations occurring in downstream enzymes. These patterns are the result of three factors (the first of these is unique to the MCT simulations while the other two seem to be general properties of the metabolic pathways): (1) the majority of randomly selected, starting combinations of enzyme kinetic rates generate pathways that possess greater control for the upstream enzymes compared to downstream enzymes; (2) selection against large pools of intermediate substrates tends to prevent majority control by downstream enzymes; and (3) equivalent mutations in enzyme kinetic rates have the greatest effect on flux for enzymes with high levels of flux control, and these enzymes will accumulate adaptive substitutions, strengthening their control. Prediction 1 is well supported by available data on control coefficients. Data for evaluating prediction 2 are sparse but not inconsistent with this prediction.
T
HEORETICAL research on the process of adapta-tion has focused primarily on describing the size and number of genetic changes underlying phenotypic change (Fisher 1930; Kimura 1983; Orr 1998, 2002, 2003). By contrast, comparatively little theoretical attention has been given to the question of whether certain genes or types of genes are preferentially in-volved in the process of adaptation. Yet the current debate over the relative importance of regulatory vs.structural genes in morphological evolution (Hoekstra and Coyne2007; Sternand Orgogozo2008) clearly indicates that this question is of interest to evolutionary biologists.
One situation in which this question is pertinent is the evolution of characters that are influenced by the concentration of end products of metabolic pathways. Often change in end-product concentration can be
achieved by substitutions in any one of several genes in the pathway. One example is the intensity of floral pigmentation. To a first approximation, final pigment concentration, and hence color intensity, can be viewed as being determined by the flux rate down the pigment biosynthetic pathway for a fixed time corresponding to the duration of floral development. More generally, any situation in which flux rate determines phenotype is likely to fall in this category. In such situations, meta-bolic control theory (MCT) (Kacserand Burns1973) and similar approaches (Heinrich and Rapoport 1974; Savageau 1976) indicate that changes in flux can be achieved by changing the activity of any enzyme in the pathway. We seek to determine whether and, if so, why enzymes differ in the probability that they contrib-ute to evolutionary change in pathway flux.
It has been suggested as a general principle that enzymes with the greatest control over flux will be disproportionately involved in such evolutionary change (Hartlet al. 1985; Eanes1999; Wattand Dean2000). This argument is based on the theoretical expecta-tion that the probability of fixaexpecta-tion of an advantageous
Supporting information is available online at http://www.genetics.org/ cgi/content/full/genetics.109.110411/DC1.
1Corresponding author:Department of Biology, P.O. Box 90038, Duke University, Durham, NC 27708. E-mail: [email protected]
allele is roughly proportional to its selection coefficient (Hedrick2000). Since mutations equivalent in terms of enzyme kinetic properties will have greater effects on flux, and hence on fitness, in enzymes with greater metabolic control, mutations in those enzymes will be substituted preferentially.
While this argument is likely sound, it simply pushes back the question of which genes evolve preferentially to the question of which enzymes are expected to have greatest control over flux. Although we are unaware of any theoretical attempts to model the evolution of flux control, many authors have speculated about where in pathways control is expected to be highest.
Kacser and Burns (1973) hypothesized that the
magnitudes of flux control exerted by different enzymes may be very similar. This hypothesis was based on the result from MCT that in linear pathways, overall flux control can be shared by all enzymes. Since metabolic pathways often consist of many enzymes, each would be expected to have only a limited potential to influence flux. Subsequent theoretical analysis of this hypothesis demonstrated that a given flux is consistent with many different flux-control distributions, including, at one extreme, equal flux control by all enzymes and, at the other extreme, major control by one or a few enzymes and little control for all others (Mazat et al. 1996). However, the question of which of these possibilities, if any, are likely to be favored by selection has not been addressed.
Another hypothesis, the epistatic or synergistic princi-ple, predicts that control will be vested in a single enzyme at any given time, but will shift over time among enzymes (Dykhuizen et al. 1987; Keightley 1989; Bost et al. 2001) According to this hypothesis, starting from equal control among enzymes in the pathway, selection to increase (or decrease) flux will cause the activity of one enzyme to increase (decrease). This change results in a decrease (increase) in flux control for the enzyme that changes and an increase (decrease) in control for the other pathway enzymes, causing control to be unequally shared. While this argument seems plausible, there has been no analysis of whether over time all enzymes have an equal chance of having elevated control.
Finally, Eanes’ (1999) review of enzyme polymor-phisms found that control is often centered in enzymes at pathway branch points, which constitute the most upstream enzymes of their specific branch. Flowers
et al.(2007) also demonstrated that branching enzymes tend to exhibit more adaptive substitutions than down-stream enzymes as would be expected under the prin-ciple that evolutionary change will be concentrated in enzymes with the largest control coefficients. In addi-tion, evolutionary changes in these enzymes may be favored because they allow organisms to modify flux allocation to alternate functions and track environmen-tal fluctuations. This suggestion is supported by the ‘‘branch point effect,’’ a theoretical demonstration that
control coefficients can dramatically shift between enzymes depending on the kinetic rates of the two competing enzymes (LaPorte et al. 1984). However, this study does not address the question of how the distribution of control is likely to evolve, but describes only which distributions of control are mathematically possible. Thus, Eanes(1999, p. 318) concludes his review, stating ‘‘all enzymes in [a] contributing pathway may not be equal; determining the rule[s] for these inequal-ities should be a major goal in studies of enzyme polymorphism.’’
A control coefficient (CC) indicates the degree to which flux through a pathway is altered by a small change in the activity of an enzyme (seeappendix; this is equivalent to the sensitivity coefficient of Kacser and Burns1973). The ‘‘rules’’ governing the distribution of control coefficients are determined by the biological evolution of metabolic systems. While research demon-strates that there are manypossibledistributions of con-trol coefficients, none has examined which of these is most likely to evolve. The optimization of metabolic systems has been explored in detail (Heinrich et al. 1991, 1997; Heinrich and Schuster 1998). In these studies, however, the investigators employ as opti-mization criteria maximizing flux, maximizing tran-sient times, or minimizing metabolic intermediates, criteria whose biological and evolutionary relevance is unclear.
In an effort to understand how control is expected to be shared among enzymes and predict which enzymes are most likely to contribute to adaptive genetic changes, we present two models of the evolution of flux control in a simple linear pathway. The first model employs the framework of MCT. Although there have been many challenges to the MCT framework (Savageau 1976, 1992; Cornish-Bowden1989; Savageauand Sorribas 1989), it should be made clear that our aim is not to construct a precisely parameterized model of a partic-ular biological system, but to use this generalized framework to address a single, critically ignored ques-tion: What are the rules governing how control will evolve to be distributed among enzymes? The use of the MCT framework to address questions in evolutionary genetics is firmly established, with investigation focused on the molecular basis of dominance (Kacser and Burns 1981; Keightley 1996a; Phadnis and Fry 2005; but see Bagheriand Wagner2004), the relation-ship between metabolic flux and fitness (Dykhuizen
Here we limit our analysis to linear pathways as an initial attempt to examine these issues. We find that for such pathways control coefficients will generally evolve to be unequal; that the magnitude of this inequality depends on thethermodynamicproperties, rather than the kinetic properties, of each reaction step; that upstream enzymes tend to evolve higher control coefficients than down-stream enzymes; and that updown-stream enzymes fix advanta-geous mutations in greater numbers, and those mutations have larger effects than in downstream enzymes.
GENERAL MODELING APPROACH
We concentrate here on a simple, linear metabolic pathway containing 2, 3, or 10 enzymes. Following Dykhuizenet al.(1987), Clark(1991), and Szathmary (1993) we assume that flux through the pathway is the sole component of fitness and flux is subject to stabilizing selection. Such selection would arise, for example, when there is stabilizing selection on a char-acter (e.g., lactose metabolism, floral pigment intensity, or glucosinolate production following herbivory) whose value is determined by flux. This framework also allows us to examine the effects of directional selection that arises when the optimal level of flux changes, as might occur for floral pigment intensity if there were environ-mental shift in the optimal intensity for attracting pollinators. We assume, as is usual in an MCT frame-work, that enzymes are at sufficiently high concentra-tion that they are substantially below saturaconcentra-tion (Kacser and Burns 1973). This assumption is subsequently relaxed to investigate the effect of enzyme saturation on the distribution of control coefficients.
To model the evolution of flux control, we assume that flux may be changed either by altering the level of expression of individual enzymes in the pathway (in-creasing expression level generally increases flux) or by altering the kinetic properties of individual enzymes in the pathway (increasing the specific rate of reaction of an enzyme generally increases flux). We subsume both of these effects by focusing on changes in the overall rate of reaction of an enzyme under standard metabolic conditions. Specifically, we represent the forward rate of reactioni,ki, to be a product of (1) the amount of the enzyme present and (2) the standard per-unit-enzyme forward rate constant. For a givenki, the reverse rate of reaction i, ki, is a thermodynamic property of the
system; it is determined by the difference in free energy between products and reactants (Nelson and Cox 2000) and is not subject to organic evolution. To determine the control properties of each enzyme at evolutionary equilibrium, we initialize replicate popu-lations described by the enzyme activities (k1,k2,. . .,ki) of a metabolic pathway determining fitness of organisms in the population. Each replicate population is seeded with randomkivalues.
Mutations occur in a randomly chosen enzyme,i. We do not allow enzymes to differ in their mutation rates. The effect size of each mutation,Dki, is drawn from a Gaussian distribution centered at zero. We measure the effect of each mutation on flux and fitness (DW) and determine whether the mutation is fixed on the basis of the standard population-genetic fixation probability. Mutations are allowed to occur repeatedly until the flux reaches its optimum. This process pro-duces one evolutionary trajectory, defined as the route across an adaptive landscape from an initial flux toward a new optimal flux. Trajectories are determined for a large number of different initial sets of randomly chosenkivalues all evolving toward the same optimal flux. In essence, this procedure simulates a situation in which the optimal flux has just shifted, and the start-ing points represent many different previous optima. We do not assert that all of these starting values are biologically likely, but adopt this approach to explore the entire space of possible activity values. We perform additional simulations to model a situation in which populations repeatedly shift between two different environmental optima. All simulations are repeated assuming a range of ki values to determine how the
control evolves under varying thermodynamic envi-ronments. Details of the models used are presented in theappendix.
This analysis yields two types of information: a frequency distribution of the final degree of flux control for each enzyme at evolutionary equilibrium and the distribution of number and size of mutations in every evolutionary trajectory. By analyzing two models of metabolic control (MCT and SK) and conducting multiple sets of runs with different values of model parameters (e.g., mutational distribution, reversibility of reactions, initial size of substrate pool, intensity of stabilizing selection; Table 1), we are able to evaluate the robustness of our conclusions.
RESULTS
General behavior of the MCT model:In our model,
N,ai,sJ,sk,I, andJoptare fixed parameters (Table 1). We first consider in detail the behavior of the model for a population size ofN¼1000,I¼10, an optimal flux of
Jopt¼1, a strength of selection ofsJ¼0.5, and a variance in mutation size of sk¼0.05. Subsequently we discuss
how the behavior of the model changes as these parameters are varied. We also assume that there is some maximal enzyme efficiency that is the same for each enzyme, and we scale this maximum to 1 (i.e., we assume thatki,1) by choosing the appropriate unit for time. For simplicity, we consider the case where the enzyme reversibilities,ai, are the same for alliand equal
200 trials were run with each model for eacha-value, each trial beginning from a randomly chosen starting point (k1,k2).
Simulations usually reached the optimal flux in 500– 2000 mutation/fixation cycles, typically having under-gone 10–25 substitutions. In most simulations, pathways with 2 steps reached the fitness peak more quickly than models with 3 or 10 steps. The reversibility parametera
also influenced the rate of adaptation: whena¼0.001 or 0.05, pathways reached equilibrium more rapidly than whena¼0.50 or 0.95.
Evolution of control under the two-step MCT model:
The 2-, 3-, and 10-step pathways exhibit similar evolu-tionary patterns, and because these patterns are easier to visualize for 2-step pathways, we begin by examining the evolution of control in 2-step pathways.
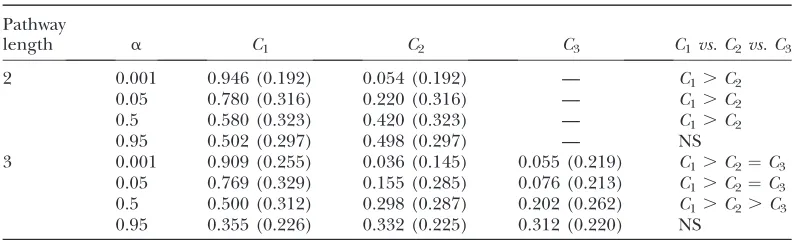
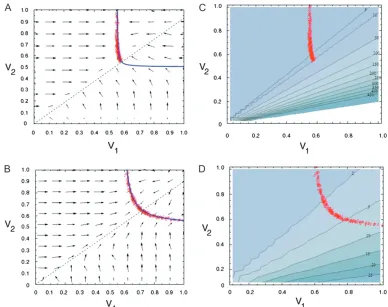
For largely irreversible reactions (a¼0.001 and 0.05), populations starting at random (k1, k2) values evolve highly inequitable control coefficients, with the CC for the first enzyme being on average3–20 times greater than that for the second enzyme (Table 2). As expected (Figure 1A), populations converge to an equilibrium line corresponding to the hyperbola
k2¼ a1
ðI=JoptÞ ð1=k1Þ
; ð1Þ
which is obtained from the two-enzyme equation for flux analogous to (A1). Although different runs con-verged to different points on this line, the majority of these points lie in the region corresponding toC1.C2 (Figure 1A) above the (dashed)C1¼C2line,
k2¼a1k1 ð2Þ
derived from Equation A3.
Two factors contribute to this bias in evolutionary outcomes. First, for a randomly chosen starting (k1,k2) there is an initial bias for the CC of the first enzyme to be greater than that of the second enzyme. This bias arises because the space above theC1¼C2line (correspond-ing toC1.C2) is much larger than the space below the line (corresponding toC1,C2) (Figure 1A). Second, except for starting points very near theC1¼C2line, the average instantaneous trajectories are virtually horizon-tal; i.e., the average change in k1 is large while the average change ink2is small (Figure 1A). This means that trajectories from most starting points will tend to move populations toward a point on the equilibrium line lying in the C1. C2 region. In fact, this second property is a direct consequence of the first. WhenC1.
C2, equivalent mutations affecting k will have larger
effects on flux if they occur in enzyme 1. The selection coefficient favoring a beneficial mutation will thus on average be greater for mutations in enzyme 1. Since the probability of fixation of an advantageous mutation is approximately proportional to its selection coefficient, mutations in enzyme 1 will have a greater chance of fixation than mutations in enzyme 2.
For reactions with intermediate reversibility (ai ¼
0.5), the evolutionary outcome is still biased toward larger CC in the first enzyme, but this bias is not as large as in the previous case (Table 2). And for largely reversible reactions (ai¼0.95), there is little bias (Table TABLE 1
Parameters for MCT and SK simulations
ki Rate of reaction for enzymei(MCT model)
Vi Maximum rate of reaction for enzymei(SK model)
Ci Control coefficient for enzymei
ai ki/ki: ratio of reverse to forward rate of reaction sJ Standard deviation of optimal flux in fitness function,
strength of selection
sk Standard deviation of normal distribution describing mutational effect sizes
Jopt Optimal flux/optimal fitness
N Population size
I Substrate input into pathway
T Threshold limit for substrates (SK model)
TABLE 2
Control coefficient, Ci, for enzymei, for two- and three-step MCT simulations
Pathway
length a C1 C2 C3 C1vs. C2vs. C3
2 0.001 0.946 (0.192) 0.054 (0.192) — C1.C2
0.05 0.780 (0.316) 0.220 (0.316) — C1.C2
0.5 0.580 (0.323) 0.420 (0.323) — C1.C2
0.95 0.502 (0.297) 0.498 (0.297) — NS
3 0.001 0.909 (0.255) 0.036 (0.145) 0.055 (0.219) C1.C2¼C3
0.05 0.769 (0.329) 0.155 (0.285) 0.076 (0.213) C1.C2¼C3 0.5 0.500 (0.312) 0.298 (0.287) 0.202 (0.262) C1.C2.C3
0.95 0.355 (0.226) 0.332 (0.225) 0.312 (0.220) NS
2). Paralleling this decrease in bias with increasing reversibility is both a decrease in the expected pro-portion of starting points withC1.C2and a decrease in the proportion of instantaneous trajectories for which
k1is substantially larger in absolute value thank2(Figure 1B; supporting information, Figure S1).
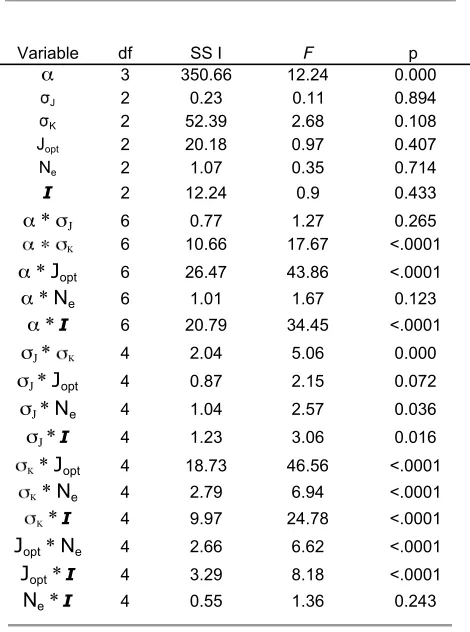
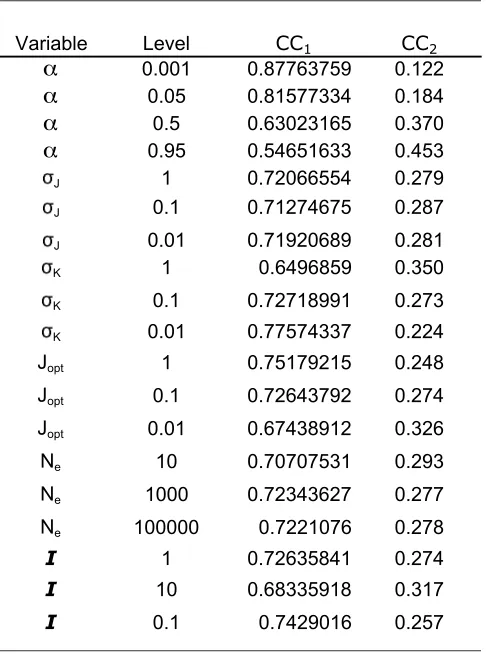
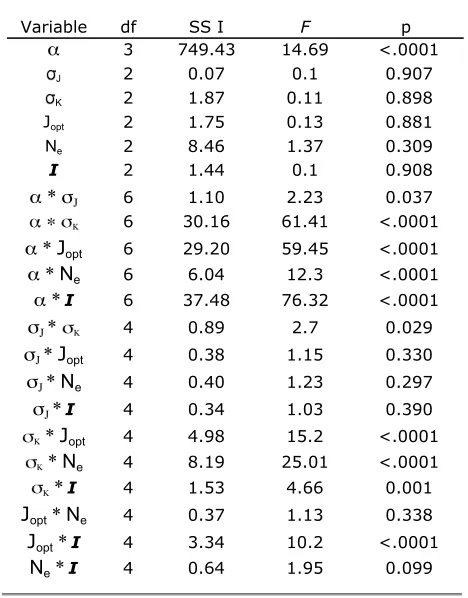
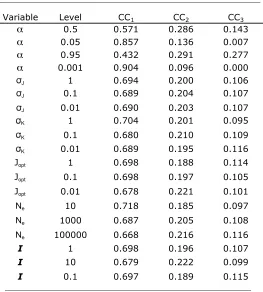
To assess the generality of these results, we performed analogous simulations for different combinations of the values of the parameters N, ai, sJ, sk, I, and Jopt.
Simulations were run in a factorial design varying all six parameters by at least two orders of magnitude, yielding 972 different comparisons, each with 20
repli-cates. We used an ANOVA ( JMP, SAS Institute, 2005) to analyze the effect of altering these parameters on the equilibrium control coefficient for the two enzymes. As expected, varyingasignificantly affected mean control coefficients, but changes in the other five parameters (N,sJ,sk,I, andJopt) did not significantly alter the mean
control coefficient (Table S1). Many of the interaction terms were statistically significant (Table S1), but these effects are subtle and do not change the fundamental evolutionary trend: the mean control coefficient for the first enzyme is larger then that of the second for every comparison (Table S2).
The previous analyses demonstrate that a shift in the flux optimum will, when averaged over random starting points, tend to yield a new equilibrium at which flux control is biased toward the upstream enzyme. However, it is not known whether all possible starting combina-tions of (k1,k2) are equally likely. Moreover, the analysis does not necessarily imply that equilibria at which the majority of control is vested in thesecondenzyme are not evolutionarily stable in a shifting environment. It is thus conceivable that the above analysis fails to completely capture the dynamics of CC evolution in an environ-ment in which the optimal flux varies.
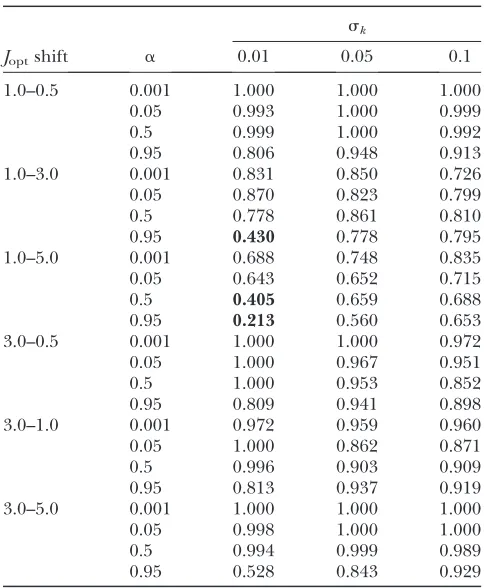
To examine this issue, we simulated evolutionary trajectories in which the optimal flux fluctuated between two values, with shifts in the optimum occurring every 30,000 mutation–fixation cycles. Simulations were per-formed with six pairs of optimal flux (1.0, 0.5; 1.0, 3.0; 1, 5.0; 3.0, 0.5; 3.0, 1.0; and 3.0, 5.0). Simulations were initiated with all replicates at optimal fitness, equally spaced along the high fitness hyperbola, with half of the starting points at C1 . C2 and half at C2 . C1. The parametersaandskwere varied over at least an order of
magnitude across replicate simulations to determine the effect on the equilibrium distribution of control. To determine the long-term distribution of genotypes along the equilibrium curve we used our simulations to estimate transition probabilities from one class of (k1, k2) values to all other classes. Using this in-formation, we constructed a transition matrix,M. Each element, mij of this matrix represents the proportion of replicates starting at the midpoint of segment j
that ended within segment i. Under the approxima-tion that this transiapproxima-tion probability is the same for any starting point within segment j, the long-term, equilibrium probability that a population will be in segment k is just the kth element of the leading eigenvector ofM.
In general, modeling evolution in a fluctuating environment produced results similar to those already obtained: many more trials yielded greater control by the upstream enzyme (C1.C2) than the reverse (Table 3). The few exceptions to this trend occur only when mutations are small and reactions are of intermediate or high reversibility, a condition that appears uncommon in biochemical reactions (seediscussion).
Figure1.—Equilibrium distribution of k1 andk2 for
two-step MCT simulations. Equilibrium reaction rates (red circles) from 200 replicate simulations of the two-enzyme model are shown. Parameters areN¼1000,sJ¼0.5,sk¼0.05,I¼10, andJopt¼1.0. Solid blue lines are equilibrium predicted for the MCT model (Equation 1). Dashed lines denote combina-tions of k1and k2 for which C1 ¼ C2 (Equation 2). For all points above this line, C1 . C2 and for all points below,
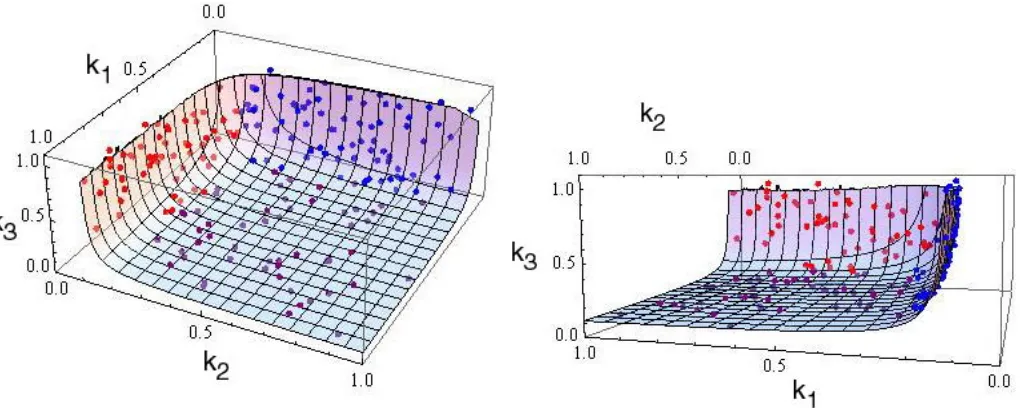
Evolution of control under the three-step MCT model:As with the two-step MCT model, a total of 200 trials were run with this model for eacha-value, each trial beginning from a randomly chosen starting point (k1,k2,k3). In these simulations, the evolution of the CC in a three-step pathway exhibits similar patterns to those described above for a two-step pathway. All trials converged to an equilibrium hyperboloid represented by Equation 1, withJ¼Jopt ¼1 (Figure 2). As for the two-step pathway, whena¼0.001 andai¼0.05, there is
a strong bias for trajectories to converge to points having a high CC for the first enzyme: the meanC1is 20 times greater than the meanC2andC3fora¼0.001 and.3 times greater fora¼0.05 (Table 2 and Figure 2A). This bias is reduced forai¼0.5 and essentially absent when ai ¼ 0.95 (Table 2, Figure 2B, and Figure S2). This
pattern is not dependent on the values of the fixed parameters in our model. As in the two-step model, we generated simulations for all combinations of parame-ter values (N,ai,sJ,sk,I, andJopt), each of which was varied over two orders of magnitude. Once again, we found that the effects ofaion the mean values of the
control coefficients for each enzyme were significant, while variation in the other five parameters (N,sJ,sk,I,
and Jopt) had little effect on the CC for any of the
enzymes (Table S3 and Table S4).
Evolution of control under the 10-step MCT model:
As a final examination of the generality of our results, additional simulations were performed using a model of a longer metabolic pathway containing 10 enzymes. Two hundred replicate pathways were evolved for 20,000 mutation/fixation cycles witha¼0.001 and 0.05: CCs decrease rapidly with position in the pathway and on average the degree of control for the first enzyme is approximately eight and three times greater, respec-tively, than that for the second enzyme (Table S5). With
a¼0.5, this bias is less, but the first 2 enzymes share two-thirds of the control, and the first 3 enzymes account for .75% of the control. Finally, as with the shorter path-ways, when a¼0.95, control is much more equitably distributed on average, with the CCs of the first and last enzymes differing by only 0.032 (Table S5).
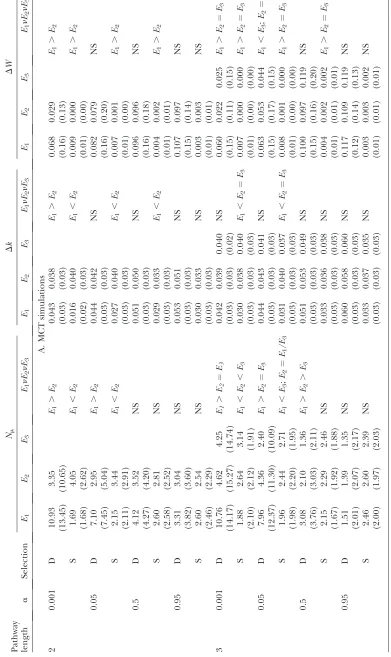
Properties of fixed mutations under the MCT model: We examined three properties of fixed muta-tions: the number of substitutions (Nm) in a trajectory, the change in enzyme activity caused by each mutation (Dki), and the change in fitness caused by each mutation (DW). We compared the value of these properties for different enzyme steps, during different phases of an evolutionary trajectory. Adaptive walks were divided into two phases: the first phase when the population is far from the optimum (W(J),0.95) and evolution is dom-inated by directional selection and a second phase when the population is near the optimum (W(J).0.95) and evolution is dominated by stabilizing selection.
For pathways with low reversibility (ai ¼ 0.001 and
0.05), during the first phase of the adaptive walk, two to three times as many substitutions occurred in the first enzyme as in the second or third enzymes (Table 4A). Although the average effects of these substitutions on
k were similar for the different enzymes, the average effect on fitness was larger for the first enzyme (Table 4A). Moreover, many more substitutions improved fitness in the first enzyme, compared to those down-stream (ai ¼ 0.001: 2E pathway, 44.0% vs. 10.3%; 3E
pathway, 38.2% vs. 7.3% and 2.7%). In the second phase, the same pattern emerges in the distribution of beneficial mutations between up- and downstream enzymes (ai¼0.001: 2Epathway, 91.6%vs. 26.1%; 3E
pathway, 93.7%vs.35.1% and 0.5%). There were many more substitutions that had no effect on fitness during the first phase than during the second phase. This unexpected result is caused by mutations that were fixed primarily when populations were far from the fitness optimum and the landscape was essentially flat. The average effect on k during the second phase was significantly smaller for the first enzyme than for the more downstream enzymes, presumably reflecting the fact that for enzymes with greater flux control, only TABLE 3
Proportion of pathways that evolveC1.C2in a shifting environmental optimum
sk
Joptshift a 0.01 0.05 0.1
1.0–0.5 0.001 1.000 1.000 1.000
0.05 0.993 1.000 0.999
0.5 0.999 1.000 0.992
0.95 0.806 0.948 0.913
1.0–3.0 0.001 0.831 0.850 0.726
0.05 0.870 0.823 0.799
0.5 0.778 0.861 0.810
0.95 0.430 0.778 0.795
1.0–5.0 0.001 0.688 0.748 0.835
0.05 0.643 0.652 0.715
0.5 0.405 0.659 0.688
0.95 0.213 0.560 0.653
3.0–0.5 0.001 1.000 1.000 0.972
0.05 1.000 0.967 0.951
0.5 1.000 0.953 0.852
0.95 0.809 0.941 0.898
3.0–1.0 0.001 0.972 0.959 0.960
0.05 1.000 0.862 0.871
0.5 0.996 0.903 0.909
0.95 0.813 0.937 0.919
3.0–5.0 0.001 1.000 1.000 1.000
0.05 0.998 1.000 1.000
0.5 0.994 0.999 0.989
0.95 0.528 0.843 0.929
mutations with very small effects will either not over-shoot the optimum or have small enough fitness effects to be fixed by drift (Table 4A). Nevertheless, the effects on fitness were largest for the first enzyme, althoughDW
is approximately an order of magnitude lower than in the first phase (Table 4A). These patterns indicate that during the directional selection phase, adaptive sub-stitutions are fixed primarily in the first enzyme and neutral mutations occur in both phases of selection, but are fixed most frequently in downstream enzymes.
Pathways with intermediate to high reversibility (ai¼
0.5 or 0.95) yield a very different pattern. In particular, enzymes tend not to differ in either phase for number of substitutions or their effects on enzyme activity or fitness (Table 4). These results demonstrate that a fairly high degree of irreversibility is needed to cause upstream and downstream enzymes to differ in the properties of their associated fixed mutations.
The results for three properties of fixed mutations investigated are robust to the defined threshold be-tween the two phases of adaptive evolution (W.0.95 or
W . 0.99) and the distribution of mutational effects (results not shown). We analyzed three Gaussian dis-tributions with mutations skewed toward decreasing
enzyme function (m¼0.0,m¼ sk, andm¼ 2sk) and
found no effect on final distributions ofNm,DW, orDk1.
Evolution of control under the SK model: The saturation kinetics model contains one more parameter than the MCT model. Under saturation kinetics, when downstream enzymes have slower rates of reaction, there is the potential for the buildup of large pools of pathway intermediates. Because high concentrations of intermediates are likely to be deleterious, we follow Clark(1991) in introducing a fitness penalty for high substrate pools, represented by the parameter T (see
appendix). We first examine an exemplar set of
simulations for the two- and three-enzyme models in whichI¼T¼10,N¼1000,Jopt¼0.5,sJ¼0.05, and sk¼0.05 and then consider how the behavior of the
model changes as these parameters are varied. For simplicity, we again consider the case whereaiare the
same for alliand equal toa. Two hundred trials were run for the SK model for eacha-value, each trial beginning from a randomly chosen starting point (V1,V2).
The evolution of control in these exemplar simula-tions of two- and three-enzyme pathways yields patterns that are very similar to those exhibited by the MCT model (Table S6). In this model, Equation A12 with
Figure2.—Equilibrium distribution ofk
1,k2,k3for three-step MCT simulations. Optimal flux surface and equilibrium reaction rates from 200 replicate simulations of the three-enzyme MCT model are shown. Parameters are as described in Figure 1. Blue circles: equilibria for whichC1.C2,C3. Red circles: equilibria for whichC2.C1,C3. Purple circles: equilibria for whichC3.C1,
C2. (A)ai¼0.05. The optimal flux surface (grid lines) is divided into three regions, differently colored: purple corresponds to
v¼Joptdefines a line (two-enzyme pathway) or surface (three-enzyme pathway) of optimal flux corresponding to the set of enzyme maximal velocities,V1,V2,V3, that makes the reaction velocity equal to the optimum (blue curves in Figure 3, A and B, and surfaces in Figure 4). This line or surface is divided into distinct regions corresponding to control by the different enzymes (dashed line in Figure 3, A and B, and blue line in Figure 4A).
For both two- and three-enzyme pathways, our simu-lations yielded final values of theVithat lie on or very close to the line/surface of optimal flux (Figures 3 and 4, Figure S3, and Figure S4). Slight deviations from the surface largely reflect nearly neutral substitutions fixed by drift after a population has evolved very close to the optimum. However, the portion of the optimal line/ surface occupied depends on the reversibility of the reaction. This point is clearly illustrated for the two-enzyme model with low reversibilty: all points lie in the
C1.C2region because of the threshold on the size of substrate pools (Figure 3C), even though the optimal flux hyperbola extends into theC2. C1region (blue line, Figure 3A). Enzyme activity values on the optimum line/surface will produce very high intermediate sub-strate levels whenV2(or also possibly V3 in the three-enzyme pathway) is very close tov, makingV2–v(orV3–v) very small. Because the concentration of the intermedi-ate,B, is inversely proportional to V2 – v(and, in the three-enzyme pathway, intermediateCconcentration is
proportional toV3–v) (Equation A14), the intermedi-ate pool becomes very large and a strong fitness penalty is imposed. Thus, for largely irreversible reactions, fit-ness penalties associated with large pools of the in-termediate constrain the equilibrium to be in the region in which C1 . C2. If the penalty threshold T were greater, some trials would evolve to equilibria with enzyme 2 (or 3) exhibiting greatest control. However, unless Tis unreasonably large, a majority of trials will yield equilibria with enzyme 1 having greatest control.
With moderately to highly reversible reactions (a¼ 0.5 and 0.95), this constraint is absent (Figure 3D and Figure S3) and consequently the system evolves to equilibria that lie along the entire line/surface of optimal flux (Figures 3B and 4B, Figure S3, and Figure S4). In the two-enzyme pathway, approximately half the equilibria correspond toC1.C2and half toC2.C1; in the three-enzyme pathway, approximately one-third of the equilibria correspond to greatest control by each of the enzymes. Our interpretation of this result is as follows: in a reversible reaction, the net forward flux is countered by a backward flux, even if the intermediate pool is small. Consequently, to achieve a given optimal flux, theVimust be higher than when reactions are less reversible. This effect displaces the line/surface of optimal flux toward higher values ofV1,V2(Figure 3, A and B: blue lines shifted toward higherV1andV2with increasing reversibility) orV1,V2,V3(Figure 4, A and B: optimum surface shifted toward higherVi). Because of
Figure 3.—Equilibrium
distribution of V1 and V2 for two-step SK simulations. Equilibrium maximum reac-tion velocities (red circles) from 200 replicate simula-tions of the two-enzyme SK model are shown. Parame-ters are N ¼ 1000, sJ ¼ 0.05, sk ¼ 0.05, I ¼ T ¼ 10, and Jopt ¼ 0.5. Vectors are as in Figure 1. The dashed line represents combinations ofV1and V2 for which C1 ¼C2 derived from Equation A13. (A) ai ¼ 0.05. (B) ai ¼ 0.5. (C) ai ¼ 0.05. Contours of pool size of intermediate
this displacement, at all points along the line/surfaceV2 (andV3) is substantially larger than the actual fluxv(0.5 in this example). Consequently, V2 – v (and V3 – v) remains relatively large and the intermediate pool remains relatively small, avoiding the fitness penalty associated with high intermediate pools. In these examples, pools corresponding to the line/surface of optimal flux never exceed the threshold value of T
(Figures 3D and 4B, Figure S3, and Figure S4). There is thus no constraint preventing equilibria outside the region in which enzyme 1 exerts greatest control.
In summary, a bias favoring dominant control by enzyme 1 can arise in pathways with low reaction reversibility if there is a fitness penalty associated with large pools of intermediates. This penalty does not cause theVito deviate from the surface of optimal flux, but rather restricts the portion of that surface that corresponds to a high-fitness equilibrium. By contrast, this restriction greatly decreases in pathways with moderately or highly reversible reactions because re-versibility prevents large intermediate pools from building up. Consequently, all enzymes have a roughly equal chance of exerting predominant control over flux.
To assess the generality of these results, we performed simulations for different combinations of the values of the parametersa,Jopt,sk,sJ,I, andT. Simulations were
run in a factorial design varying all six parameters by at least two orders of magnitude, each with 25 replicates. We employed a restricted factorial design to avoid simulations run with unrealistic parameter values and decrease the computer running time of these simula-tions (for details see Table S7). The data were analyzed with an ANOVA, testing effects of single parameters and two-way interactions on the distribution of control.
Varying two parameters, sJ and I, had a significant
effect on the distribution of control (Table S7 and Table S8), but these effects are subtle and do not change the fundamental pattern: control coefficients evolve to be larger for upstream enzymes (Table S9 and Table S10). However, there were two instances in the three-enzyme case in which the second enzyme had the greatest control coefficient in the pathway:a¼0.95,sJ ¼0.01
andsJ¼0.01,I¼100 (Table S10). Additionally, there is
a third instance (I¼100,T¼100) in which control is quite evenly shared between all three enzymes. These three cases demonstrate that, for a few parameter combinations, control can evolve to be centered in a
Figure4.—Equilibrium distribution ofV1,V2,V3for three-step SK simulations. Optimal flux surface and equilibrium maximum
reaction velocities from 200 replicate simulations of the three-enzyme SK model are shown. Parameters are as described in Figure 3. Blue circles: equilibria for whichC1.C2,C3. Red circles: equilibria for whichC2.C1,C3. Purple circles: equilibria for which
downstream enzyme. Regardless, the fundamental evo-lutionary pattern for this model, and every other model investigated, is that control evolves to be centered in the most upstream enzyme.
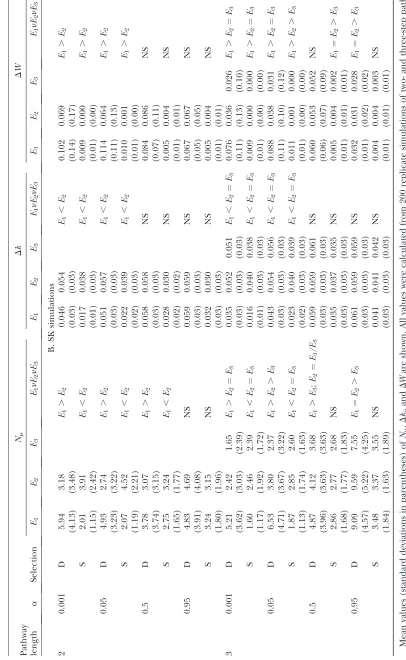
The three properties of mutations examined in this analysis,Nm,Dki, andDW, were similar for both the SK and MCT models (Table 4). For reactions with low reversibility, during the directional selection phase, most substitutions occurred in the first enzyme and the fitness effects of these substitutions were larger for the first enzyme, despite the fact that substitutions in downstream enzymes have a larger effect on enzyme activity (Table 4B). During the stabilizing selection phase, the last enzyme in the pathway accumulated the greatest number of mutations, and a substantial portion of these tended to have neutral or detrimental fitness effects (ai¼0.001: 2Epathway, 10.6%vs.55.0%;
3Epathway, 11.2%vs.49.6% and 60.8%) and were thus fixed by drift. These differences among enzymes were greatly reduced when reactions were largely reversible (Table 4B).
DISCUSSION
Evolution of control coefficients: The evolution of metabolic control has been the subject of much speculation. A number of different arguments have been put forward: (1) metabolic control is likely to be shared roughly evenly across enzymes in a pathway (Kacserand Burns1973); (2) control will shift between enzymes in a pathway and no one enzyme is expected to be more likely to have high control (Dykhuizenet al. 1987; Keightley 1989; Bost et al. 2001); and (3) control will be unequally shared and is likely to be highest for enzymes just below branch points because of fluctuating selection for allocation of flux along differ-ent branches (Eanes1999).
Our simulations lend little support to any of these arguments. For example, except when reactions are largely reversible, control is very unevenly shared among enzymes. The unequal distribution is a result of selection for control to be centered in a single enzyme and is not simply a consequence of the sum-mation property, as hypothesized by Bostet al. (2001). Our simulations find no evidence for constant shifts in control between enzymes (Dykhuizen et al. 1987; Keightley1989). This result hinges on the assumption of directionalvs.stabilizing selection; under directional selection to always increase flux, control will shift between enzymes, while we assumed stabilizing selec-tion because a pathway’s flux will eventually be inhibited at some rate. Under stabilizing selection, the strong tendency for the most upstream enzyme to gain pre-dominant control tends to prevent frequent shifts in control among enzymes and means that most enzymes have a greatly reduced chance of exercising major control. Finally, we are cautious about extending our
conclusions concerning linear pathways to separate branches of a branching pathway. We believe additional research focused on branching pathways needs to be conducted to fully address this question. Nevertheless, to the extent that this is possible, our results suggest that fluctuating selection on allocation between branches is not necessary for the evolution of major control by the most upstream enzyme in a pathway branch.
Our analysis does reveal, however, two properties of control that are expected to evolve, at least in linear pathways, when stabilizing selection acts on pathway flux and reactions have low reversibility: (1) metabolic control will be concentrated in one or a few enzymes and (2) control tends to be located in upstream en-zymes. These are general properties of the system that evolve under a large range of parameter values and regardless of whether enzymes are assumed to be saturated or unsaturated.
In the MCT model, these patterns result from two interacting properties. The first is that a very large portion of the (k1, k2,. . .,) phenotypic space corre-sponds to greater control for upstream enzymes (e.g., Figure 1A). The second factor arises when comparing mutations of equivalent magnitude on enzyme kinetic properties in enzymes with small and large control coefficients. A beneficial mutation will more likely fix in the enzyme with greatest control, because it will have a greater effect on flux and hence on fitness. Thus, the initial biased distribution of control in upstream en-zymes is maintained and intensified by this biased distribution of beneficial mutations.
These same patterns arise for different reasons under the SK model. In our examples, the regions of the line/ surface of optimal flux in which the different enzymes exert dominant control are roughly equal in size. Ran-dom starting points thus have a roughly equal proba-bility of corresponding to dominant control of a specific enzyme. Instead, a fitness penalty associated with large intermediate pools differentially penalizes downstream enzymes and prevents them from evolving to exert dominant control.
intermediate pools in the SK model is likely to be seen in the MCT model as well.
Expected and observed bias in control: Our simu-lations indicate that reaction reversibility, a, has the greatest influence on the degree of bias among enzymes in flux control. As shown in theappendix, the value ofa for a particular reaction is directly related to the equilibrium constant for the reaction; i.e.,a ¼1/Keq. BecauseKeqis athermodynamicproperty of the reaction [it is determined by the difference in free energy between products and reactants (Nelsonand Cox 2000)],a is not influenced by the kineticproperties of the enzyme associated with that reaction. Because, unlike kinetic properties, thermodynamic properties cannot evolve, the extent of bias in control is seta priori by intrinsic chemical and physical properties of the reactions.
Whether in general one would expect to see sub-stantial bias in control thus depends on whether metabolic reactions tend to be reversible or irreversible. Equilibrium constants have been measured for many enzymatic reactions and they overwhelmingly tend to be large, indicating irreversibility. For example, the trypto-phan biosynthetic pathway has equilibrium constants ranging from 7.63108to 9.231012, corresponding to
a-values much less than the a ¼ 0.001 used in our simulations (Kishore et al. 1998). Two additional studies (Tewariet al. 2002a,b) of metabolic pathways found that the majority ofKeq’s measured are.108, and only two reactions had smaller equilibrium constants (e.g.,Keq¼1.7 and 4.6, corresponding toa¼0.59 and 0.22, respectively). Although these examples do not constitute an exhaustive survey, they indicate that for many biochemical pathways, if not most, reactions are largely irreversible, and therefore the bias toward high CC in upstream enzymes predicted by our model should often be found. Given that most estimated values ofa
are several orders of magnitude smaller than the small-est value (0.001) used in our simulations, we would expect this bias to be substantially stronger than what we found (e.g., Table 2).
Evaluating agreement between the predictions of our model and patterns of flux control in real pathways is complicated by the fact that most pathways are not strictly linear. Instead, they are often branched or cyclical, and it is not clear whether and how predictions from our model carry over to such pathways. Nevertheless, a literature survey of linear and nearly linear metabolic pathways provides strong support for our first conclusion that control is distributed unequally in pathways and mar-ginal support for the second claim that control should be vested in upstream enzymes. In 13 control analysis studies, all but one (Wisniewski et al. 1995), demon-strated significant evidence for nonuniform distributions of control (Groen et al. 1986; Dykhuizen et al. 1987; Albeand Wright 1992; Hillet al. 1993; Kashiwaya
et al.1994;van derVLAGet al.1995; Rousselet al.1998; Thomasand Fell1998; Bostet al.2001; Cronwright
et al.2002; Pritchardand Kell2002; Wuet al.2004). These studies are sampled across a broad spectrum of organisms and metabolic pathways. Half of them focused on the glycolysis pathway, but other pathways included the tricarboxylic acid cycle, the oxidative phosophoryla-tion pathway, gluconeogenesis, lactose catabolism, and the succinate pathway.
Our second prediction, that upstream enzymes tend to evolve larger CCs than downstream enzymes, is less well supported. Five studies provided strong support for this prediction: results indicated that the first enzyme had the highest control coefficient (Groen
et al.1986; Dykhuizenet al.1987; Rousselet al.1998; Cronwrightet al.2002; Pritchard and Kell 2002). Pritchard and Kell’s (2002) analysis of the entire glycolysis pathway indicates that the two most upstream enzymes exhibit the majority of control in this pathway. By contrast, five investigations found that an enzyme either in the center of the metabolic pathway (Albeand
Wright1992; Kashiwaya et al.1994; van derVLAG
et al.1995; Thomasand Fell1998) or at the end of the pathway (Wisniewskiet al.1995) exerted the majority of control.
It should be noted that our analysis does not predict that downstream enzymes will never exhibit the greatest flux control. Even with low reaction reversibility (a¼ 0.001 or 0.05), 5–25% of our simulations evolved to equilibria at which the highest CC corresponded to an enzyme downstream of the first enzyme in the pathway. Moreover, our simulations of shifting optima revealed that pathways with control centered in the most up-stream enzyme can evolve majority control in another enzyme and that there is a low, but not insignificant, probability that at any given time, a downstream enzyme will exert majority control. It is thus not surprising that examples exist in which control is vested in downstream enzymes. The real question is whether this situation is as common as the reverse. Although the slight bias in these studies toward control being exerted in upstream enzymes is consistent with our expectation, this small sample clearly does not provide sufficient evidence to either support or refute the prediction that control should most commonly be vested in upstream enzymes.
Our analyses confirm the operation of this principle. In both the MCT and the SK models, when reactions are largely irreversible and the distribution of control is the most inequitable between enzymes, most substitutions, as well as substitutions with the largest effect on fitness, occur in upstream enzymes during adaptive walks toward an optimal flux. However, this pattern reverses, such that the majority of substitutions occur in down-stream enzymes, as the population nears the optimum. Moreover, many substitutions fixed in this phase appear to be nearly neutral (Ohta 1973; Kimura 1983). This shift occurs because near the optimum most mutations are deleterious and because substitutions in down-stream enzymes have smaller effects on fitness because of their reduced control. Consequently, a mutation with a given effect on enzyme activity will have a smaller detrimental effect, and thus a greater probability of being fixed by drift, when it occurs in a downstream enzyme. Some adaptive substitutions continue to be fixed, however, as compensation for slightly deleterious substitutions, and these occur preferentially in the upstream enzymes. To summarize, the difference in con-trol causes upstream enzymes to be subject to strong directional selection during the first phase of an adaptive walk and to purifying selection during the second.
The distribution of substitutions among genes within metabolic pathways has been investigated in three systems of which we are aware. The anthocyanin path-way is a linear pathpath-way composed of six enzymes that produce pigments involved in flower coloration across angiosperms. Three studies of molecular evolution in the anthocyanin pathway, looking at broad and narrow phylogenetic scales (between three angiosperm families and within the genus Ipomea), found that upstream enzymes had the lowest rates of substitution and the downstream enzymes had the greatest rates of sub-stitution (Rausheret al.1999, 2008; Luand Rausher 2003). These studies found no evidence of positive selection, suggesting that most substitutions were of neutral or slightly disadvantageous mutations. To the extent that these substitutions were disadvantageous, this pattern is consistent with expectations under our model: because of reduced flux control, mutations that cause deviation from the flux optimum are more likely to have smaller effects on fitness in downstream enzymes and are thus more likely to be fixed by genetic drift (Hedrick 2000). An independent study of four terpenoid biosynthesis pathways obtained similar re-sults: a strong correlation between elevated rates of substitution and downstream enzyme position (Ramsay
et al. 2009). This study finds that the elevated rates of substitution in downstream enzymes are, at least partly, caused by relaxed selection in the downstream enzymes, a pattern consistent with the expectations of our model. Tests for positive selection at a broad phylogenetic scale (between angiosperm families) found significant effects for multiple genes distributed between up- and
downstream positions of the pathways. Ramsay et al. (2009) conclude that decreased pleiotropy in down-stream genes resulted in relaxed selection on these enzymes; however, our model provides another explana-tion: the control of downstream enzymes is greatly reduced compared to upstream enzymes and they accumulate many more neutral or nearly neutral mutations.
An additional study by Flowers et al.(2007) exam-ined rates of molecular evolution in Drosophila for 17 metabolic enzymes in five pathways (glycolytic, gluco-neogenic, glycogenic, trehalose, and pentose shunt) that intersect at the glucose-6-phosphate enzyme. This study found a strong signature of adaptive evolution on theD. melanogasterandD. simulanslineages. The three enzymes that showed statistically significant elevated rates of adaptive evolution are all upstream enzymes occurring at the branch points between pathways. Flowerset al. (2007) interpret this pattern as arising from fluctuating selection on the relative magnitudes of flux on different branches. However, this pattern may also be consistent with our model’s prediction that adaptive substitutions will be concentrated in the most upstream enzyme of a terminal linear pathway, if the evolution of a pathway branch behaves similarly to the evolution of the linear pathways described here. This issue will be resolved, however, only by examining the evolution of control in branched pathways.
Conclusion: We present population genetic models of the evolution of metabolic pathway flux to investigate whether predictions can be made about whether differ-ent genes in a pathway will be differdiffer-entially involved in the process of adaptation. Although the models pertain only to linear pathways, they indicate that there are likely to be strong differences among enzymes in the numbers and types of substitutions they accumulate. While the extent to which the specific predictions of our model may be extended to pathways with more complex topology is unclear, the fact that our model generates strong patterns of bias suggests that similarly strong, though perhaps different, patterns may be expected in more complicated pathways. We suggest that the ap-proaches presented here will be useful for examining these more complex situations.
We thank the Rausher lab group, Frederik Nijhout, Kristi Montooth, and one anonymous reviewer for many insightful comments on the manuscript. This work was supported by National Science Foundation grant DEB-0448889 to M.D.R.
LITERATURE CITED
Albe, K. R., and B. E. Wright, 1992 Systems analysis of the tricar-boxylic acid cycle in Dictyostelium discoideum. II. Control anal-ysis. J. Biol. Chem.267:3106–3114.
Bagheri, H. C., and G. P. Wagner, 2004 Evolution of dominance in metabolic pathways. Genetics168:1713–1735.
Clark, A. G., 1991 Mutation-selection balance and metabolic con-trol theory. Genetics129:909–923.
Cornish-Bowden, A., 1989 Metabolic control theory and biochem-ical systems theory: different objectives, different assumptions, different results. J. Theor. Biol.136:365–377.
Cronwright, G. R., J. M. Rohwerand B. A. Prior, 2002 Metabolic control analysis of glycerol synthesis in Saccharomyces cerevisiae. Appl. Environ. Microbiol.68:4448–4456.
Dykhuizen, D. E., A. M. Deanand D. L. Hartl, 1987 Metabolic flux and fitness. Genetics115:25–31.
Eanes, W. F., 1999 Analysis of selection on enzyme polymorphisms. Annu. Rev. Ecol. Syst.30:301–326.
Fisher, R. A., 1930 The Genetical Theory of Natural Selection.Oxford University Press, Oxford.
Flowers, J. M., E. Sezgin, S. Kumagai, D. D. Duvernell, L. M. Matzkinet al., 2007 Adaptive evolution of metabolic pathways in Drosophila. Mol. Biol. Evol.24:1347–1354.
Groen, A., C. van Roermund, R. Vervoorn and J. Tager, 1986 Control of gluconeogenesis in rat liver cells. Biochem. J.237:379–389.
Hartl, D. L., D. E. Dykhuizenand A. M. Dean, 1985 Limits of adaptation: the evolution of selective neutrality. Genetics111: 655–674.
Hedrick, P. W., 2000 Genetics of Populations.Jones & Bartlett, Boston. Heinrich, R., and T. A. Rapoport, 1974 A linear steady-state
treat-ment of enzymatic chains. Eur. J. Biochem.42:89–95. Heinrich, R., and S. Schuster, 1998 The modelling of
meta-bolic systems. Structure, control and optimality. Biosystems47: 61–77.
Heinrich, R., S. Schuster and H. Holzhutter, 1991 Mathe-matical analysis of enzymic reaction systems using optimization principles. Eur. J. Biochem.201:1–21.
Heinrich, R., F. Montero, E. Klipp, T. G. Waddelland E. Melendez -Hevia, 1997 Theoretical approaches to the evolutionary optimi-zation of glycolysis. Eur. J. Biochem.243:191–201.
Hill, S. A., J. H. Bryceand C. J. Leaver, 1993 Control of succinate oxidation by cucumber (Cucumis sativus L.) cotyledon mito-chondria. Planta190:51–57.
Hoekstra, H. E., and J. A. Coyne, 2007 The locus of adapta-tion: Evo Devo and the genetics of adaptation. Evolution 61: 995–1016.
Kacser, H., and J. A. Burns, 1973 The control of flux. Symp. Soc. Exp. Biol.27:65–104.
Kacser, H., and J. A. Burns, 1981 The molecular basis of domi-nance. Genetics97:639–666.
Kashiwaya, Y., K. Sato, N. Tsuchiya, S. Thomas, D. A. Fellet al., 1994 Control of glucose utilization in working perfused rat heart. J. Biol. Chem.269:25502–25514.
Keightley, P. D., 1989 Models of quantitative variation of flux in metabolic pathways. Genetics121:869–876.
Keightley, P. D., 1996a Metabolic models of selection response. J. Theor. Biol.182:311–316.
Keightley, P. D., 1996b A metabolic basis for dominance and reces-sivity. Genetics143:621–625.
Kimura, M., 1983 The Neutral Theory of Molecular Evolution. Cam-bridge University Press, CamCam-bridge, UK.
Kishore, N., Y. B. Tewari, D. L. Akers, R. N. Goldberg and E. WilsonMiles, 1998 A thermodynamic investigation of re-actions catalyzed by tryptophan synthase. Biophys. Chem.73: 265–280.
LaPorte, D. C., K. Walshand D. E. J. Koshland, 1984 The branch point effect. Ultrasensitivity and subsensitivity to metabolic con-trol. J. Biol. Chem.259:14068–14075.
Lu, Y., and M. D. Rausher, 2003 Evolutionary rate variation in an-thocyanin pathway genes. Mol. Biol. Evol.20:1844–1853. Mazat, J., C. Rederand T. Letellier, 1996 Why are most flux
con-trol coefficients so small? J. Theor. Biol.182:253–258. Nelson, D. L., and M. M. Cox, 2000 Lehninger Principles of
Biochem-istry.Worth Publishers, New York.
Ohta, T., 1973 Slightly deleterious mutant substitutions in evolution. Nature246:96–98.
Orr, H. A., 1998 The population genetics of adaptation: the distri-bution of factors fixed during adaptive evolution. Evolution52: 935–945.
Orr, H. A., 2002 The population genetics of adaptation: the adap-tation of DNA sequences. Evolution56:1317–1330.
Orr, H. A., 2003 The distribution of fitness effects among beneficial mutations. Genetics163:1519–1526.
Orr, H. A., 2005 The genetic theory of adaptation: a brief history. Nat. Rev. Genet.6:116–127.
Phadnis, N., and J. D. Fry, 2005 Widespread correlations between dominance and homozygous effects of mutations: implications for theories of dominance. Genetics171:385–392.
Pritchard, L., and D. B. Kell, 2002 Schemes of flux control in a model of Saccharomyces cerevisiae glycolysis. Eur. J. Biochem. 269:3894–3904.
Ramsay, H., L. H. Riesebergand K. Ritland, 2009 The correlation of evolutionary rate with pathway position in plant terpenoid bio-synthesis. Mol. Biol. Evol.26:1045–1053.
Rausher, M. D., R. E. Millerand P. Tiffin, 1999 Patterns of evo-lutionary rate variation among genes of the anthocyanin biosyn-thetic pathway. Mol. Biol. Evol.16:266–274.
Rausher, M. D., Y. Luand K. Meyer, 2008 Variation in constraint versus positive selection as an explanation for evolutionary rate variation among anthocyanin genes. J. Mol. Evol.67:137–144.
Roussel, R., P. G. Carlier, J. Robert, G. Velho and G. Bloch, 1998 13 C/ 31 P NMR studies of glucose transport in human skeletal muscle. Proc. Natl. Acad. Sci. USA95:1313–1318. Savageau, M. A., 1976 Biochemical Systems Analysis: A Study of
Func-tion and Design in Molecular Biology.Addison-Wesley, Reading, MA. Savageau, M. A., 1992 Dominance according to metabolic control analysis: Major achievement or house of cards? J. Theor. Biol. 154:131–136.
Savageau, M. A., and A. Sorribas, 1989 Constraints among molec-ular and systemic properties: implications for physiological ge-netics. J. Theor. Biol.141:93–115.
Stern, D. L., and V. Orgogozo, 2008 The loci of evolution: How predictable is genetic evolution? Evolution62:2155–2177. Szathmary, E., 1993 Do deleterious mutations act synergistically?
Metabolic control theory provides a partial answer. Genetics 133:127–132.
Tewari, Y. B., P. Y. Jensen, N. Kishore, M. P. Mayhew, J. F. Parsons et al., 2002a Thermodynamics of reactions catalyzed by PABA synthase. Biophys. Chem.96:33–51.
Tewari, Y. B., R. N. Goldberg, A. R. Hawkins and H. K. Lamb, 2002b A thermodynamic study of the reactions: {2-dehydro-3-deoxy–arabino-heptanoate 7-phosphate(aq)¼3-dehydroquinate(aq) 1 phosphate(aq)} and {3-dehydroquinate(aq)¼ 3-dehydroshiki-mate(aq)1H2O(l)}. J. Chem. Thermodyn.34:1671–1691. Thomas, S., and D. A. Fell, 1998 A control analysis exploration of
the role of ATP utilisation in flux control and glycolytic-metabolite-concentration regulation. Euro. J. Biochem. 258: 956–967.
van derVlag, J., R.van’tHof, K. vanDamand P. W. Postma, 1995 Control of glucose metabolism by the enzymes of the glu-cose phosphotransferase system in Salmonella typhimurium. Eur. J. Biochem.230:170–182.
Watt, W. B., and A. M. Dean, 2000 Molecular-functional studies of adaptive genetic variation in prokaryotes and eukaryotes. Annu. Rev. Genet.34:593–622.
Wisniewski, E., F. N. Gellerichand W. S. Kunz, 1995 Distribution of flux control among the enzymes of mitochondrial oxidative phosphorylation in calcium-activated saponin-skinned rat mus-culus soleus fibers. Eur. J. Biochem.230:549–554.
Wu, L., W. Wang, W. A. VanWinden, W. M. VanGulikand J. J. Heijnen, 2004 A new framework for the estimation of control parameters in metabolic pathways using lin-log kinetics. Eur. J. Biochem. 271: 3348–3359.
APPENDIX
We describe the details of the models used in our analysis.
Metabolic Control Theory Model
Specification of flux control: Here we provide model details for the three-enzyme pathway. Equations for other pathway lengths are analogous.
MCT demonstrates that the equilibrium flux,J, is given by
J¼ I
½1=k11a1=k21a1a2=k3
; ðA1Þ
wherekiis the rate of the forward reaction of enzymeiandki¼Vi/Mi, the ratio of the enzyme’s maximum rate of production and the Michaelis–Menten constant (Kacserand Burns1973).aiis a thermodynamic parameter equal to the reversibility of the catalyzed reactionai¼ki/ki ¼1/Keq, and Keq is the equilibrium constant of the reaction (Kacserand Burns1973). Iis the concentration of the input substrate and we assume that the input substrate is maintained at a constant level by physiological buffering and that the final product is sequestered as soon as it is produced, so that there is no reverse reaction for the final step (i.e.,k3¼0). These are simplifying assumptions of
our model, whereas the Kacserand Burns(1973) presentation of MCTexplicitly allows for variation in pathway input and final products.
The flux control coefficient for enzymei, Ci, is defined as the proportional change in flux caused by a unit proportional change in enzyme activity;i.e.,
Ci¼
@J=J @ki=ki
¼ @J
@ki ki
J: ðA2Þ
MCT demonstrates that the flux control coefficient for enzymeiis determined by the kinetic and thermodynamic properties of the enzymes (thek’s and thea’s) by the relationship
Ci¼ 1
ki
Pij¼10ðajÞ
h i
1=k11a1=k21a1a2=k3
½ ðA3Þ
(Kacserand Burns1973). Because this parameter has the property thatPiCi¼1, each coefficient represents the proportional control of the corresponding enzyme over the total flux.
Specification of selection: To estimate the probability of fixation of any mutation, it is necessary to know the selection coefficient, s, associated with that mutation. In our model, we assume that fitness is maximal at some optimal flux,Jopt, and declines monotonically as flux deviates from that optimum. Specifically, we represent fitness for fluxJby
WðJÞ ¼exp ðJJ
2 optÞ sJ
!
; ðA4Þ
wheresJis a scaling constant representing the strength of stabilizing selection.
We represent a homozygote genotype,G, by a vector of reaction rates, (k1,k2,k3). The fitness of this genotype,W(G) is then determined by first determining the flux associated with the vector of reaction rates (using Equation A1) and then determining the fitness associated with that flux (using Equation A4). Any mutation is assumed to alter only one of the rates of reaction. Without loss of generality, consider a mutation that changes k1 to k19, so that the new homozygous genotype, G9, has the vector of reaction rates (k19, k2, k3). The fitness of this genotype, W(G9), is calculated in similar fashion. The selection coefficient associated with the mutant is thens¼[W(G9) –W(G)]/W(G)if the mutation is advantageous ands¼[W(G) –W(G9)]/W(G)if the mutation is disadvantageous.
Probability of substitution:A bout of evolution begins with an initial genotype,G. The initial reaction rates (k1,k2,
k3) are independently drawn from a uniform random distribution varying between 0.0 and 1.0. A mutation,
corresponding to genotypeG9, is introduced that modifiesk1,k2, ork3with equal probability, with the magnitude of the change inkdetermined by drawing from a normal probability distribution with a mean of 0 and a standard deviation ofsk. This assumes that each enzyme has the same mutational target size. Once the fitnesses ofGandG9are
u¼ 1e
s
1e2Ns
for an advantageous allele and
u¼1 1e
ð2N1Þs
1e2Ns
¼ s
e2Ns1 ðA5Þ
for a disadvantageous allele (Hedrick2000). These equations assume that there is no dominance,i.e., that the fitness of the heterozygote is the average of the homozygote fitnesses. Because the overall reaction rate in a heterozygote is likely to be the sum of the rates for each individual allele, the assumption of no dominance at the kinetic levelis probably appropriate. Moreover, unless the effects of mutation are very large, absence of dominance at the kinetic level is not expected to generate dominance in flux (Keightley1996b). This in turn means that the fitness of the heterozygote will be approximately the average of the two homozygote fitnesses, because fitness changes approximately linearly with flux if mutations are not large. It thus seems that the assumption of no dominance in fitness is reasonable to a first approximation.
The mutation is fixed or not according to the probabilities in Equation A5, completing one mutation–fixation cycle. Another mutation is then introduced and its fitness and probability of fixation are determined as previously. Each evolutionary bout consisted of 50,000 mutation–fixation cycles to ensure flux reached an evolutionary equilibrium. This corresponds to 1.7 million generations for a three-step pathway assuming an effective population size of 1000 and a per gene mutation rate of 105. At the end of the bout, CCs are calculated from the finalkiusing Equation A3.
In addition to simulating complete trajectories, we estimated a vector field of ‘‘instantaneous’’ trajectories, for the two-enzyme case, by repeated single mutation–fixation cycles from the same starting combination of ki. All combinations ofk1¼(0.05, 0.15, 0.25,. . ., 0.95) andk2¼(0.05, 0.15, 0.25,. . ., 0.95) were used as starting points, and for each starting point, the fate of 10,000 mutations was determined. The average vector (Dk1,Dk2), including 0’s for mutations that were not fixed, at a starting point was taken to represent the estimated instantaneous trajectory at that point in the (k1,k2) space. It should be noted that this vector does not represent the actual trajectory any particular population will follow, since a single mutation changes eitherk1ork2, but not both. Rather, it indicates the relative probability that the rates of the first and second enzymes will change and by how much on average.
Evolution of control coefficients in a shifting environment:We modeled the evolution of control for a two-step metabolic pathway in a changing environment. An initial optimal flux was chosen, which yields an equilibrium curve of possible initialk-value combinations (see below). Twenty evenly dispersed points along this curve were then chosen to generate initial (k1,k2) values for simulation. Ten of these points corresponded to a higher CC for the first enzyme, while the other 10 corresponded to a higher CC for the second enzyme. For each replicate, evolution was allowed to proceed for 180,000 mutation–fixation cycles. After 30,000 cycles, the flux optimum was shifted to a second value, and after 60,000 cycles it shifted back to the original value to complete one flux cycle. This flux cycle was then repeated two more times. At the end of the 180,000 mutation cycles we recorded the final values ofk1,k2,C1, andC2.
Saturation Kinetics Model
An irreversible reaction under saturation kinetics can be described as
½S1E%k1 k1
ES/k2½P1E:
The equilibrium rate of reaction,v, is described by the Michaelis–Menten equation
v¼ Vmax½S
Km1½S; ðA6Þ
whereVmaxis the maximum rate of reaction, [S] is the substrate concentration, and the Michaelis–Menten constant,
Km¼k21k1/k1(Segel1993). A reversible enzyme reaction under saturation kinetics can be described as ½S1E%k1
k1
ES%k2 k2
½P1E:
v¼Vmaxf ð½S=KmsÞ Vmaxr ð½P=KmpÞ
11ð½S=KmsÞ1ð½P=KmpÞ ; ðA7Þ
where
Kms¼k21k1
k1 Kmp¼
k21k1 k2
(Segel1993).
To simplify our analysis, we assume thatk1¼k2. Definingaas the ratio of the reverse to the forward reaction,a¼
k1/k1, and then for the irreversible reactionKm¼11a, and for the reversible reactionKms¼11a,Kmp¼11a/a. Additionally, we can define the relationship between the forward and reverse rates of reaction asVmaxr¼aVmaxf.
In a three-step pathway with the first two steps being reversible and the last step being irreversible,
A%E1 B%E2 C/E3 D;
flux through the three parts of the pathway is represented by three equations:
v1¼ V1ðAa
2 BÞ
ð11aÞð11aB=11aÞ1A
v2¼V2 ðBa 2CÞ
ð11aÞð11aC=11aÞ1B
v3¼V3C
1 1a1C: ðA8Þ
Here we assume thatais the same for the first two steps in the pathway to make our results comparable to the MCT simulations. For the last, irreversible, step in the pathwaya¼0. At flux equilibrium, these three velocities are equal;
i.e.,v1¼v2¼v3¼v. Because, as in the MCT analysis, we assume that the concentration of the initial substrateAis constant, this is a set of three equations in three unknowns (B,C, andv), which were solved numerically for the unknowns. An analytical solution is also presented below (Equation A12) and there is a close match between the two methods (Figure 2, A–C).
Simulations were initialized with random values of maximum enzyme velocities,V1,V2, andV3. Under this model, very high concentrations of intermediatesBandCcan accumulate, depending on the values of the kinetic properties of the enzymes. Because high concentrations of intermediates are likely to be deleterious, we follow Clark(1991) in introducing a fitness penalty for high substrate pools. In particular, we introduce a parameterT, which represents the intensity of selection against substrate accumulation. We then model fitness as
WðJ;TÞ ¼WðJÞ ½B1½C
½B1½C1T WðJÞ
;
where the functionW(J) is the same as in Equation A4. Under this formulation, when [B]1[C] is small relative toT, fitness is approximately that given by Equation A4. However, when [B]1[C] is large relative toT, fitness approaches 0. Imposing a threshold does not change the optimum fitness value, but only increases the sharpness of the adaptive landscape.
As previously, pathways evolve under this model by a series of mutation–fixation cycles. First, one of the enzymes is chosen randomly and its reaction rate,V, is changed by an increment that is normally distributed with a mean of 0 and a standard deviation ofsk. The fitness of each new mutation is calculated, as are the selection coefficient and
probability of fixation, in the same manner as described for the MCT model. This mutation–fixation cycle is then repeated 20,000 times to complete one bout of evolution. This corresponds to 680,000 generations for a three-step pathway assuming an effective population size of 1000 and a per gene mutation rate of 105.