DOI: 10.1534/genetics.104.031153
Accuracy and Power of Statistical Methods for Detecting Adaptive Evolution in
Protein Coding Sequences and for Identifying Positively Selected Sites
Wendy S. W. Wong,*
,1Ziheng Yang,
†Nick Goldman
‡and Rasmus Nielsen*
,§*Department of Biological Statistics and Computational Biology, Cornell University, Ithaca, New York 14850,†Department of Biology, University College London, London WC1E 6BT, United Kingdom,‡European Bioinformatics Institute, Wellcome Trust
Genome Campus, Hinxton, Cambridge, CB10 1SD, United Kingdom and§Center for Bioinformatics, University of Copenhagen, Copenhagen 2100 Kbh Ø, Denmark
Manuscript submitted May 12, 2004 Accepted for publication June 23, 2004
ABSTRACT
The parsimony method ofSuzukiandGojobori(1999) and the maximum likelihood method developed
from the work ofNielsenandYang(1998) are two widely used methods for detecting positive selection in
homologous protein coding sequences. Both methods consider an excess of nonsynonymous (replacement) substitutions as evidence for positive selection. Previously published simulation studies comparing the performance of the two methods show contradictory results. Here we conduct a more thorough simulation study to cover and extend the parameter space used in previous studies. We also reanalyzed an HLA data set that was previously proposed to cause problems when analyzed using the maximum likelihood method. Our new simulations and a reanalysis of the HLA data demonstrate that the maximum likelihood method has good power and accuracy in detecting positive selection over a wide range of parameter values. Previous studies reporting poor performance of the method appear to be due to numerical problems in the opti-mization algorithms and did not reflect the true performance of the method. The parsimony method has a very low rate of false positives but very little power for detecting positive selection or identifying positively selected sites.
M
UCH attention has recently been devoted to the mony reconstruction of ancestral sequences, and an ex-detection of positive selection on protein-coding cess of nonsynonymous substitutions is tested indepen-DNA sequences in molecular evolutionary genomics dently for each site. The two methods differ in thatFitch(e.g.,Swansonand Vacquier2002;Bernatchez and et al. (1997) (see alsoBush et al. 1999) first estimated
Landry2003;Choisyet al. 2004). The most commonly the average dN/dS ratio along the sequence and then
used criterion for detecting positive selection in protein- compared the nonsynonymous/synonymous rate ratio coding genes is to compare the nonsynonymous rate at each site against this average, whileSuzukiand Gojo-(dN) with the synonymous rate (dS). When the rate ratio bori(1999) compared thedN/dSratio at each site
inde- ⫽dN/dS⬎1, the nonsynonymous rate is greater than pendently against the neutral expectation 1. TheSuzuki the synonymous rate and this is interpreted as evidence andGojobori (1999) method is implemented in the for the action of positive selection. Adaptsite computer program ofSuzukiet al. (2001).
Several methods have been proposed for detecting if Goldman andYang(1994) andMuseandGaut a protein is experiencing an excess of nonsynonymous (1994) were the first to develop codon-based models for substitution or elevated values of. The most popular likelihood estimation of.Nielsen and Yang (1998) methods are parsimony methods (Fitch et al. 1997; andYanget al. (2000) extended these methods to allow Bushet al. 1999;SuzukiandGojobori1999) and maxi- variation inamong sites, thereby providing a more pow-mum likelihood methods (Nielsen and Yang 1998; erful framework for detecting positive selection when sites Yanget al. 2000). Using these methods, numerous genes undergoing positive selection are interspersed among have been identified to be evolving under the influence sites dominated by negative selection. They suggested of positive selection (e.g., Yang and Bielawski 2000; the use of an empirical Bayes approach for identifying
Liberleset al. 2001;LiberlesandWayne2002). putatively positively selected sites in genes that have
Parsimony methods were independently developed been demonstrated to undergo positive selection. In
byFitchet al. (1997) andSuzukiandGojobori(1999). the approach ofNielsenandYang(1998), a (neutral)
In these methods, substitutions are inferred using parsi- model (model M1) allowing only two categories of sites,
with ⫽1 and ⫽0, is compared using a likelihood ratio test (LRT) with a (selection) model (M2), which 1Corresponding author:Department of Biological Statistics and
Com-allows an additional category of positively selected sites putational Biology, Cornell University, Ithaca, NY 14850.
E-mail: [email protected] with ⬎1. If M1 (neutral) can be rejected in favor of
M2 (selection), positive selection is inferred. Several hood and parsimony methods for identifying amino acid sites under positive selection using a data set of human similar but more-realistic models were implemented by
Yanget al. (2000). One commonly used pair involves a leukocyte antigen (HLA) alleles. Performance was eval-uated by examining the number and location, relative to null model (M7) in whichwas assumed to be
beta-dis-tributed among sites and an alternative selection model the antigen recognition site (ARS), of amino acid resi-dues inferred to be under positive selection. The au-(M8), which allows an extra category of positively selected
sites. The likelihood methods are implemented in the thors discussed a number of problems in the likelihood approach and concluded that it was inferior to the parsi-codeml program in the PAML package (Yang 1997).
The likelihood method in its current form proposes mony method using reconstructed ancestral sequences. Those results contrast sharply with the analysis of a simi-a two-step procedure in which simi-an LRT is first used to
test for positive selection in a gene as a whole. If this lar HLA data set byYangandSwanson(2002), in which the likelihood results were biologically sensible. test indicates statistical evidence for the presence of a
proportion of sites evolving under positive selection, iden- Since the results shown in different studies have been contradictory, we have conducted a new and more com-tification of putative positively selected sites can then
proceed (Nielsen and Yang 1998; Yang et al. 2000). prehensive simulation study to determine the reliability and power of the parsimony and maximum likelihood In contrast, the parsimony method in the Suzukiand
Gojobori (1999) implementation has been proposed methods. We examine the performance of both methods
in answering two questions: (i) Is a gene under positive as a test for individual sites. If one’s interest is to
de-tect positive selection in a gene and multiple sites are selection or does it have any sites under positive selec-tion? and (ii) Which sites in a gene are under positive analyzed, a correction for multiple testing is therefore
needed. We wish here to distinguish between the two selection? different inferential problems of testing for positive
se-lection in a particular gene or section of a gene and of
MATERIALS AND METHODS predicting which sites are most likely to be under
posi-tive selection. Likelihood and parsimony methods for detecting positive A number of simulation experiments have been per- selection: In the maximum likelihood method, site-specific formed to study various aspects of the parsimony and like- models M1 (neutral), M2 (selection), M7 (beta), M8 (beta&; NielsenandYang1998;Yanget al. 2000), and M8a (beta& lihood methods for detecting positive selection in
pro- ⫽ 1;Swanson et al. 2003) were used with codeml in the tein-coding genes.Anisimovaet al. (2001, 2002) studied
PAML 3.13 package (Yang2000b). Model M1 (neutral) allows
the likelihood method. They concluded that the accu- two classes of sites with
0⫽0 and 1⫽ 1 in proportions
racy and power of the LRT and of the Bayes identifica- p
0and p1⫽1⫺ p0, respectively. Model M2 (selection) has tion of sites under positive selection depend on the an additional class with2, which takes on any nonnegative
value, and applies to a proportionp2of sites, now with the
data. Both accuracy and power are low when the data
constraintp0⫹p1⫹p2⫽1. We test for positive selection by
contain only a few highly similar sequences or when
comparing twice the log-likelihood difference between M1 selection is weak. Overall, the method was found to have and M2 with a2
2distribution in the LRT (Yanget al. 2000).
good accuracy and power in data sets of moderate or Model M7 (beta) assumes a-distribution for 0ⱕ ⱕ1. Model large sizes (for example, forⵑ15 or more sequences). M8 (beta&) adds to M7 an extra category, with proportionp1
of sites with1, while the rest of sites (at frequencyp0⫽1⫺
SuzukiandGojobori(1999) performed simulations
p1) havefrom the-distribution between 0 and 1. Here we to examine the performance of their parsimony method.
compare twice the log-likelihood difference between M7 and They compared the results of the method on analyzing M8 with a2
2distribution to test for positive selection (Yang
two tree topologies (64 and 128 taxa, respectively), with et al. 2000;Anisimovaet al.2001). Model M8a was introduced various branch lengths (0.01, 0.02, and 0.03 synonymous inSwansonet al. (2003); it is similar to model M8 except that
the category1is fixed at1⫽1. It was argued that twice the
changes per synonymous site for each branch) and
vari-log-likelihood difference between M8 and M8a should be as-ousdN/dSratios (0.2, 0.5, 1.0, 2.0, and 5.0). The power
ymptotically distributed as a 50:50 mixture of a point mass at of the method was found to increase with increasing 0 and 2
1 (Swanson et al. 2003). However, this asymptotic
branch lengths and strength of the positive selection. result holds only if all the parameters of the null model are The study also concluded that the method has a very estimable (Chernoff1954;SelfandLiang1987), which is not always the case for the M8a-M8 comparison. Thus besides low false-positive rate in general.
the1
220⫹ 1
221distribution, to be conservative we use the1
2
SuzukiandNei(2001, 2002) also conducted
simula-distribution as well for comparison with the test statistic. We tion studies to compare the reliability of the parsimony also use slight variations to M1 (neutral) and M2 (selection), and likelihood methods. These two studies focused mainly by letting0vary freely between 0 and 1 rather than fixing it at 0. These models are referred to below as M1a and M2a. on predicting positively selected sites. It was argued that
These two models were implemented in a modified version the parsimony-based method was robust against the
as-of codeml. Notice that the M0vs. M3 test that was used in
sumptions of the models and tends to be conservative,
Suzuki and Nei (2001, 2002) and Anisimovaet al. (2001, whereas the likelihood method gave numerous false- 2002) is a test of heterogeneity inamong sites and not really positive results with certain parameters in the simula- a test for positive selection. We did not include this test here
likeli-To predict which sites are under positive selection in the likelihood framework, the empirical Bayes method described inNielsenandYang(1998) andYanget al.(2000) was ap-plied. A site is predicted as positively selected if the (empirical Bayes) posterior probability that it belongs to the positive selection category is greater than a predetermined cutoff value Pb. It is worth mentioning here that this method is not designed to control the frequentist type I error, that is, the probability of inferring positive selection when the null hypothesis is true
(i.e., the site is not under positive selection).SuzukiandNei
(2001, p. 1866) incorrectly suggest that this error rate is
ex-pected to be (1⫺Pb) when the cutoff isPb. In the empirical
Bayes method,Pbis the probability that a site inferred to be
positively selected is truly under positive selection (termed
the accuracy byAnisimovaet al.2002), and what should equal
(1⫺ Pb) is the proportion of sites inferred to be positively selected that are not under positive selection. However, we will here concentrate on evaluating the false-positive rate (fre-quentist type I error rate) of the empirical Bayes method,
usingPb⫽0.95 orPb⫽0.99.
The maximum parsimony approach to detecting positive selection in protein coding nucleotide sequences was
de-scribed inSuzukiandGojobori(1999; see alsoFitchet al.
1997;Bushet al. 1999). Given a set of aligned sequences and
assuming that each codon site is independent, the method first infers the ancestral codon states using either the parsimony
method (Fitch1971;Hartigan1973) or the empirical Bayes
method (Yanget al.1995), with parameters estimated from
pair-wise distances rather than using maximum likelihood (Zhang
andNei1997;Zhanget al. 1998). Second, for each codon site,
the method counts the numbers of synonymous and nonsyn-onymous sites and the numbers of synnonsyn-onymous and nonsynon-ymous differences. Finally, for each site, a test of neutrality is
conducted to see whetherdN⬎dSor ⬎1. A one-sided test
for positive selection is used in this simulation study, with the significance level set at 5 or 1%. If the test is significant, the method concludes that the site is undergoing positive selec-tion. We compare this test of selection at each site with the empirical Bayesian identification of sites under positive
selec-tion (NielsenandYang1998;Yanget al.2000), as didSuzuki
andNei(2001, 2002).
We also use the procedure ofSuzukiandGojobori(1999)
to test whether there is any site under positive selection in the whole protein, for comparison with the likelihood ratio test of NielsenandYang(1998) andYanget al.(2000). For such a test of positive selection in a protein, a correction for multiple testing is needed since each site is tested for positive selection
Figure1.—Phylogenetic trees used for simulating the data. independently. We use the Simes’ improved Bonferroni
pro-(A) A 5-taxon tree; (B) a 30-taxon tree. Branch lengths are
cedure (Simes1986). That is, we rank theP-values of the test
scaled so that they sum to three nucleotide substitutions per on each site, from the lowest to the highest. If any site has a
codon.
P-value smaller than the designated type I error␣divided by
its rank, we claim that the data set is significant for positive selection. Simulation studies showed that the Simes’ improved
Simulated data:Data sets were simulated using evolver in the Bonferroni procedure has better power than the traditional
PAML 3.13 package (Yang2000b), on a 5-taxon tree (Figure
Bonferroni procedure (Simes1986) and hence it is used in
1A) and a 30-taxon tree (Figure 1B). The following parame-this study.
Real and simulated data sets analyzed in this article:HLA ters are common in all sets of simulations: (1) the transition/ data used inSuzukiandNei(2001):To understand why drasti- transversion rate ratio ⫽1, (2) the stationary frequencies
cally different conclusions were reached byYangandSwan- of each of the 61 sense codons is 1/61, (3) the number of
co-son(2002) andSuzukiandNei(2001) in the analysis of two dons in each sequence is 500, and (4) the tree length (the
ex-similar data sets, we reanalyzed the data ofSuzukiandNei pected number of nucleotide substitutions per codon along
(2001) using codeml. FollowingSuzukiandNei(2001), we fixed all branches in the phylogeny) is 3. For each of the two tree
branch lengths at estimates obtained under a nucleotide-based topologies, six sets of different-values were simulated, as follows.
model on a neighbor-joining tree (SaitouandNei1987). As
Data sets that contain only neutrally or negatively selected sites: inSuzukiandNei(2001), the F61 model was used to account
for codon usage bias, with the equilibrium codon frequencies 1. ⫽0 for all codon sites; 100 replicates.
estimated by the observed frequencies in the data (Goldman 2. (a) ⫽0 for 50% of the sites, and ⫽1 for 50% of the
sites; 100 replicates.
(b) ⫽0 for 90% of the sites, and ⫽1 for 10% of the 1. Given the topology of the tree, models M0, M1, M2, M1a,
M2a, M7, M8, and M8a are used, withfixed at 1 in all
sites; 100 replicates.
3. ⫽0.5 for 50% of the sites, and ⫽ 1 for 50% of the models. Under models M2, M2a, M7, M8, and M8a, the
same analysis is conducted multiple times using different sites; 100 replicates.
Data sets that contain positively selected sites: initial values, to investigate possible problems with conver-gence of likelihood optimizations or multiple local maxima
4. ⫽1.5 for 50% of the sites, ⫽1 for 50% of the sites; of the likelihood function (Yang1997;Yanget al. 2000).
100 replicates. 2. Log-likelihood values from each data set and the putative
5. ⫽0 for 45% of the sites, ⫽1 for 45% of the sites, and positively selected sites inferred by codeml are obtained.
⫽1.5 for 10% of the sites; 50 replicates. For a data set analyzed with different initial values, the
6. ⫽0 for 45% of the sites, ⫽1 for 45% of the sites, and result with a higher likelihood value is used, in accordance
⫽5 for 10% of the sites; 50 replicates. with standard theory (Stuartet al. 1999).
3. LRTs were performed to compare models M1 with M2,
Note that the -values in three of the above schemes M1a with M2a, M7 with M8, and M8a with M8.
(schemes 2, 3, and 4) were identical to those used inSuzuki
andNei(2002). Schemes 1, 5, and 6 are designed to mimic When interpreting the results we distinguish between tests
pseudogene evolution, weakly positively selected evolution, of positive selection (the LRT and the parsimony-based test
and highly positively selected evolution, respectively. We note using a Bonferroni correction) and prediction of sites under
that some of the simulation schemes used here are highly positive selection.
unrealistic for real data sets, such as scheme 4. However, they provide difficult test cases, useful for evaluating detection methods.
RESULTS
Analysis of simulated data:The simulated data were ana-lyzed using the parsimony method with Adaptsite 1.3 (Suzuki
Analysis of the HLA data set:The log-likelihood
val-et al. 2001) and the maximum likelihood method with
co-ues and parameter estimates of the HLA data set of
deml in the PAML 3.13 package (Yang2000b).
SuzukiandNei(2001) under various models are shown
The procedure for data analysis with Adaptsite is as follows:
in Table 1. The results for M0 (one-ratio) are the same 1. Since Adaptsite cannot estimate the branch lengths of the
as those ofSuzukiandNei(2001; Table 1). However, the
tree, we used Bn-Bs (Zhanget al. 1998) to estimate the
syn-results for all other models—that is, M1 (neutral), M2 onymous branch lengths of the tree, with the true topology
(selection), M3 (discrete), M7 (beta), and M8 (beta&)— given.
2. Adaptsite-p was applied to the data, using the true tree are different, and those inSuzukiandNei(2001) are
in-topology and estimated branch lengths, to estimate the correct. Models M2 (selection), M3 (discrete), and M8
total and average numbers of synonymous and nonsynony- (beta&), which allow for sites under positive selection,
mous sites for the phylogenetic tree with user-given
muta-all suggest presence of such sites (Table 1). Those mod-tion rates between the four nucleotides. The mutamod-tion rates
els also fit the data significantly better than the
corre-between any two nucleotides were set to 1, since ⫽1 in
the simulated data. sponding null models, namely M1 (neutral), M0
(one-3. Given the output from adaptsite-p, we used adaptsite-t to ratio), and M7 (beta), respectively. A number of sites are
compute theP-values of one-sided and two-sided neutrality identified by the models to be under positive selection.
tests independently for each codon site.
For example, model M8 identified 24 sites at the 95% 4. Since Adaptsite is not capable of analyzing some of the
probability level. Of these, 20 sites are on the list of 57
sites in the data sets (e.g., those that have⬎10,000
combina-tions for possible ancestral codons over all nodes), upon amino acids within the ARS (Bjorkmanet al. 1987a,b).
the program’s author’s recommendation, we excluded those The other 4 sites identified (45M, 83G, 94T, and 113Y;
sites in calculating the summarized results. site numbering refers to the PDB structural file 1AK J)
5. Tests of neutrality ( ⱕ1 for all sites) were then completed
are not on the list but are all located in the same region.
using Simes’ improved Bonferroni procedure (Simes1986)
The sites are very similar to those identified by Yang as described earlier.
andSwanson(2002) from a similar data set. Three of
We ranked only those sites that Adaptsite was able to analyze. the 4 non-ARS sites (45M, 94T, and 113Y) were
identi-Regarding step 1 above,SuzukiandGojobori(1999) used
fied to be under positive selection byYangand Swan-the neighbor-joining method for constructing Swan-the tree
topol-son(2002) as well.
ogy and then used theNeiandGojobori(1986) method for
estimating the number of synonymous substitutions. Since Multiple runs using different starting values
identi-these two steps were implemented in one program included fied a suboptimal local maximum of the likelihood
func-in the Adaptsite 1.3 package (Suzukiet al. 2001), we used the tion for model M2 (selection) atpˆ
0⫽0.578,pˆ1⫽0.101,
Bn-Bs program (Zhang et al. 1998) so that we can feed
andˆ2⫽0.125, withᐉ⫽ ⫺8229.64. Model M8 (beta&) Adaptsite with the true tree topology. The Bn-Bs program
also has a local optimum, atpˆ0⫽0.555,pˆ⫽0.031,qˆ⫽
implements a modified method from the original Nei and
Gojobori(1986) to take into account the transition bias for 0.102,ˆ ⫽0.046, withᐉ⫽ ⫺8228.63. These likelihood
estimating synonymous and nonsynonymous substitutions values are much lower than those in Table 1, and we
along the branches of a given tree. Steps 2–4 above are the use the results of Table 1 corresponding to the higher
standard procedures described in the README file included
peaks. Note that ifin M8 and2in M2 are constrained
in the Adaptsite 1.3 package (Suzukiet al. 2001).
to beⱖ1, as suggested bySwansonet al. (2003), there The procedure for data analysis for codeml in PAML is as
TABLE 1
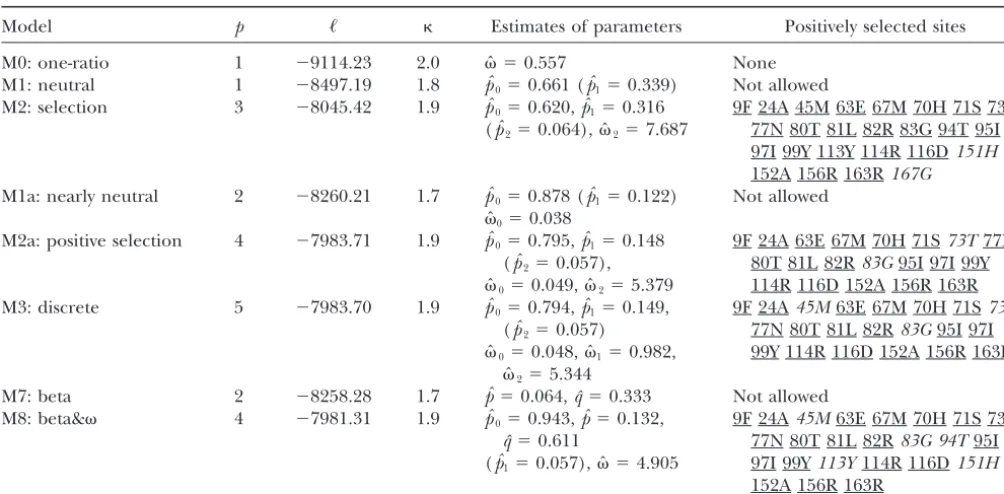
MLEs of parameters and sites inferred to be under positive selection for the HLA data set
Model p ᐉ Estimates of parameters Positively selected sites
M0: one-ratio 1 ⫺9114.23 2.0 ˆ ⫽0.557 None
M1: neutral 1 ⫺8497.19 1.8 pˆ0⫽0.661 (pˆ1⫽0.339) Not allowed
M2: selection 3 ⫺8045.42 1.9 pˆ0⫽0.620,pˆ1⫽0.316 9F 24A 45M 63E 67M 70H 71S 73T
(pˆ2⫽0.064),ˆ2⫽7.687 77N 80T 81L 82R 83G 94T 95I
97I 99Y 113Y 114R 116D151H
152A 156R 163R167G
M1a: nearly neutral 2 ⫺8260.21 1.7 pˆ0⫽0.878 (pˆ1⫽0.122) Not allowed
ˆ0⫽0.038
M2a: positive selection 4 ⫺7983.71 1.9 pˆ0⫽0.795,pˆ1⫽0.148 9F 24A 63E 67M 70H 71S73T77N
(pˆ2⫽0.057), 80T 81L 82R83G95I 97I 99Y
ˆ0⫽0.049,ˆ2⫽5.379 114R 116D 152A 156R 163R
M3: discrete 5 ⫺7983.70 1.9 pˆ0⫽0.794,pˆ1⫽0.149, 9F 24A45M63E 67M 70H 71S73T
(pˆ2⫽0.057) 77N 80T 81L 82R83G95I 97I
ˆ0⫽0.048,ˆ1⫽0.982, 99Y 114R 116D 152A 156R 163R
ˆ2⫽5.344
M7: beta 2 ⫺8258.28 1.7 pˆ⫽0.064,qˆ⫽0.333 Not allowed
M8: beta& 4 ⫺7981.31 1.9 pˆ0⫽0.943,pˆ⫽0.132, 9F 24A45M63E 67M 70H 71S 73T
qˆ⫽0.611 77N 80T 81L 82R83G 94T95I
(pˆ1⫽0.057),ˆ⫽4.905 97I 99Y113Y114R 116D151H
152A 156R 163R
p, the number of free parameters in the -distribution. Sites inferred to be under positive selection at the 99% level are
underlined and those at the 95% level are in italic. The reference sequence is A-0101 inSuzukiandNei(2001), and the site
numbering is the same as in the structural file 1AKJ, used byYangandSwanson(2002). The F61 model is used, with branch
lengths fixed at three times the estimates from theKimura(1980) substitution model.
M7 (beta) seems also to have a local maximum atpˆ⫽ results under the simulation conditions investigated here. However, they differ dramatically in their power 0.018,qˆ⫽0.130, withᐉ ⫽ ⫺8267.39.
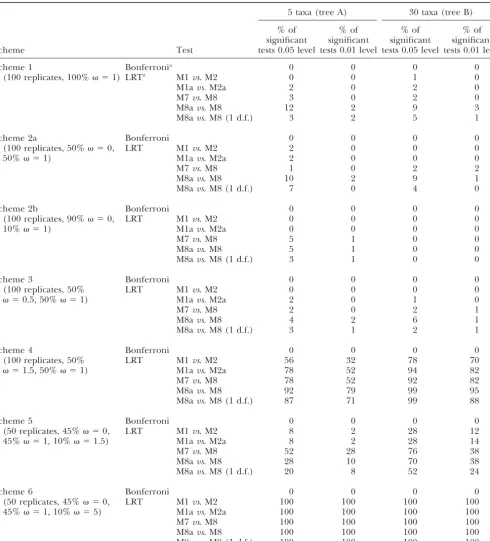
Simulation results:Hypothesis tests:Table 2 shows the to detect positive selection. Note that under schemes 4,
5, and 6, sites under positive selection with ⬎1 exist, number of data sets detected by the two methods to
have significant evidence for the presence of positive so that a method that detects positive selection more often has higher power. Adaptsite detected no positive selection, for each set of parameter values. Note that
under schemes 1, 2a, 2b, and 3, no sites are under posi- selection even when ⫽5 in 10% of the sites (scheme 6) or when half of the sites were undergoing weak positive tive selection with ⬎1, so that any data sets in which
positive selection is claimed are false positives (type I selection (scheme 4). In contrast, in scheme 4, the LRT between M7 and M8 (5% significance level) identified errors). The improved Bonferroni procedure combined
with Adaptsite did not detect positive selection in any positive selection in 72 and 98% of the cases when the numbers of taxa were 5 and 30, respectively. In scheme 6 of the data sets simulated under those schemes and thus
had zero false positives. In general, the false-positive rate all the LRTs had power close to 100%. While Adaptsite essentially has zero power to detect positive selection of the LRT with codeml is lower than or equal to the
nominal significance level. In particular, the false-posi- under all of the conditions studied, the power of the LRT can be quite high even for five sequences, without inflat-tive rates for the M7vs.M8 comparison were all below
5%, much lower than the error rates reported bySuzuki ing the type I error rate of the test.
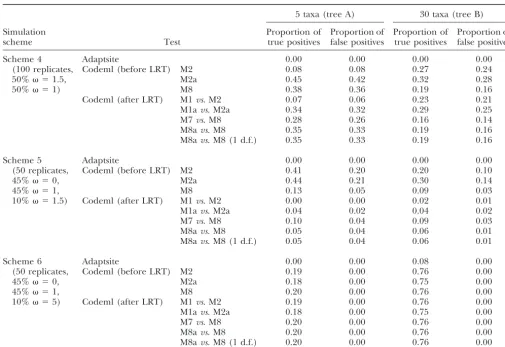
Prediction of positively selected sites: The accuracy of and Nei (2002). However, the type I errors of M8a-M8
comparison using the mixture of2 distributions sug- Adaptsite and codeml in predicting positively selected sites in data sets that do contain positively selected sites gested bySwansonet al. (2003) were about twice the
desired level. The LRT comparing M8avs.M8 using a is shown in Table 3. Adaptsite detected⬍1% of the posi-tively selected sites when either 10% (scheme 4) or 50%
2
1distribution performed better. None of the original
tests suggested byNielsenandYang(1998) andYang (scheme 5) of the sites were under weak positive selec-tion ( ⫽1.5). However, for 30 sequences when 10% et al. (2000) had elevated levels of falsely significant
results. of the sites are under strong positive selection ( ⫽5 in scheme 6), Adaptsite identified 8% of those sites In sum, neither Adaptsite nor the LRT implemented
Bon-TABLE 2
Percentage of significant tests for positive selection on the whole gene with Adaptsite and codeml on the simulated data
5 taxa (tree A) 30 taxa (tree B)
% of % of % of % of
significant significant significant significant
Scheme Test tests 0.05 level tests 0.01 level tests 0.05 level tests 0.01 level
Scheme 1 Bonferronia 0 0 0 0
(100 replicates, 100% ⫽1) LRTb M1vs. M2 0 0 1 0
M1avs. M2a 2 0 2 0
M7vs. M8 3 0 2 0
M8avs. M8 12 2 9 3
M8avs. M8 (1 d.f.) 3 2 5 1
Scheme 2a Bonferroni 0 0 0 0
(100 replicates, 50% ⫽0, LRT M1vs. M2 2 0 0 0
50% ⫽1) M1avs. M2a 2 0 0 0
M7vs. M8 1 0 2 2
M8avs. M8 10 2 9 1
M8avs. M8 (1 d.f.) 7 0 4 0
Scheme 2b Bonferroni 0 0 0 0
(100 replicates, 90% ⫽0, LRT M1vs. M2 0 0 0 0
10% ⫽1) M1avs. M2a 0 0 0 0
M7vs. M8 5 1 0 0
M8avs. M8 5 1 0 0
M8avs. M8 (1 d.f.) 3 1 0 0
Scheme 3 Bonferroni 0 0 0 0
(100 replicates, 50% LRT M1vs. M2 0 0 0 0
⫽0.5, 50% ⫽1) M1avs. M2a 2 0 1 0
M7vs. M8 2 0 2 1
M8avs. M8 4 2 6 1
M8avs. M8 (1 d.f.) 3 1 2 1
Scheme 4 Bonferroni 0 0 0 0
(100 replicates, 50% LRT M1vs. M2 56 32 78 70
⫽1.5, 50% ⫽1) M1avs. M2a 78 52 94 82
M7vs. M8 78 52 92 82
M8avs. M8 92 79 99 95
M8avs. M8 (1 d.f.) 87 71 99 88
Scheme 5 Bonferroni 0 0 0 0
(50 replicates, 45% ⫽0, LRT M1vs. M2 8 2 28 12
45% ⫽1, 10% ⫽1.5) M1avs. M2a 8 2 28 14
M7vs. M8 52 28 76 38
M8avs. M8 28 10 70 38
M8avs. M8 (1 d.f.) 20 8 52 24
Scheme 6 Bonferroni 0 0 0 0
(50 replicates, 45% ⫽0, LRT M1vs. M2 100 100 100 100
45% ⫽1, 10% ⫽5) M1avs. M2a 100 100 100 100
M7vs. M8 100 100 100 100
M8avs. M8 100 100 100 100
M8avs. M8 (1 d.f.) 100 100 100 100
Schemes 4–6 are simulation conditions that include positive selection.
aBonferroni procedure applied to the results obtained by Adaptsite.
bLikelihood ratio test performed at 0.05 significance level.
ferroni procedure. Codeml performs even better on the more, Adaptsite was not able to identify any positively se-lected sites with the same distribution ofon the five-same data sets, correctly identifying over 75% of the
Further-TABLE 3
Performance of Adaptsite and codeml in inferring positive selection sites in simulated data
5 taxa (tree A) 30 taxa (tree B)
Simulation Proportion of Proportion of Proportion of Proportion of
scheme Test true positives false positives true positives false positives
Scheme 4 Adaptsite 0.00 0.00 0.00 0.00
(100 replicates, Codeml (before LRT) M2 0.08 0.08 0.27 0.24
50% ⫽1.5, M2a 0.45 0.42 0.32 0.28
50% ⫽1) M8 0.38 0.36 0.19 0.16
Codeml (after LRT) M1vs. M2 0.07 0.06 0.23 0.21
M1avs. M2a 0.34 0.32 0.29 0.25
M7vs. M8 0.28 0.26 0.16 0.14
M8avs. M8 0.35 0.33 0.19 0.16
M8avs. M8 (1 d.f.) 0.35 0.33 0.19 0.16
Scheme 5 Adaptsite 0.00 0.00 0.00 0.00
(50 replicates, Codeml (before LRT) M2 0.41 0.20 0.20 0.10
45% ⫽0, M2a 0.44 0.21 0.30 0.14
45% ⫽1, M8 0.13 0.05 0.09 0.03
10% ⫽1.5) Codeml (after LRT) M1vs. M2 0.00 0.00 0.02 0.01
M1avs. M2a 0.04 0.02 0.04 0.02
M7vs. M8 0.10 0.04 0.09 0.03
M8avs. M8 0.05 0.04 0.06 0.01
M8avs. M8 (1 d.f.) 0.05 0.04 0.06 0.01
Scheme 6 Adaptsite 0.00 0.00 0.08 0.00
(50 replicates, Codeml (before LRT) M2 0.19 0.00 0.76 0.00
45% ⫽0, M2a 0.18 0.00 0.75 0.00
45% ⫽1, M8 0.20 0.00 0.76 0.00
10% ⫽5) Codeml (after LRT) M1vs. M2 0.19 0.00 0.76 0.00
M1avs. M2a 0.18 0.00 0.75 0.00
M7vs. M8 0.20 0.00 0.76 0.00
M8avs. M8 0.20 0.00 0.76 0.00
M8avs. M8 (1 d.f.) 0.20 0.00 0.76 0.00
The proportion of true positives is defined as the number of sites that are correctly classified as positively selected divided by the total number of positive selection sites simulated. The proportion of false positives is defined as the number of sites that are falsely classified in the positively selected category divided by the total number of sites that are not positively selected.
and 5), the empirical Bayes methods predict an almost M1avs.M2a and M7vs.M8;⬍10% for M8avs.M8) in the pseudogene set (scheme 1) after the LRT.
equal amount of neutral and positively selected sites to belong to the positive selection category. The proportion of sites evolving neutrally that are predicted to be under
DISCUSSION positive selection can be as high as 36% with M8. The
high error rates are due to inaccuracies in maximum The erroneous results published by SuzukiandNei (2001) on the HLA data set appear to be due to the use likelihood estimates of parameters in the-distribution.
Adaptsite predicts no positively selected sites in either of an earlier version (3.0a) of the codeml program in the PAML package (Yang1997), which worked for relatively category. None of the methods are capable of
discrimi-nating between sites in which ⫽1 and ⫽1.5 with small data sets only. For large trees, multiplication of small transition probabilities across branches can cause any confidence. Clearly, differentiating between sites
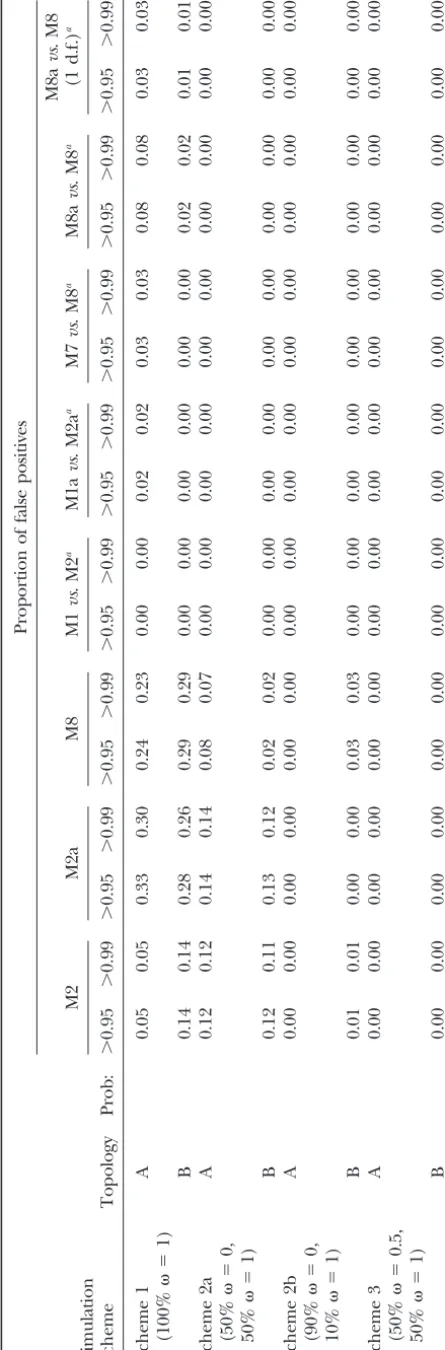
evolving under such similar values ofis very hard. underflow, a problem dealt with inYang(2000a; p. 426) and in later versions of PAML. The errors in the results Table 4 shows the proportion of neutral sites that
are falsely predicted to be under positive selection by ofSuzukiandNei(2001) are obvious as simpler models had substantially greater likelihood than more complex codeml in the data sets without positive selection.
Re-sults from Adaptsite are not included in Table 4, since models and multiple runs led to very different parame-ter estimates and log likelihoods (see alsoSorhannus it did not have any false positives. Again note that the
distributions ofin schemes 2a, 2b, and 3 are the same 2003, p. 1328). Indeed, these errors were pointed out to the authors before publication by one of us (Z.Y.), as those used inSuzukiandNei(2002). We did not find
lished and interpreted as evidence against the likelihood to consider the posterior probabilities only if the LRT is significant.
method. Our simulations under conditions similar to
those used bySuzukiandNei(2001, 2002) did not pro- In sum, results of this simulation study suggest that the LRT of positive selection does not generally lead to duce an excess of falsely significant results by the LRT.
We suspect that the discrepancies are due to numerical an excess of false positives, when the models are applied correctly and optimization problems are eliminated, problems in the optimization algorithm in the codeml
software in the studies ofSuzukiandNei(2001, 2002). consistent with the simulation studies ofAnisimovaet al. (2001, 2002). Previous claims of excessive false-positive Failure of optimization routines can lead to erroneous
results. Indeed, the iteration algorithm was found to be rates for the ML method were based on results either known to be incorrect (SuzukiandNei2001) or most problematic in this study as well, especially when the
parameter estimates were at the boundary of the param- likely caused by numerical optimization problems or simulation errors (SuzukiandNei2002).
eter space, and we had to run the program multiple times
using different starting values to obtain reliable results. In contrast, Adaptsite was unable to identify positive selection in virtually all of the simulated data sets ana-Hence we want to emphasize the advice given in the
PAML documentation (Yang2000b) that it is important lyzed here. Even in scheme 6 with strong positive selec-tion ( ⫽5), when the LRT detected positive selection to compare outcomes from analyses using different
models and different initial parameter values to confirm with ⵑ100% power for both small and large trees and the empirical Bayes method distinguished between neu-results. In our experience, multiple local optima often
occur in different parts of the parameter space with tral and positively selected sites with great accuracy (Ta-bles 2 and 3), Adaptsite essentially predicts all sites to quite different log likelihoods and are thus easy to
iden-tify. In such cases, one should consider only the one be neutral. Similarly, in a real data set of thetaxgene of a human T-cell lymphotropic virus, Adaptsite failed to with the highest likelihood and ignore the suboptimal
local peaks. We also note that the modified tests M1avs. detect positive selection even when the-ratio averaged over all sites and all branches is much greater than 1 M2a and M8avs.M8 are less prone to the problem than
the original tests M1vs.M2 and M7vs.M8. When those (SuzukiandNei2004). The lack of power of the method makes it unusable for testing positive selection except guidelines above are followed, existing likelihood-based
methods appear to have good performance in terms of in large data sets with many sequences. This conclusion is consistent with the original study ofSuzukiand Gojo-both accuracy and power. We acknowledge that such
error checking requires extensive and difficult computa- bori (1999), who recommended its use in large data sets. While the method has been successful in several tions in large-scale simulation studies. However, a
dis-tinction can and should be made between a method large data sets, of HLA alleles (SuzukiandNei2001) and viral genes such as HIV-1env(Yamaguchi-Kabata and a computer program implementing the method.
In evaluations of analytical methods, one should try to andGojobori2000), it is in general unknown how large the data set should be for the method to have any power. obtain correct results rather than use obviously
incor-rect results as evidence against the method. Clearly there We suggest that failure of the method to detect positive selection should not be taken as evidence for absence is a need for implementing more robust iteration
algo-rithms. For the moment, we suggest it is feasible for of positive selection and that the method be used for exploratory data analysis only, to provide a heuristic as-biologists studying individual data sets to apply multiple
runs under multiple models using the PAML software sessment of synonymous and nonsynonymous changes at individual sites (see alsoFitchet al. 1997).
on desktop computers even with a few hundred
se-quences in the data. It is quite possible that the likelihood models used for detecting positive selection can be violated such that Predicting which sites are under positive selection is
a very hard statistical problem, especially when the value the rate of false positives of the LRT is increased over the nominal level. Identification of such cases is an ofis low at the positively selected sites. None of the
examined methods could reliably distinguish between important step toward improving the methods, and we encourage researchers to continue the quest to find con-sites evolving at ⫽1 and those evolving at ⫽1.5.
Caution should thus be exercised against drawing strong ditions under which the likelihood method fails. We also note that the empirical Bayes prediction can be conclusions when the estimated is only marginally
⬎1, particularly if the estimated standard error of improved, for example, by integrating over the uncer-tainty in the parameters in the-distribution. Likewise, is large relative to ⫺ 1. Furthermore, the current
implementation of the empirical Bayes approach fails T.Massinghamand N.Goldman(unpublished obser-vations) have proposed a related likelihood procedure to accommodate the sampling errors in the maximum
likelihood estimates of model parameters (such as pro- that may accurately control the false-positive rates. Fu-ture studies examining the properties of the method for portions of sites and the-ratios), and as a result,
poste-rior probabilities calculated from small data sets may identifying positively selected sites may help to further improve and refine them.
be inflated if they are based on inaccurate parameter
Hartigan, J. A., 1973 Minimum mutation fits to a given tree. Bio-based on comparison of synonymous and
nonsynony-metrics29:53–65.
mous rates should always be borne in mind. Such meth- Kimura, M.,1980 A simple method for estimating evolutionary rates of base substitutions through comparative studies of nucleotide ods detect positive selection only if there is an excess
sequences. J. Mol. Evol.16:111–120. of nonsynonymous substitutions and are thus suitable
Liberles, D. A., and M. L.Wayne, 2002 Tracking adaptive evolution-for detecting recurrent diversifying selection, but may ary events in genomic sequences. Genome Biol.3:REVIEWS1018.
Liberles, D. A., D. R. Schreiber, S. Govindarajan, S. G.
Chamber-not detect directional selection that drives an
advanta-linandS. A. Benner, 2001 The adaptive evolution database geous mutation quickly to fixation. A reasonable amount
(TAED). Genome Biol.2:RESEARCH0028.
of synonymous and nonsynonymous substitutions is also Muse, S. V., andB. S. Gaut, 1994 A likelihood approach for compar-ing synonymous and nonsynonymous nucleotide substitution necessary for such methods to work, as too little
informa-rates, with application to the chloroplast genome. Mol. Biol. Evol. tion is available at low divergence levels while
synony-11:715–724.
mous substitutions are often saturated at high diver- Nei, M.,andT. Gojobori, 1986 Simple methods for estimating the numbers of synonymous and nonsynonymous nucleotide substi-gence. In viral sequences, excessive recombination can
tutions. Mol. Biol. Evol.3:418–426. also cause false positives for the detection method
(Ani-Nielsen, R., andZ. Yang, 1998 Likelihood models for detecting
simovaet al.2003). positively selected amino acid sites and applications to the HIV-1
envelope gene. Genetics148:929–936. We are grateful to the former Editor of Molecular Biology and
Saitou, N., andM. Nei, 1987 The neighbor-joining method: a new Evolution, Simon Easteal, for assistance in obtaining the HLA data
method for reconstructing phylogenetic trees. Mol. Biol. Evol.4: for our reanalysis. We thank Tim Massingham for very helpful discus- 406–425.
sions and John Bishop and two anonymous referees for comments. Self, S., andK.-Y. Liang, 1987 Asymptotic properties of maximum Z.Y. is supported by grants from the Biotechnology and Biological likelihood estimators and likelihood ratio tests under nonstan-Sciences Research Council (United Kingdom) and Human Frontier dard conditions. J. Am. Stat. Assoc.82:605–610.
Simes, R. J., 1986 An improved Bonferroni procedure for multiple Science Program (HFSP; European Union). N.G. is supported by a
tests of significance. Biometrika73:751–754. Wellcome Trust fellowship. This work was supported by National
Sci-Sorhannus, U., 2003 The effect of positive selection on a sexual ence Foundation/National Institutes of Health grant
DMS/NIGMS-reproduction gene in Thalassiosira weissflogii (Bacillariophyta): 0201037 and HFSP grant RGY0055/2001-M. This research was
con-results obtained from maximum-likelihood and parsimony-based ducted using the resources of the Cornell Theory Center and the
methods. Mol. Biol. Evol.20:1326–1328.
Computational Biology Unit, which receives funding from Cornell Stuart, A., K. OrdandS. Arnold, 1999 Kendall’s Advanced Theory University, New York State, federal agencies, foundations, and corpo- of Statistics. Arnold, London.
rate partners. Suzuki, Y., andT. Gojobori, 1999 A method for detecting positive selection at single amino acid sites. Mol. Biol. Evol.16:1315–1328.
Suzuki, Y., andM. Nei, 2001 Reliabilities of parsimony-based and likelihood-based methods for detecting positive selection at single amino acid sites. Mol. Biol. Evol.18:2179–2185.
LITERATURE CITED
Suzuki, Y., andM. Nei, 2002 Simulation study of the reliability
Anisimova, M., J. P. BielawskiandZ. Yang, 2001 Accuracy and and robustness of the statistical methods for detecting positive power of the likelihood ratio test in detecting adaptive molecular selection at single amino acid sites. Mol. Biol. Evol.19:1865–1869. evolution. Mol. Biol. Evol.18:1585–1592. Suzuki, Y., andM. Nei, 2004 False-positive selection identified by
Anisimova, M., J. P. BielawskiandZ. Yang, 2002 Accuracy and ML-based methods: examples from theSig1gene of the diatom power of bayes prediction of amino acid sites under positive se- Thalassiosira weissflogiiand thetaxgene of a human T-cell lympho-lection. Mol. Biol. Evol.19:950–958. tropic virus. Mol. Biol. Evol.21:914–921.
Anisimova, M., R. NielsenandZ. Yang, 2003 Effect of recombina- Suzuki, Y., T. GojoboriandM. Nei, 2001 ADAPTSITE: detecting tion on the accuracy of the likelihood method for detecting natural selection at single amino acid sites. Bioinformatics17: positive selection at amino acid sites. Genetics164:1229–1236. 660–661.
Bernatchez, L., andC. Landry, 2003 MHC studies in nonmodel Swanson, W. J., andV. D. Vacquier, 2002 The rapid evolution of vertebrates: What have we learned about natural selection in 15 reproductive proteins. Nat. Rev. Genet.3:137–144.
years? J. Evol. Biol.16:363–377. Swanson, W. J., R. NielsenandQ. Yang, 2003 Pervasive adaptive
Bjorkman, P. J., S. A. Saper, B. Samraoui, W. S. BennetandJ. L. evolution in mammalian fertilization proteins. Mol. Biol. Evol.
Stromingeret al., 1987a Structure of the class I histocompati- 20:18–20.
bility antigen, HLA-A2. Nature329:506–512. Yamaguchi-Kabata, Y., andT. Gojobori, 2000 Reevaluation of amino
Bjorkman, P. J., S. A. Saper, B. Samraoui, W. S. Bennet, J. L. Stro- acid variability of the human immunodeficiency virus type 1 gp120
mingeret al., 1987b The foreign antigen binding site and T cell envelope glycoprotein and prediction of new discontinuous epi-recognition regions of class I histocompatibility antigens. Nature topes. J. Virol.74:4335–4350.
329:512–518. Yang, Z., 1997 PAML: a program package for phylogenetic analysis
Bush, R. M., W. M. Fitch, C. A. BenderandN. J. Cox, 1999 Positive by maximum likelihood. Comput. Appl. Biosci.13:555–556. selection on the H3 hemagglutinin gene of human influenza Yang, Z., 2000a Maximum likelihood estimation on large phyloge-virus A. Mol. Biol. Evol.16:1457–1465. nies and analysis of adaptive evolution in human influenza virus
Chernoff, H., 1954 On the distribution of the likelihood ratio. A. J. Mol. Evol.51:423–432.
Ann. Math. Stat.25:573–578. Yang, Z., 2000b Phylogenetic Analysis by Maximum Likelihood (PAML),
Choisy, M., C. H. Woelk, J. F. GueganandD. L. Robertson, 2004 Version 3.13. University College, London.
Comparative study of adaptive molecular evolution in different Yang, Z., andJ. P. Bielawski, 2000 Statistical methods for detecting human immunodeficiency virus groups and subtypes. J. Virol. molecular adaptation. Trends Ecol. Evol.15:496–503. 78:1962–1970. Yang, Z., andW. J. Swanson, 2002 Codon-substitution models to
Fitch, W. M., 1971 Toward defining the course of evolution: mini- detect adaptive evolution that account for heterogeneous selec-mum change for a specific tree topology. Syst. Zool.20:406–416. tive pressures among site classes. Mol. Biol. Evol.19:49–57.
Fitch, W. M., R. M. Bush, C. A. BenderandN. J. Cox, 1997 Long Yang, Z., S. KumarandM. Nei, 1995 A new method of inference of term trends in the evolution of H(3) HA1 human influenza type ancestral nucleotide and amino acid sequences. Genetics141: A. Proc. Natl. Acad. Sci. USA94:7712–7718. 1641–1650.
Goldman, N., andZ. Yang, 1994 A codon-based model of nucleotide Yang, Z., R. Nielsen, N. GoldmanandA. M. Pedersen, 2000 Codon-substitution for protein-coding DNA sequences. Mol. Biol. Evol. substitution models for heterogeneous selection pressure at
Zhang, J., and M. Nei, 1997 Accuracies of ancestral amino acid selection after gene duplication in primate ribonuclease genes. Proc. Natl. Acad. Sci. USA95:3708–3713.
sequences inferred by the parsimony, likelihood, and distance methods. J. Mol. Evol.44:S139–S146.