Modelling of Fatigue life of 6082 T6 Al-alloy
based on Genetic Programming
J. R. Mohanty
Department of Mechanical Engineering, Veer Surendra Sai University of Technology, Burla,
Sambalpur (Odisha), India
ABSTRACT: The current work presents a simple model to estimate the constant amplitude fatigue crack growth life of 6082 T6 Al-alloy under the influence of load ratios. The model produced by GEP is constructed from the set of experimental results conducted in the laboratory. The model result has been compared with the experimental findings. It is found that the GEP model slightly underestimates the fatigue life with percentage deviation of -2.04 from experimental results.
KEYWORDS: Genetic programming; fatigue crack growth life; correlation coefficient (R) and mean squared error (MSE)
I. INTRODUCTION
All most all engineering structures and components contain cracks or crack like flaws. During the service period, these cracks grow under cyclic loading which eventually leads to catastrophic failure causing loss of human life. Therefore, fatigue crack growth study must be considered in design and in the analysis of failure. Fatigue crack growth rate (da/dN) not only depends on stress intensity factor range (∆K), but also strongly dependent on load ratio (R) which is the ratio of minimum load to maximum load. It is well known that an increase in load ratio results in an increase in fatigue crack growth rate at a given cyclic stress intensity factor range. Earlier several investigators [1-5] have analyzed the influence of load ratio on fatigue crack growth rate. However, prediction of constant amplitude fatigue crack growth life under the effect of load ratio has been rarely studied. Further, to determine fatigue life one has to integrate growth rate equation (in the form of differential equation), which is quite complex as it involves several parameters. Recently, soft-computing techniques have been used in those complex situations. In the present study, genetic programming approach has been used to predict the constant amplitude fatigue life of 6082 T6 Al-alloy under the influence of load ratio using experimental data. It has been observed that the proposed model predicts the fatigue life with reasonable accuracy.
Paper is organized as follows. Section II describes automatic text detection using morphological operations, connected component analysis and set of selection or rejection criteria. The flow diagram represents the step of the algorithm. After detection of text, how text region is filled using an Inpainting technique that is given in Section III. Section IV presents experimental results showing results of images tested. Finally, Section V presents conclusion.
II. MATERIALS AND METHODS
Table 1 – Chemical compositions of 6082-T6 Al-alloy (wt%)
Fe Cu Mn Mg Cr Ti Zn Si Other
0.5 0.1 0.4-1 0.6-1.2 0.25 0.1 0.2 0.7-1.3 0.05
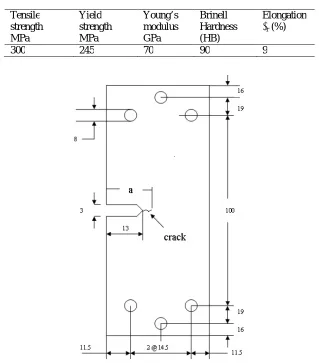
Table 2 – Mechanical properties of 6082-T6 Al-alloy
Tensile strength MPa
Yield strength MPa
Young’s modulus GPa
Brinell Hardness (HB)
Elongation
εr (%)
300 245 70 90 9
Fig. 1 – Single Edge Notch Tension (SENT) Specimen geometry
The crack growth tests have been performed in air at room temperature on a servo-hydraulic test machine having a load capacity of 100 kN with a frequency of 5 Hz. Pre-cracking has been introduced under mode-I loading with a sinusoidal waveform to an a/w (i.e. crack length to width ratio) ratio of 0.3 and then subjected to constant load test maintaining different load ratios (R) of 0.1, 0.2, 0.3, 0.4, 0.5, and 0.6 respectively. The crack growth has been monitored with the help of a COD gauge mounted on the face of the machined notch. The following equations have been used to determine stress intensity factor K[6].
wB a F g
Kf( ). (1)
where, 2 3 4
) / ( 39 . 30 ) / ( 72 . 21 ) / ( 55 . 10 ) / ( 231 . 0 12 . 1 ) (
15.75 18.75 21.75 24.75 27.75 30.75 33.75
3.50E+04 5.00E+04 6.50E+04 8.00E+04 9.50E+04
C ra ck le ng th ( a ), m m
No. of cycle (N) R=0.1 R=0.2 R=0.3 R=0.4 R=0.5 R=0.6
Usually, the crack length and number of cycles (a ~ N) data obtained from the fatigue tests contain much scatter. Hence, several techniques [7-10] have been proposed to determine the fatigue crack growth rate (da/dN) from raw laboratory data. In the present work, author’s earlier proposed the exponential equation method [11] has been applied to determine the fatigue crack growth rate at different load ratios. The raw a ~ N data have been fitted by using following exponential equation. ) ( i j i j ij N N
m e a
a (3)
where, ai and aj = crack length in ith step and jth step in ‘mm’ respectively, Ni and Nj = No. of cycles in ith step and jth step respectively, mij= specific growth rate in the interval i-j,
i = No. of experimental steps,
and j = i+1
The specific growth rate ‘mij’, which is an important parameter of the exponential equation, has been calculated by taking the logarithm of equation (3) as follows:
j i
i j ij ln N N a a m
(4)
The specific growth rate calculated from the above equation still contains scatter which has been subsequently refined by curve fitting with calculated a values (i.e. crack lengths from initial to final with an increment of 0.005mm). The smoothened values of the number of cycles have been calculated in the excel sheet from the refined ‘mij’ values as per the following equation.
i ij i j j ln N m a a N (5)
The crack growth rates (da/dN) have been calculated directly from the above calculated values of ‘N’ as follows:
j i
i j N N a a N a d d (6)
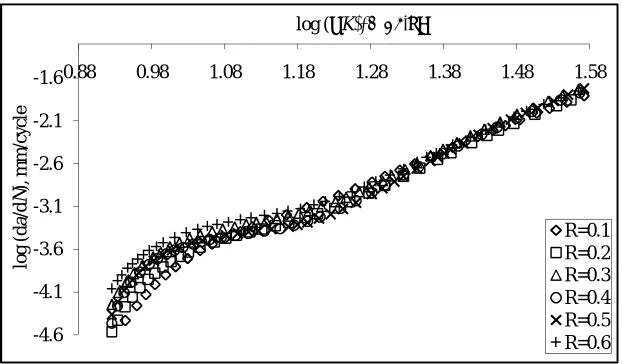
Figs. 2 and 3depict the superimposed a ~ N and log (da/dN)– log (∆K) curves under different load ratios.
-4.6 -4.1 -3.6 -3.1 -2.6 -2.1
-1.60.88 0.98 1.08 1.18 1.28 1.38 1.48 1.58
lo
g
(
d
a
/d
N
),
m
m
/c
yc
le
log (ΔK), MPa.√m
R=0.1 R=0.2 R=0.3 R=0.4 R=0.5 R=0.6
Fig. 3 – Smoothened values of log (da/dN)– log (∆K) curves for different load ratios
III. GENETIC PROGRAMMING APPROACH
Genetic programming (GP), proposed by Koza [12] is a generalization of genetic algorithms (GAs) [13]. GP creates computer programs to solve the specific problem by executing the following steps:
An initial population (generation 0) of random compositions of the functions and terminals of the problem is generated.
The following sub-steps are performed iteratively till the termination criterion is satisfied:
(i) Each program in the population is executed by assigning some fitness measures like measure like Mean Square Error, Mean Relative Error and so on, that can measure the capability of the model to solve the problem with respect to the experimental data.
(ii) A new population of computer programs is created by applying the following operations described below.
Reproduction: It copies an existing program to the new population.
Crossover: It creates new offspring program(s) for the new population by recombining randomly chosen parts of two existing programs.
Mutation: It produces one new offspring program for the new population by mutating a randomly chosen part one existing program.
The program that is identified by the method of result designation (e.g., the best-so-far individual) is designated as the result of GP system for the run. This result may be a solution (or approximate solution) to the problem [14, 15].
IV. GENE EXPRESSION PROGRAMMING APPROACH
Fig. 4 – Flowchart of gene expression programming [19]
After that the predicted target is compared with the actual one based on the fitness score for each individual. If it satisfies the required fitness measure, then the algorithm stops. If the condition does not fulfil, then some of the chromosomes are selected using roulette wheel sampling and mutated to obtain the new generations. This process is continued until the desired fitness measure is achieved and then the chromosomes are decoded for the best solution of the problem [19, 20] as shown in Fig. 4.
IV. APPLICATION OF GEP FOR CRACK GROWTH RATE DETERMINATION
In the present study, three main parameters i.e. stress intensity factor range (ΔK), maximum stress intensity factor (Kmax) and load ratio (R) that affect the fatigue crack growth rate of 6082 T6 Al-alloy have been selected for input variables, while crack growth rate (da/dN) has been selected as one output variable. The experimental data base contains six sets of data for different load ratios such as R = 0.1, 0.2, 0.3, 0.4, 0.5, and 0.6. Each set consists of crack growth rate (da/dN) data along with their corresponding crack driving parameters i.e. stress intensity factor range (ΔK) and maximum stress intensity factor (Kmax), responsible for crack growth which includes 1200 (300 × 4) data points. Out of those, five sets i.e. R = 0.1, 0.2, 0.3, 0.5, and 0.6 have been used as training sets and the data corresponding to R = 0.4 has been left for testing the generalization capacity of the proposed model.
Yes ET execution
Stop Start
Initial population creation
Chromosome expression as ET
Fitness evaluation
Chromosome selection
Reproduction
New generation creation Terminate?
Given the number of input and output parameters in the training set, the process is characterized as a non-linear stochastic regression analysis. During the training phase the genetic programming tool established several relations (by regression analysis) in the form of computer programs between the input and output variables i.e. output = f(input), or da/dN = f(R, Kmax, ΔK).
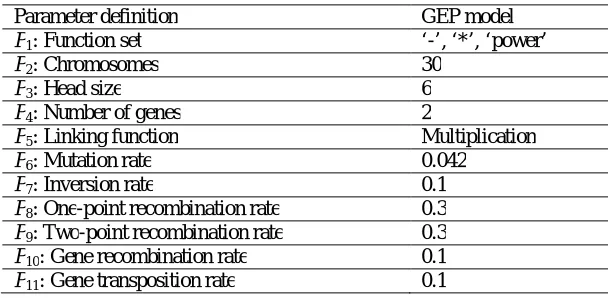
Parameters of the GEP models are presented in Table 3. Using an iterative process the parameters of the established relations were adjusted in order to minimize the error between targeted output and selected program outputs. The same model (the selected evolved program) can be stored and potentially be used to predict other output values for a new applied input data set (i.e. R = 0.4).
Table 3 – Parameters of GEP model
Parameter definition GEP model
P1: Function set ‘-’, ‘*’, ‘power’
P2: Chromosomes 30
P3: Head size 6
P4: Number of genes 2
P5: Linking function Multiplication
P6: Mutation rate 0.042
P7: Inversion rate 0.1
P8: One-point recombination rate 0.3
P9: Two-point recombination rate 0.3
P10: Gene recombination rate 0.1
P11: Gene transposition rate 0.1
V. RESULT AND DISCUSSION
In the present study, GEP model was applied on the training data sets for modeling fatigue crack growth rates for load ratio R = 0.4 which has not been included in training set. The data containing in the training file have been used for learning by applying the fitness function. Subsequently, the new inputs of the test data set (i.e. R = 0.4) have been fed to the trained GEP model to predict the corresponding predicted outputs. The overall performances of both sets have been evaluated by the correlation coefficient (R) and mean squared error (MSE) given by:
2 2 exp exp 1 exp exp predicted dN da predicted dN da erimental dN da erimental dN da predicted dN da predicted dN da m i erimental dN da erimental dN da R (7)
n MSE m i predicted dN da erimental dN da
1 exp (8)Where,
dadN
experimentaland
dadN
predictedare the experimental and predicted crack growth rates,
dadN
experimentaland
dadN
predicted
are their corresponding mean values and ‘n’ is the number of observations. The GEP estimates are compared to the experimental data for training and testing sets. The statistical performance of the model has been presented in Table 4.
0.00E+00 5.00E-04 1.00E-03 1.50E-03 2.00E-03 2.50E-03 3.00E-03
0.00E+00 5.00E-04 1.00E-03 1.50E-03 2.00E-03 2.50E-03 3.00E-03
C
ra
ck
g
ro
w
th
ra
te
, d
a
/d
N
(G
E
P
)
Crack growth rate, da/dN(Exp.) Perfect fit
GP
1.40E-02 3.40E-02 5.40E-02 7.40E-02 9.40E-02 1.14E-01 1.34E-01 1.54E-01 1.74E-01
2.5 2.75 3 3.25 3.5 3.75 4 4.25 4.5 4.75 5
C
ra
ck
g
ro
w
th
ra
te
(
d
a
/d
N
),
m
m
/c
yc
le
Stress intensity factor range (∆K), MPa√m
Experimental
Predicted
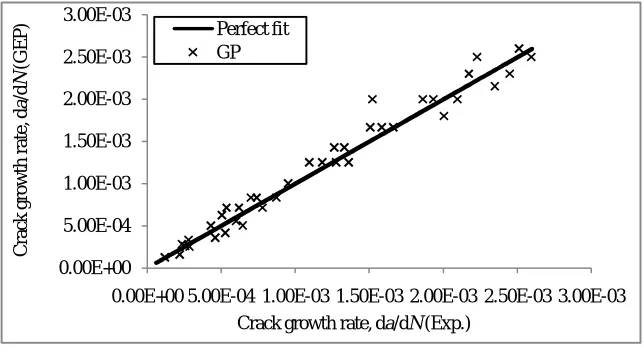
Table 4 – Statistical results of GP for training and testing
Set MSE Corr. Coff. (R)
Train 1.7637 0.9956
Test 2.2587 0.9889
The training results proved that the proposed GEP models have learned well the nonlinear relationship between the input and output variables with high correlation (R = 0.9956) and relatively low error (MSE = 1.7637) values. Comparing the GEP predictions with the experimental data for the test stage (Fig. 5) demonstrates a high generalization capacity of the proposed model (R = 0.9889) and relatively low error (MSE = 2.2587) values.
Fig. 5 – Modelling ability of genetic programming for the test set
All these findings show a successful performance of the GEP model for estimating fatigue crack growth rates in training and testing stages.The testing results of da/dN vs. ∆K in linear as well as in log scale have been presented in Figs. 6 and 7 respectively for 6082 T6 Al-alloy.
15.75 18.75 21.75 24.75 27.75 30.75 33.75
3.50E+04 4.50E+04 5.50E+04 6.50E+04 7.50E+04
C
ra
ck
le
ng
th
(
a
),
m
m
No. of cycle (N) Experimental
Predicted -4.6
-4.1 -3.6 -3.1 -2.6 -2.1
-1.60.88 0.98 1.08 1.18 1.28 1.38 1.48 1.58
L
o
g
(d
a
/d
N
),
m
m
/c
yc
le
Log (∆K), MPa√m
Experimenta l
Fig. 7 – Comparison of predicted and experimental da/dN – ∆K curves in log scale
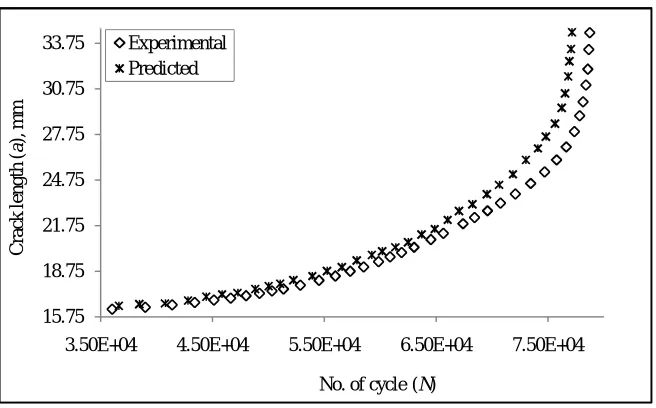
The numbers of cycles have been calculated from predicted and experimental results in the excel sheet (Fig. 8) as per the following equation:
i i i
i N
dN da
a a
N
1
1 (9)
From the a – N plot it has been observed that the fatigue life (at R = 0.4) of 6082 T6 Al-alloy from GEP model is 77133 cycles with an error of – 2.04% in comparison to its experimental value which is 78742 cycles.
Fig. 8 – Comparison of predicted and experimental a – N curves
VI. CONCLUSION
validate the model. From the model result it is found that the proposed GEP model predicts the fatigue life with -2.04% deviations from the experimental results. The proposed model is so simple that it can be used by any one not familiar with GEP. The model also gives a practical way for the prediction of fatigue life of 6082 T6 Al-alloy under load ratio effect to obtain reasonable results and encourages the use of GEP in other aspects of mechanical engineering fields.
REFERENCES
[1] Stofanak, R. J., Hertzberg, R. W., Miller, G., Jaccard, R., and Donald, K., “On the cyclic behaviour of cast and extruded aluminium alloys”, Part A: Fatigue crack propagation, Engineering Fracture Mechanics, vol.17, pp.527–539, 1983.
[2] Vazquez, J. A., Morrone, A., and Ernst, H., “Experimental results on fatigue crack closure for two aluminium alloys”, Engineering Fracture
Mechanics,vol.12, pp.231–240, 1979.
[3] Kardomateas, G. A., and Carlson, R. L., “Predicting the effects of load ratio on the fatigue crack growth rate and fatigue threshold”, Fatigue Fracture Engineering Material Structure, vol.21, pp.411-423, 1998.
[4] Huang, X., and Moan, T., “Improved modelling of the effect of R-ratio on crack growth Rate”, International Journal of Fatigue, vol.29, pp.591- 602, 2007.
[5] Kumar, R., “Investigation of Fatigue Crack Growth Under Constant Amplitude Loading”, International Journal of Pressure Vessels and Piping, vol.41, pp.179-192, 1990.
[6] Brown, W. F., and Srawley, J. E., “Plane strain crack toughness testing of high strength metallic materials”, ASTM STP, Philadelphia, USA, vol. 410, pp. 1, 1966.
[7] Mukherjee, B., “A note on the analysis of fatigue crack growth data”, International Journal of Fracture, vol.8, pp.449–451, 1972.
[8] Smith, R. A., “The determination of fatigue crack growth rates from experimental data”, International Journal of Fracture, vol.9, pp.352–355, 1973.
[9] Davies, K. B., and Feddersen, C. E., “Evaluation of fatigue-crack growth rates by polynomial curve fitting”, International Journal of Fracture, vol.9, pp.116–118, 1973.
[10] Munro, H. G., “The determination of fatigue crack growth rates by data smoothing Technique”, International Journal of Fracture, vol.9, pp.366– 368, 1973.
[11] Mohanty, J. R., Verma, B. B., and Ray, P. K., “Determination of fatigue crack growth rate from experimental data: A new approach”, International Journal of Microstructure & Material Properties, vol.5, pp.79–87, 2010.
[12] Koza, J. R., “Genetic programming: on the programming of computers by means of natural Selection,” MIT Press, London, 1992. [13] Gen, M., and Cheng, R., “Genetic algorithms and engineering design”, USA, Wiley, 1997.
[14] Koza, J. R., Bennett, F. H., Andre, D., and Keane, M. A., “Four problems for which a computer programming performance program evolved by genetic programming is competitive with human”, In: Proceedings of the IEEE international conference on evolutionary computation, pp.1–10, 1996.
[15] Ashour, A. F., Alvarez, L. F., and Toropov, V. V., “Empirical modelling of shear strength of RC deep beams by genetic programming”, Computer Structure, vol.1, no.5, pp.331–338, 2003.
[16] Ferreira, C., “Gene expression programming: a new adaptive algorithm for solving problems”, Complex Systems, vol.13, no.2, pp.87–129, 2001.
[17] Munoz, D. G., “Discovering unknown equations that describe large data sets using genetic programming techniques”, Master’s Thesis, Linkoping Institute of Technology, 2005.
[18] Kose, M., and Kayadelen, C., “Modeling of transfer length of pre-stressing strands using genetic programming and neuro-fuzzy”, Advanced Engineering Software, vol.41, pp.315–322, 2010.
[19] Teodorescu, L., and Sherwood, D., “High energy physics event selection with gene expression programming”, Computer Physics Communications, vol.178, pp.409–19, 2008.
[20] Kayadelen, C., Gunaydın, O., Fener, M., Demir, A., and Ozvan, A., “Modelling of the angle of shearing resistance of soils using soft computing
![Fig. 4 – Flowchart of gene expression programming [19]](https://thumb-us.123doks.com/thumbv2/123dok_us/1618485.1201014/5.595.218.434.150.562/fig-flowchart-gene-expression-programming.webp)