ISSN(Online): 2319-8753 ISSN (Print): 2347-6710
International Journal of Innovative Research in Science,
Engineering and Technology
(An ISO 3297: 2007 Certified Organization)
Website: www.ijirset.com
Vol. 6, Issue 5, May 2017
Automatic Revelation of Hookworm Based On
Graph Cut Method from WCE Images
Saraswathy.N1, Shalini.A2, Annish Brislin.M.R3
UG Student, Department of Electronics and Communication Engineering, Jeppiaar SRR Engineering College,
Chennai, India1
UG Student, Department of Electronics and Communication Engineering, Jeppiaar SRR Engineering College,
Chennai, India2
Assistant Professor, Department of Electronics and Communication, Jeppiaar SRR Engineering College,
Chennai, India3
ABSTRACT: The paper is to deals with the determination of hookworms from the Wireless Capsule Endoscopic (WCE) images. The proposed system for the revelation of hookworm is Graph cut method in segmentation stage and neural network as classifier. Our objective is to detect the hookworm more accurately and to reduce the number of clinician images using Multi-scale Dual Matched Filter (MDMF) in WCE images. This automatic detection system can be used in real conditions to assist endoscopists[4].
KEYWORDS: Wireless capsule endoscopy (WCE), Hookworm, Graph Cut Method(GCM), Neural Network(NN).
I. INTRODUCTION
Wireless capsule endoscopy (WCE) is a disposable, pill-shaped device for gastrointestinal (GI) diagnosis, which was first introduced in year 2001 to identify sources of obscure small bowel bleeding [20]. WCE has rapidly become an important and wide-spread diagnostic technique. WCE is mainly composed of lens, an imaging sensor, light sources, batteries and a radio transmitter system, which provides the inner visualization of the entire gastrointestinal tract. Hookworm is a kind of small tubular structure with greyish white or pinkish semi-transparent body, which is with a number of people infections around the world [6]. WCE images are usually with low contrast and the overall scenes are relatively dark, which are difficult to be recognized. To have clear details and conspicuous texture information, the guided filter [8] is first adopted for WCE image enhancement due to its good performance and efficiency. Since the hookworm bodies demonstrate either lighter or darker patterns compared to surrounding mucosa, meanwhile, hookworms have various orientations and inconsistent widths, Multi-scale Dual Matched Filter (MDMF) is proposed to detect the tubular regions in WCE images[4]. Graph cut provides a clean, flexible formulation for image segmentation. It will detect the potential region of the hookworm bodies. The histogram of average intensity (HAI) is then proposed to represent the intensity patterns of different objects. Neural network tool is proposed to classify the WCE images.
II. RELATED WORK
In recent years, research on WCE becomes a hot topic. Computeraided detection systems based on different techniqueshave been extensively conducted, which bring endoscopistsgreat convenience and efficiency. Comprehensive surveys onWCE research can be found , which summarizethe latest development from different aspects.
ISSN(Online): 2319-8753 ISSN (Print): 2347-6710
International Journal of Innovative Research in Science,
Engineering and Technology
(An ISO 3297: 2007 Certified Organization)
Website: www.ijirset.com
Vol. 6, Issue 5, May 2017
2. Over the last decade, wireless capsule endoscopy (WCE) technology has become a very useful tool for diagnosing diseases within the human digestive tract. This paper proposes a novel synergistic methodology for automatically discovering polyps (protrusions) and perforated ulcers in WCE video frames. Finally, results of the methodology are given and statistical comparisons are also presented relevant to other works.
3. Colorectal polyps are important precursors to colon cancer, a major health problem. Colon capsule endoscopy is a safe and minimally invasive examination procedure, in which the images of the intestine are obtained via digital cameras on board of a small capsule ingested by a patient.
III. HOOKWORMREVELATIONSTAGES
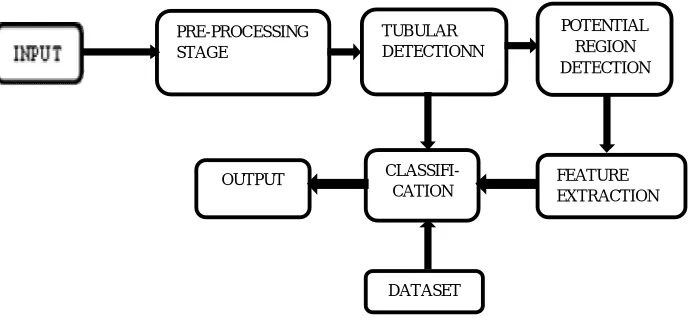
There are five stages in the detection of hookworms, it involves pre-processing stage, tubular detection, segmentation, feature extraction and classification. Some particular algorithm and filters used in this stages. In pre-processing stage Guided filter is used, in tubular detection process Multi-scale Dual Matched filter(MDMF) is used, in segmentation the proposed method Graph cut algorithm is used , in feature extraction Gray Level Co-occurrence Matrix (GLCM) is used and at classification stage Neural network classifier is used.Pre -processing is the common name for operations with images a lowest level of abstraction, both input and output are intensity images. The aim of pre-processing is the improvement of image data that suppresses unwanted distortions or enhances some image features important for further processing. The WCE image is given as the input (fig a) and it is resized into suitable format for further efficient process and the resized image is taken as input for gray scale conversion Then in the pre-processing stage the Gray scale conversion takes place. Here the colour image is converted into gray scale image (fig b). Noises are filtered and it is converted into binary image. This binary image is given as input in the segmentation process.Segmentation is the process of partitioning an image into multiple segments Segmentation has two parts tubular detection and graph cut method. Tubular detection is done with MDMF that with segment only the tubular structure by eliminating the noise (fig c).In the graph cut technique we represent the image in the form of graphs. It containing nodes and vertices like a graph. Graph cut method is used to detect the potential regions. So here it represent the each pixel as a node and the distance between those nodes as the edges (fig d).Feature extraction is done with initial set of data, GLCM is used to extract the value from the initial images which is required by classifier. A GLCM is a matrix, where the number of rows and columns is equal to the number of gray levels, in the image (fig e). Image classification analyses the numerical properties of various image features and organizes data into categories. It compares the extracted values and the in built datasets of hookworm. From this comparison, we can determine whether the hookworm is present or not. If it is present, it provides the stages of hookworm whether it is in beginning or matured stage (fig f).
Fig. 1. Architecture of hookworm revelation
PRE-PROCESSING STAGE
TUBULAR DETECTIONN
FEATURE EXTRACTION
POTENTIAL REGION DETECTION
N
ISSN(Online): 2319-8753 ISSN (Print): 2347-6710
International Journal of Innovative Research in Science,
Engineering and Technology
(An ISO 3297: 2007 Certified Organization)
Website: www.ijirset.com
Vol. 6, Issue 5, May 2017
IV. PRE-PROCESSINGSTAGE
Pre-processing was done for four important reasons they are Pixel brightness transformation, Geometric transformation, Pre-processing method that uses local neighbourhood of processed pixel, Image restoration that requires knowledge about the entire image
1 Getting the input wireless capsule endoscopic image
2 Re-sizing the input image in the size of 256*256 matrix for the further efficient process. 3 Converting the color image into gray scale image using the function, rgb2gray.
4 Considering some value of pixels to be noise (ie -2 to +2), those noise are compared with the gray scale image and that image was displayed as noise coefficient image.
5 With the guided filter the noises present in the gray scale image is eliminated using the function medfilt2() 6 The noise filtered image is converted into binary image by setting threshold value graythresh() to it and by
using the function im2bw()
V. SEGMENTATIONSTAGE
Segmentation is the process of dividing an image into multiple parts. This is typically used to identify objects or other relevant information in digital images. It is divided into two parts
i. tubular region detection ii. graph cut method
TUBULAR REGION DETECTION
Tubular region detection done with multi-scale dual matched filter.The matched filter is a Gaussian-shaped template, which is based on prior information that the cross-section of a vessel is Gaussian-shaped. Since the vessels appear darker than other retinal surfaces, the tubular region will produce a higher response when the matched filter convolves with the image. The intensity of hookworms is either brighter or darker than the mucosa. To capture two different patterns of hookworms, the Dual Matched Filter is used.
1. The binary image is given as input image. Windows size and the epsilon value is assigned for the output in this stage. Epsilon is used for the filtering purposes.
2. The function floor() is used to rounding off the values of pixels. Floor(x) rounds the elements of X to the nearest integers towards minus infinity.
3. Padding is the process of finding noises, to find and remove the noise padarray() is used. 4. Here the padarray( ) performs the circular shift using the function circshift(x,y)
5. To accept the fraction and to increase the precision value the function called double( ) is used.
6. By performing padding and removal of padding noises will be fully removed from the binary image and tubular regions will be detected.
GRAPHCUT METHOD
Graph cut provides a clean, flexible formulation for image segmentation.Graph cuts can be very efficient. Graph cut algorithms are successfully applied to a wide range of problems in vision and graphics. Here it is used in graph cut technique to solve the image segmentation problem.
1. Getting the tubular detection output and applying it in the grab cut algorithm.
ISSN(Online): 2319-8753 ISSN (Print): 2347-6710
International Journal of Innovative Research in Science,
Engineering and Technology
(An ISO 3297: 2007 Certified Organization)
Website: www.ijirset.com
Vol. 6, Issue 5, May 2017
[im_1d, alpha, im_sub] = select_back(im_in)
4. SELECT_BACK Part of Grab cut, it is used to draw a rectangle, out of which becomes background
5. Fore ground and back ground function is used to find high and low pixels to draw graph like structure for the tubular regions.
6. Gaussian value is set as 3. To club or to group the similar values a function called kmeans( ) is used.
VI. FEATURE EXTRACTION STAGE
Feature extraction starts from an initial set of measured data and builds derived values (features) intended to be informative and non-redundant, facilitating the subsequent learning and generalization steps, and in some cases leading to better human interpretations. Feature extraction is related to dimensionality reduction.
1. The output of graph cut method is given to the bwareaopen( ) It will remove small objects from binary image ie., remove the connected components.
2. Finding the minimum and maximum value of the image. The level is set by rounding the minimum and maximum value using the function round( )
3. Gray Level Co-occurrence Matrix (GLCM) is applied using the function
graycomatrix( )
4. To normalize the Gray Level Co-occurrence Matrix graycoprops( ) is used.
5. GLCM has four properties which is applied to the image, they are contrast, correlation, energy, homogeneity.
6. By applying the above properties features will be extracted and that image is graphically represented using histogram function imhist( )
VII. CLASSIFICATION STAGE
Image classification analyses the numerical properties of various image features and organizes data into categories.Classification algorithms typically have two phases of processing: training and testing. In the initial training phase, characteristic properties of typical image features are isolated and, based on these, a unique description of each classification category, i.e. training class, is created. In the subsequent testing phase, these feature-space partitions are used to classify image features.
1. Feature extracted values are converted into matrix. 2. Matlab file is created to the feature extracted matrix.
3. Dataset values are read from wireless capsule endoscopic image which consists of characteristics of hookworm.
4. Matlab file is compared with the datasets of hookworm, in order to classify presence or absence of hookworm. If the hookworm is present then it provide the stage of the hookworm whether it is in beginning stage or matured. Using the function newpnn( )
VIII. SIMULATIONL RESULTS
ISSN(Online): 2319-8753 ISSN (Print): 2347-6710
International Journal of Innovative Research in Science,
Engineering and Technology
(An ISO 3297: 2007 Certified Organization)
Website: www.ijirset.com
Vol. 6, Issue 5, May 2017
Fig (a)
It is Wireless Capsule Endoscopic input image for gastrointestinal diagnosis of hookworm. It is an low contrast image.
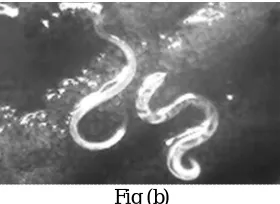
Fig (b)
Input image is converted into gray scale image and noises are filtered. This image is output of pre-processing stage.
Fig (c)
It is the output of tubular detection. It is an segmentation process in which pre-processing image undergoes which padding process for the segregation of tubular structures.
Fig (d)
ISSN(Online): 2319-8753 ISSN (Print): 2347-6710
International Journal of Innovative Research in Science,
Engineering and Technology
(An ISO 3297: 2007 Certified Organization)
Website: www.ijirset.com
Vol. 6, Issue 5, May 2017
Fig (e)
This image has feature extracted values which is shown as histogram average intensity. Graphical representation of pixels is easy to identify the extracted values.
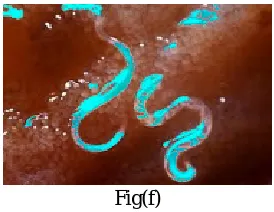
Fig(f)
From the feature extracted value and datasets of hookworm is classified from the input image.
Fig. 2.Simulation output (a) Original WCE image (b) Image after applying to Pre Processing Stage (c) Image after applying MDMF (d)Graph cut output (e) Feature Extraction using GLCM. (f) Classification output image.
IX. CONCLUSION
Computer aided detection of hookworm for WCE images is a challenging task. By observing its unique properties, in this paper, we propose a serial of novel techniques to capture its characteristics, aiming to reduces the number of images a clinician needs to review. Experiments from different aspects demonstrate that the proposed method, graph cut in segmentation and neural network in classification tool for hookworm detection, which achieves promising performance compared to the piecewise parallel region detection in segmentation and rusboost technique in classification stage.
REFERENCES
[1] Chen.H, J. Chen, Q. Peng, G. Sun, and T. Gan, “Automatic hookworm image detection for wireless capsule endoscopy using hybrid color gradient and contourlet transform,” in Proc. 6th Int. Conf. Biomed. Eng. Informat., 2013, pp. 116–120.
[2]Charisis . V .S , L. J. Hadjileontiadis, C. N. Liatsos, C. C. Mavrogiannis, and G. D. Sergiadis, “Capsule endoscopy image analysis using texture information from various colour models,” Comput. Methods Progr.Biomed., vol. 107, no. 1, pp. 61–74, 2012.
[3] Fu .Y, W. Zhang, M. Mandal, and M.-H. Meng, “Computer-aided bleeding detection in WCE video,” IEEE J. Biomed. Health Informat., vol. 18, no. 2, pp. 636–642, Mar. 2014
[4]Fenwick .A, “The global burden of neglected tropical diseases,” Public Health, vol. 126, no. 3, pp. 233–236, 2012.
[5]. Honghan Chen, et.al., “Automatic Hookworm Detection in Wireless capsule endoscopy images” IEEE Trans. Med. Imag., vol. 35, no. 7, july 2016
[6]He.K, J. Sun, and X. Tang, “Guided image filtering,” IEEE Trans. Pattern Anal. Mach. Intell., vol. 35, no. 6, pp. 1397–1409, Jun. 2013.
[7].Iakovidis.D.K andKoulaouzidis . A, “Software for enhanced video capsule endoscopy: Challenges for essential progress,” Nature Rev. Gastroenterol. Hepatol., vol. 12, no. 3, pp. 172–186, 2015.
[8] Iddan. G , G. Meron, A. Glukovsky, and P. Swain, “Wireless capsule endoscopy “ Nature, vol. 405, p. 417, 2000.
ISSN(Online): 2319-8753 ISSN (Print): 2347-6710
International Journal of Innovative Research in Science,
Engineering and Technology
(An ISO 3297: 2007 Certified Organization)
Website: www.ijirset.com
Vol. 6, Issue 5, May 2017
[10] Karargyris .A and N. Bourbakis, “Detection of small bowel polyps and ulcers in wireless capsule endoscopy videos,” IEEE Trans. Biomed. Eng., vol. 58, no. 10, pp. 2777–2786, Oct. 2011.
[11] Kumar . R et al., “Assessment of Crohn's disease lesions in wireless capsule endoscopy images,” IEEE Trans. Biomed. Eng., vol. 59, no. 2, pp. 355–362, Feb. 2012.
[12] Li .B and M. Q.-H.Meng, “Automatic polyp detection for wireless capsule endoscopy images,” Expert Syst. Appl., vol. 39, no. 12, pp. 10 952– 10 958, 2012.
[13] Li. B and M.-H. Meng, “Tumor recognition in wireless capsule endoscopy images using textural features and SVM-based feature selection,” IEEE Trans. Inf. Technol. Biomed., vol. 16, no. 3, pp. 323–329, May 2012.
[14] Li .B and M. Q.-H.Meng, “Wireless capsule endoscopy images enhancement via adaptive contrast diffusion,” J. Vis. Commun. Image Represent., vol. 23, no. 1, pp. 222–228, 2012.
[15]Mamonov.A, I. Figueiredo, P. Figueiredo, and Y. Tsai, “Automated polyp detection in colon capsule endoscopy,” IEEE Trans. Med. Imag., vol. 33, no. 6, pp. 1488–1502, Jun. 2013.
[16]Szczypiński.P, A. et.al., “Texture and color based image segmentation and pathology detection in capsule endoscopy videos,” Comput.Methods
Programs Biomed., vol. 113, no. 1, pp. 396–411, 2014.
[17]Sainju.S, F. M. Bui, and K. A. Wahid, “Automated bleeding detection in capsule endoscopy videos using statistical features and region growing,” J. Med. Syst., vol. 38, no. 4, pp. 1–11, 2014.
[18] Shen . Y, P. Guturu, and B. P. Buckles, “Wireless capsule endoscopy video segmentation using an unsupervised learning approach based on probabilistic latent semantic analysis with scale invariant features,” IEEE Trans. Inf. Technol. Biomed., vol. 16, no. 1, pp. 98–105, Jan.2012. [19] Seshamani . S, R. Kumar, G. Mullin, T. Dassopoulos, and G. D. Hager, “A meta method for image matching,” IEEE Trans. Med. Imag., vol. 30, no. 8, pp. 1468–1479, Aug. 2011.