Drowsiness Detection Using Preused Database
of EEG Sensor for Accident Prevention
Varad P. Diwakar1, Ramesh R. Jangid2, Vallabh R. Pathak3, S.Y.Sawant4
Student, Department of ETC, PCCOE, Nigdi, Pune, Savitribai Phule Pune University, Pune, India.123
Professor, Department of ETC, PCCOE, Nigdi, Pune, Savitribai Phule Pune University, Pune, India.4
ABSTRACT: A tiredness identification framework utilizing both mind and visual action is exhibited in this paper. The mind action is observed utilizing a solitary electroencephalographic (EEG) channel. An EEG-based sluggishness finder utilizing indicative procedures and Fuzzy rationale is proposed. Visual action is checked through flickering recognition and portrayal. Squinting components are separated from an electrooculographic (EOG) channel. Elements are consolidated utilizing Fuzzy rationale to make an EOG-based sleepiness identifier. The components utilized by the EOG-based indicator are deliberate limited to the elements that can be naturally extricated from a video examination of the same exactness. Both discovery frameworks are then combined utilizing falling choice guidelines as per a therapeutic size of sluggishness assessment. Blending mind and visual data makes it conceivable to distinguish three levels of sluggishness: "conscious," "sleepy," and "exceptionally lazy." One noteworthy point of interest of the framework is that it doesn't need to be tuned for every driver. The framework was tried on driving information from 20 unique drivers and achieved 80.6% right orders on three laziness levels. The outcomes demonstrate that EEG and EOG finders are repetitive: EEG-based location is utilized to affirm EOG-based identification and accordingly empower the false caution rate to be diminished to 5% while the genuine positive rate is not diminished, contrasted and a solitary EOG-based identifier.
KEYWORDS: Blinking analysis, cascading rules decision, drowsiness, electroencephalographic (EEG), electrooculographic (EOG), fuzzy logic.
I. INTRODUCTION
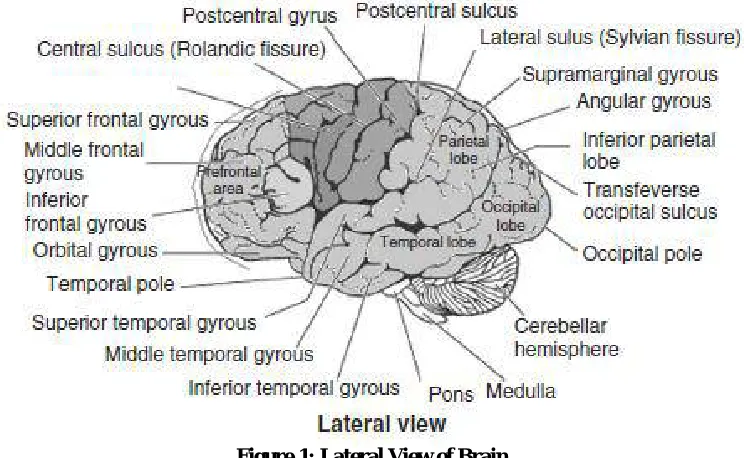
Figure 1: Lateral View of Brain
pacemaker properties. The latter may be designated as neuronal oscillators (Madler et al 1991; Kasanovich and Borisyuk 1994; Abarbanel et al 1996). The oscillators have their own discharge frequency, various among different oscillators and dependent on their internal connectivity (Figure 1), in spite of close intrinsic electrophysiological properties of single neurons which constitute different oscillators. The neuronal oscillators start to act in synchrony after application of external sensory stimulation (Lopes da Silva 1991; Basar 1992) or hidden signals from internal sources.
II. MOTIVATION
The development of a human bio signal based drowsy state monitoring system for drivers has become a major focusing the field of safety driving and accident prevention because drivers fatigue has been implicated as a causal factor in many car accidents. Accidents caused by drowsiness at the wheel have a high fatality rate because of the marked decline in the Driver’s abilities of perception, recognition and vehicle control abilities while sleepy.[1] Even though each driver thinks that he/she can control the vehicle very well at all times, there still are some risks happened due to drivers tiredness, drowsiness, or inattention. Driver drowsiness is an important factor in the motoring of vehicle accidents. It was demonstrated that driving performance deteriorates with increased drowsiness resulting into crashes constituting more than 20% of all vehicle accidents. Traditional transportation system is no longer sufficient. Recently an artificial intelligence technique has emerged and gaining popularity among transportation researchers.If the real time situations are observed during the constant working environment in industries and while driving vehicles for prolonged hours, humans tend to get very tired and feel fatigued. This fatigue-ness affects their mental state and there comes a point where humans do lose control over themselves and fall asleep. While in an industry, they deal with heavy machineries and if a little deviation of attention of theirs can lead to fatal mishaps.[2] Also, while driving one needs to be quiet attentive as the roads are never empty or straight. Deviating attention due to drowsiness proves to be fatal and so here we have proposed a system, which takes the mental state data, processes them, compares the values with predefined values defined from doctors and generate an alarm or warning for them to have rest or break.To continue with some examples as, Company's business processes may require the service for 24 hours a day. However, this could cause some problems.[4] For example, a worker lost his hand because of drowsiness while working in a wood cutting machine. A young even lost his life because working in a sleepy condition.Car driving is very prone to accident due to drowsiness. According to Directorate General of Land Transportation, Department of Transportation, accident that occurred is 93.52% caused by drowsiness.Researches for early drowsiness detection have been done by previous researchers. Various methods have been used, such as Carafe, a method based on eye's blink through Computer Vision technology. It utilized camera on a Smartphone. Its accuracy to detect drowsiness was up to 85%.[1]Drowsiness is the common thing that happens to every human. However, this could cause some problems. There have been many accidents happen, that worker must lose the part of his/her body, disability, and even life because of the drowsiness factor while doing work. In addition to solve this matter, an application is needed to give warning for workers when it detects the drowsiness. By using the brainwave receiver sensor, the application can give early warning in real-time based on worker condition. This research involves subjects were using perused database from EEG & EOG sensors and after doing some feature extraction we can give warning to driver as per level of drowsiness by implementing alarm system or by giving driver some audio message for avoiding accidents.
III. BACKGROUND
main disadvantage of this approach is that driving behavior may be very different from one driver to another. This makes it difficult to construct a “correct driving” model that can be used to detect variations in driving behavior. This model has to be learnt for each driver. The second kind of system is the “driver-oriented” systems. Drowsiness is detected using physiological information, measured by sensors located on or around the driver (electrodes, camera, etc.) such as cerebral activity, eye activity, facial expressions, yawns, or gaze direction. These driver-oriented systems are more reliable because physiological drowsiness signs are well known and rather similar from one driver to another. However, one drawback with placing sensors on the driver is that they should not bother him.
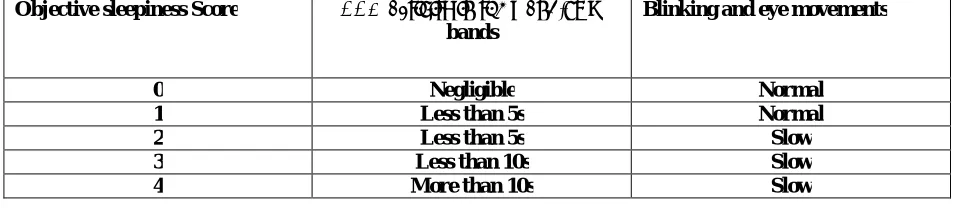
Objective sleepiness Score EEG activity in the α and/or Ө
bands
Blinking and eye movements
0 Negligible Normal
1 Less than 5s Normal
2 Less than 5s Slow
3 Less than 10s Slow
4 More than 10s Slow
TABLE 1: OBJECTIVE SLEEPINESS CRITERIA
Other studies have focused on the analysis of visual signs, such as blinking or visual gaze, to detect driver drowsiness. Very good indicators of drowsiness can therefore be extracted from blinking analysis . These signs are traditionally extracted using an electrooculogram (EOG) which measures electrical eye activity. Various classification techniques to detect drowsiness from blinking features such as partial least squares regression-based fusion model or fuzzy fusion have been tested. Blinking analysis can also be processed using a video camera. A recent study showed that some blinking features can be extracted with the same accuracy from a video analysis as from an EOG analysis. Most drowsiness detection systems based on video analysis are nevertheless based on two features: the duration of the blinking and the direction of the gaze. Recent study has suggested using also facial cues such as yawning and eyebrows rising.
IV. LITERATURE SURVEY
Many brain disorders are diagnosed by visual inspection of EEG signals. The clinical experts in the field are familiar with manifestation of brain rhythms in the EEG signals. In healthy adults, the amplitudes and frequencies of such signals change from one state of a human to another, such as wakefulness and sleep. The characteristics of the waves also change with age. There are five major brain waves distinguished by their different frequency ranges. These
frequency bands from low to high frequencies respectively are called alpha (α), theta (θ), beta (β), delta (δ), and gamma (γ).Four basic rhythms have been associated with various states:
Rhythm Freq (Hz) Amp(μV)
Alpha 8-13 20-200
Beta 13-30 5-10
Delta 1-5 20-200
Theta 4-8 10
Gamma 30-45 10-100
Table 2: EEG Frequency Bands
reduced or eliminated by opening the eyes, by hearing unfamiliar sounds, by anxiety, or mental concentration or attention. In general, the alpha rhythm is the prominent EEG wave pattern of an adult who is awake but relaxed with eyes closed. Alpha waves appear in the posterior half of the head and are usually found over the occipital region of the brain. They can be detected in all parts of posterior lobes of the brain. For alpha waves the frequency lies within the range of 8–13 Hz, and commonly appears as a round or sinusoidal shaped signal. However, in rare cases it may manifest itself as sharp waves. In such cases, the negative component appears to be sharp and the positive component
appears to be rounded, similar to the wave morphology of the rolandic mu (μ) rhythm.An alpha wave has a higher amplitude over the occipital areas and has an amplitude of normally less than 50 μV.
Figure 2: Alpha Signal
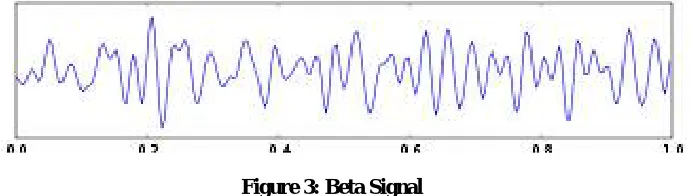
Beta: A beta wave is the electrical activity of the brain varying within the range of 14–26 Hz (though in some literature no upper bound is given). A beta wave is the usual waking rhythm of the brain associated with active thinking, active attention, focus on the outside world, or solving concrete problems, and is found in normal adults. A high-level beta wave may be acquired when a human is in a panic state. Rhythmical beta activity is encountered chiefly over the frontal and central regions. Amplitude of beta rhythmic normally under 30 μV.
Beta rhythms occur in individuals who are alert and attentive to external stimuli or exert specific mental effort, or paradoxically, beta rhythms also occur during deep sleep, REM (Rapid Eye Movement) sleep when the eyes switch
back and forth. This does not mean that there is less electrical activity rather that the ―positive‖ and ―negative‖
activities are starting to counterbalance so that the sum of the electrical activity is less. Thus, instead of getting the wave-like synchronized pattern of alpha waves, resynchronization or alpha block occurs. So, the beta wave represents arousal of the cortex to a higher state of alertness or tension. It may also be associated with ―remembering‖ or retrieving memories.
Figure 3: Beta Signal
Figure 4: Delta Signal
Theta: Theta waves lie within the range of 4–7.5 Hz. The term theta might be chosen to allude to its presumed thalamic origin. Theta waves appear as consciousness slips towards drowsiness. Theta waves have been associated with access to unconscious material, creative inspiration and deep meditation. A theta wave is often accompanied by other frequencies and seems to be related to the level of arousal.
Although delta and theta rhythms are generally prominent during sleep, there are cases when delta and theta rhythms are recorded from individuals who are awake. For example, theta waves will occur for brief intervals during emotional responses to frustrating events or situations. Delta waves may increase during difficult mental activities requiring concentration. In general, the occurrence and amplitudes of delta and theta rhythms are highly variable within and between individuals.
Figure 5: Theta Signal
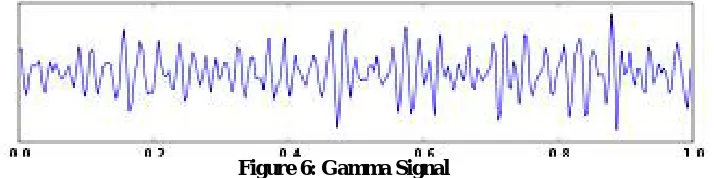
Gamma: The frequencies above 30 Hz (mainly up to 45 Hz) correspond to the gamma range (sometimes called the fast beta wave). Although the amplitudes of these rhythms are very low and their occurrence is rare, detection of these rhythms can be used for confirmation of certain brain diseases. The regions of high EEG frequencies and highest levels of cerebral blood flow (as well as oxygen and glucose uptake) are located in the fronto-central area.
The gamma wave band has also been proved to be a good indication of event-related synchronization (ERS) of the brain and can be used to demonstrate the locus for right and left index finger movement, right toes, and the rather broad and bilateral area for tongue movement.
Figure 6: Gamma Signal
V. SYSTEM ARCHITECTURE
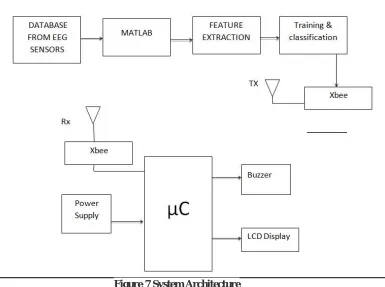
Figure 7 System Architecture
Explanation-
This block consists of the raw EEG data which are acquired from a sensor or any related perused data of EEG can be a part of this block. The data may look as follows; this is the block where the sensed data from the sensor or database is fed to. Further using MATLAB we can perform various operations to process the data in the form required by us.After the data has reached the MATLAB, we do a process called feature extraction. This process comprises of algorithms that work upon mathematically to get values of the variables needed by us. These variable values are useful in determining the characteristics of the wave shown above and hence we predict the state of the mind by just knowing these characteristics. Operations such FFT, STFT, windowing, amplitude detection are carried out here with the help of the algorithms.This part is responsible for blink detection of the eye so that it helps in detecting the drowsiness condition more accurately and thus increasing the efficiency of the system.The Xbee modules work at the 2.4 GHz frequency which means smaller board and antenna size. Xbee modules have the ability to transmit Digital, PWM,
Analog or Serial RS232 signals wirelessly.
SOFTWARE USED 1) Multisim12.0 2) MPLAB Pro for PIC 3) Proteus7.9
VI. METHODOLOGY USED
Here we have cross correlation method. In this method training signal parameters are computed and stored in one array. And now we take one random signal (drowsy or Normal). And this signal will compare with training signal. And as where the maximum match is find at that place which signal is stored will be displayed.
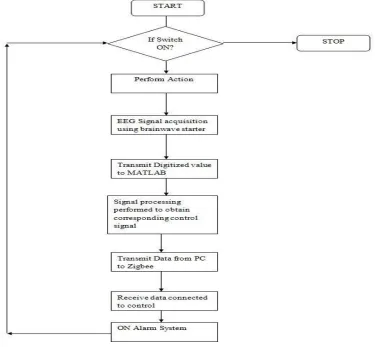
VII. ALGORITHM USED
Firstly the training signals are made input to the system, sampled and plotted in MATLAB.Each and every signal of training signals are to be decomposed through “wavedec” function to getthe Approximation and Detail coefficients with level 8.Now the last four coefficients, out of total eight coefficients of detail and approximation coefficients gives information about gamma, beta, alpha, theta and delta states of an EEG signal.Then standard mean, deviation and maximum frequency are found out of each coefficient of our interest and also plotted. These parameters are stored in an array for each signal and stored in the memory as Train_FE. Array is of 15bit each and the database for reference signals is prepared.Now a random EEG file of “.mat” format is made input to the system and same procedure of decomposition of wave and storing it is followed as done earlier for training signals with the name asFE1.Then both the Train_FE and FE1 files are loaded and each array of Train_FE is compared with FE1array through Cross Corelation function.This gives us the best match of FE1 array from the Train_FE file, and hence the Input signal isclassified as drowsy or awake signal.
IX. RESULTS
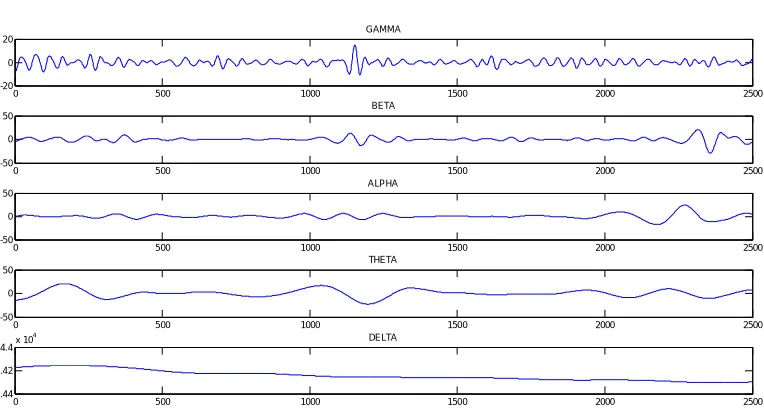
Figure 9:EEG signal contains all alpha ,beta ,theta ,delta,gamma signals with sampling frequency of 50Hz
Figure10 : Decomposed EEG signal with alpha,beta,theta,delta components
0 500 1000 1500 2000 2500
-4.44 -4.435 -4.43 -4.425 -4.42 -4.415
-4.41x 10
4 EEG Signal
0 500 1000 1500 2000 2500
-20 0 20
GAMMA
0 500 1000 1500 2000 2500
-50 0 50
BETA
0 500 1000 1500 2000 2500
-50 0 50
ALPHA
0 500 1000 1500 2000 2500
-50 0 50
THETA
0 500 1000 1500 2000 2500
-4.44 -4.42
-4.4x 10
Figure 11: GUI For training and testing the EEG signal
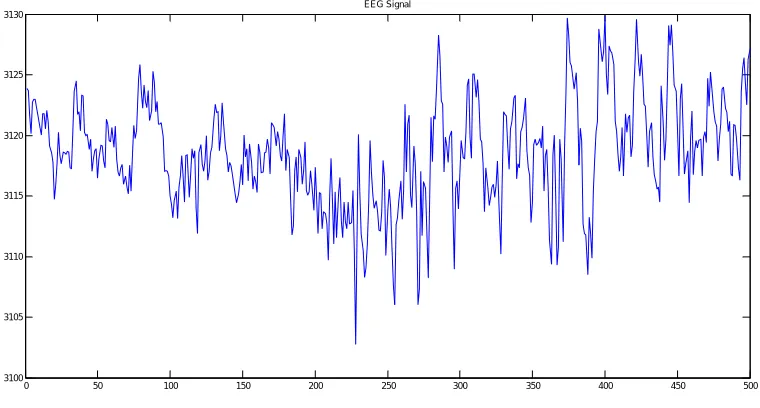
Figure 12:Standard EEG signal 1
0 50 100 150 200 250 300 350 400 450 500
3100 3105 3110 3115 3120 3125 3130
Figure 13:Standard EEG signal 2
Figure 14:Standard EEG signal 3
0 50 100 150 200 250 300 350 400 450 500
-4.424 -4.422 -4.42 -4.418 -4.416 -4.414 -4.412
-4.41x 10
4 EEG Signal
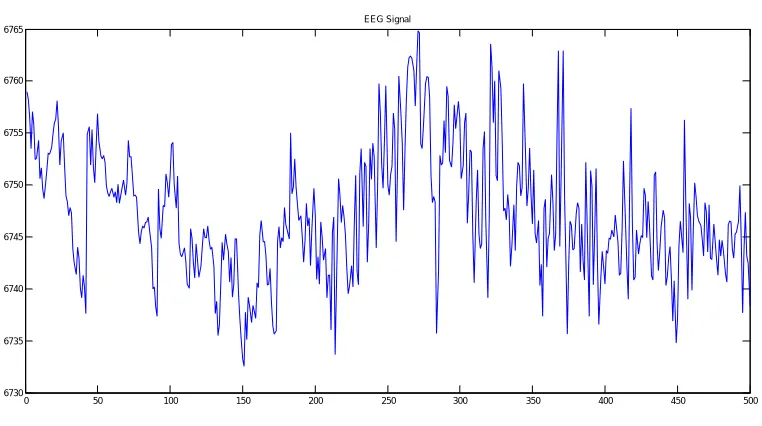
0 50 100 150 200 250 300 350 400 450 500
6730 6735 6740 6745 6750 6755 6760 6765
Figure 15:Standard EEG signal 4
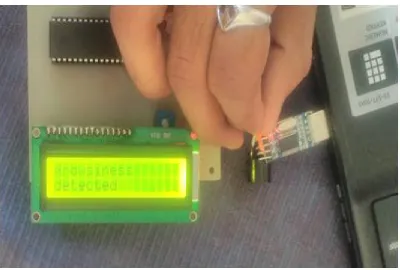
Figure 16: Drowsiness Detection
0 50 100 150 200 250 300 350 400 450 500
1.1585 1.159 1.1595 1.16 1.1605 1.161 1.1615 1.162 1.1625 1.163 1.1635x 10
ADVANTAGES
1. By using EEG signals we can predefined the drivers condition by analyzing the sensor outputs i,e from alpha and beta ranges and from that we can have our further system for the accident prevention due to driver’s drowsiness
2. Our system can also be used in various workplace for determining conditions of workers through EEG sensors and so that we can take further remedy actions
APPLICATIONS
1. Cars, Locomotives and other vehicles to avoid accidents
2. Can be implemented at extreme work places to avoid fatal accidents 3. Can be used in the field of stress management
X. CONCLUSION
In this project we have cross-correlation algorithm for finding the input signal is either drowsy or awake signalFirst we have created training datasets from standard EEG and awake signals and we compute standard deviation, mean and maxim frequency of that signals and all these features stored in one array. Now as we give input signal it will compare with all the above training signals and where maximum match is found then corresponding that state is detected as drowsy state is detected signal send through Zigbee to microcontroller and buzzer will turn on. So we can alert driver which is driving. We can use actual sensors for taking real time signals and performing drowsy state or awake state.We can implement vehicle to vehicle communication for alerting the vehicles coming from front side.We can Raspberry Pi, DSP processor as a replacement of laptop or desktop where our model can become actual product.Artifact detection also includes in this part to achieve high accuracy.
REFERENCES
[1] Shah Aqueel Ahmed1, Syed Abdul Sattar2, D. Elizabath Rani3, “Separation Of , , & Activities In EEG To Measure The Depth Of Sleep And Mental Status”, International Journal of Engineering Trends and Technology (IJETT) Volume 4 Issue 10 Oct 2013,ISSN: 2231- 5381 Page 4618
[2] Ms. Pranjali Deshmukh, Mr. S. B. Somani, Ms. Shivangi Mishra, Mr. Daman Soni, “EEG based drowsiness estimation using mahalanobis distance”, ISSN: 2277 – 9043International Journal of Advanced Research in Computer Science and Electronics Engineering Volume 1, Issue 6, August 2012
[3] G.Rajendra Kumar1 ,Dr.SamuelVaraPrasada Raju2, D. Santhosh Kumar3 ,I.T Dept., C.S.E Dept., Eng. Physics Dept, , K L University, Andhra University, VCEW Vijayawada,Visakhapatnam, Bargarh, India,” classification of eeg signals for drowsiness Detection in brain and computer interface” GESJ: Computer Science and Telecommunications 2012|No.4(36) ISSN 1512-1232
[4] B.jothiranjhani ,m.e(est), AnnaiMathammalSheela Engineering College, “wireless brain computer interface system for drowsiness detection” International Journal of Communications and Engineering, Volume 05–No.5,Issue: 02 March2012, Page 86
[5] A. Picot, S. Charbonnier, and A. Caplier, “Monitoring drowsiness on-line using a single encephalographic channel,” in Recent Advances in BiomedicalEngineering. Rijeka, Croatia: IN-TECH, 2009, pp. 145–164.
[6] G. Renner and S. Mehring, “Lane departure and drowsiness—Two major accident causes—One safety system,” Transport Res. Lab., Berkshire, U.K., Tech. Rep., 1997.
[7] M. Gillberg, G. Kecklund, and T. Akerstedt, “Sleepiness and performance of professional drivers in a truck simulator—Comparisons between day and night driving,” J. Sleep Res., vol. 5, no. 1, pp. 12–15, Mar. 1996.
[8] A. Muzet, T. Pébayle, J. Langrognet, and S. Otmani, “AWAKE Pilot Study No. 2: Testing steering grip sensor measures,” CEPA, Gatineau, QC, Canada, Tech. Rep. IST-2000-28062, 2003.
[9] T. Vöhringer-Kuhnt, T. Baumgarten, K. Karrer, and S. Briest, “Wierwille’s method of driver drowsiness evaluation revisited,” in Proc. Int. Conf.Traffic Transp. Psychol., 2004, vol. 3, pp. 5–9.
[10] T. Akerstedt and M. Gillberg, “Subjective and objective sleepiness in the active individual,” Int. J. Neurosci., vol. 52, no. 1/2, pp. 29–37, May 1990.
[11] S. Otmani, T. Pebayle, J. Rogé, and A. Muzet, “Effect of driving duration and partial sleep deprivation on subsequent alertness and performance of car drivers,” Physiol. Behav., vol. 84, no. 5, pp. 715–724, Apr. 2005.
[12] P. Caffier, U. Erdmann, and P. Ullsperger, “Experimental evaluation of eyeblink parameters as a drowsiness measure,” Eur. J. Appl. Physiol., vol. 89, no. 3/4, pp. 319–325, May 2003.
[13] N. Galley, R. Schleicher, and L. Galley, “Blink parameter as indicators of driver’s sleepiness—Possibilities and limitations,” Vis. Veh., vol. 10, pp. 189–196, 2004. [14] K. Ben Khalifa, M. Bédoui,M. Dogui, and F. Alexandre, “Alertness states classification by SOM and LVQ neural networks,” Int. J. Inf. Technol., vol. 1, no. 4, pp. 228–231, 2004.