Wilson).
When evaluating job worth, organizations often use job analysis data in a process known as job evaluation. Some organizations and researchers use a policy capturing approach as it shows promise of being cost effective for organizations in addition to offering structure and transparency in the job evaluation process. Utilizing job components from an aggregated job analysis database, such as the Occupational Information Network (O*NET) or the Dictionary of Occupational Titles (DOT), could help with reducing costs and creating more structure. The aim of this study was to examine the efficacy of two approaches to aggregation of job analysis data (the O*NET and DOT) in their prediction of national wage data. The
by
Brandy Nicole Parker
A thesis submitted to the Graduate Faculty of North Carolina State University
in partial fulfillment of the requirements for the degree of
Master of Science
Psychology
Raleigh, North Carolina 2011
APPROVED BY:
_______________________________ ______________________________
Dr. Adam Meade Dr. Mark Wilson
Committee Co-Chair Committee Co-Chair
BIOGRAPHY
ACKNOWLEDGMENTS
I would like to thank my committee – Dr. Lori Foster-Thompson, Dr. Adam Meade, and Dr. Mark Wilson – for their feedback and support during this important milestone. Without your positive encouragement and occasional razzing, I don’t know that I would have made it this far.
Secondly, I want to thank my family. My brother, James Dominic Parker, has also been my friend. He can bring out a smile or laugh from me without fail, which I appreciate in times of stress or heartache. My parents, Cheryl and Jim Parker, have given me their endless love and support. They have made countless sacrifices for both me and my brother and I will be forever grateful.
TABLE OF CONTENTS
LIST OF TABLES ... vi
LIST OF FIGURES ... vii
Policy Capturing National Wage Data Using O*NET and DOT Job Components as Predictors ... 1
Occupational Information Network ... 3
Dictionary of Occupational Titles ... 4
Job Component Validity... 5
Policy Capturing ... 6
Weights... 7
Method ... 9
Samples ... 9
Measures... 10
Results ... 12
Prediction ... 12
Weighting ... 13
Discussion ... 14
Limitations and Future Research... 17
References ... 20
Footnotes ... 25
APPENDIX ... 30
LIST OF TABLES
LIST OF FIGURES
Policy Capturing National Wage Data Using O*NET and DOT Job Components as Predictors
The job market is always changing. As organizations shift focus to different products and designs, they might be faced with creating new positions or engaging in substantial restructuring. With new positions and restructuring comes the struggle and cost of
performing job analyses and setting wages. Using components or factors that make up a job, an organization can discern the aspects of each job that contribute to organizational value, a process known as job evaluation. Since the 1940s, the use of job evaluation has become widespread with various firms and consultants offering their services, each with their own approach to the process of setting wages (Arnault, Gordon, Joines, & Phillips, 2001). Some organizations and researchers use a policy capturing approach; a method by which existing wage structures are captured using regression analysis. This method shows some promise for organizations given its cost effectiveness, in addition to offering more structure and
transparency to the job evaluation process. Policy capturing makes use of job analysis by aggregating the data into job components. What is not well understood is the relative efficacy of various levels of aggregated job analysis data.
Following this is a general definition for policy capturing and discussion of how it can be used in the present context. Studies that examined the use of weights within job evaluation are identified. Concluding this section is a more detailed explication of the research
questions examined in this study.
designed to replace the DOT (Peterson et al., 1991; www.oalj.dol.gov/libdot.htm), it contains current information and is designed to include emerging work and occupations that did not exist when the DOT was last updated (http://onetcenter.org).
Occupational Information Network
2008; Rotundo & Sackett, 2004), no one has specifically examined O*NET job components as predictors of wages.
Dictionary of Occupational Titles
The DOL has been collecting data on jobs in the American economy since the 1930s (Peterson et al., 2001). These job analysis data were compiled into the DOT (U.S.
Department of Labor, 1991). The last revision to the DOT was the Fourth Edition, revised in 1991. Research utilizing the DOT includes “matching people to jobs, disability
Job Component Validity
The process of using job components for the purpose of prediction is most commonly recognized as JCV. Most researchers are familiar with using this approach for selection purposes, often considering it as either a form of, or synonymous with, synthetic validity. Lawshe (1952) introduced the idea of synthetic validity as a way to establish validity for a selection test through examining the requirements of the job. Balma (1959) expanded this definition: “The inferring of validity in a specific situation from a logical analysis of jobs into their elements, and a combination of those elemental validities into a whole" (p. 395). After the introduction of synthetic validity, researchers developed various approaches for conducting it, including the J-coefficient, Guion’s approach, and JCV (Scherbaum, 2005; see also Johnson, 2007).
McCormick (1959) first outlined JCV as a way to obtain indirect (synthetic) validity, in order to determine predictors for jobs. First, the “ingredients or attributes that are common to two jobs or types of jobs” are gleaned from a job analysis (p. 403). After a predictor is validated for one job, the information can be extended to jobs with the same “common denominator” (i.e., job component). Although initially proposed as an approach to synthetic validity, McCormick (1979) later stated that “synthetic validity has also been called
purpose of job evaluation. Researchers often use job components to predict wages. Job component validity, when applied to wages, is generally referred to as policy capturing.
Policy Capturing
“Policy capturing encompasses any job evaluation process that attempts to link internal measures of job worth (i.e., content) with criterion wage rates,” (Davis & Sauser, 1991, p. 89). In the general sense, policy capturing is the use of judgments or factors to predict a given outcome or criterion; this relationship is analyzed using multiple regression. It is a commonly employed method for setting wages, typically involving researchers’ or subject matter experts’ judgments of the job analysis data and some form of data aggregation.
Using policy capturing in wage setting, job analyses are often evaluated and aggregated into job compensable factors (or job components) which are used to make comparisons across jobs by means of regression analysis. These job components can be differentially weighted in the regression, which can allow for distinction of those factors that contribute most to the differences in wages. In order to create the policy capturing (or job evaluation) model, benchmark jobs are used. Benchmark jobs are a sample of jobs
considered stable by the organization. They are “selected to represent the normal hierarchy of responsibility and skill to which the prediction model will be applied” (Davis & Sauser, p. 100). These benchmarks and their known wages are used in the initial regression equation, capturing the wage setting values of the organization.
model allows organizations to establish the appropriate wage for other jobs and positions that may have been restructured or newly created. This process is one of a number of techniques most often referred to as job evaluation. Researchers or compensation specialists use the job analyses from a large sample of jobs and determine how best to aggregate the data into job components/factors and the weights for those factors. The process could be called policy capturing using job components as predictors of wages.
The job components/factors that are derived from job analysis data can be
determined via factor analysis or by expert judgment. The factors are often weighted either rationally or statistically. Rational weights are just that: weights based upon rational judgment. Statistical weights are commonly derived from regression analyses, taking the beta weights from a benchmark sample and applying them across other jobs. (For more information on conducting policy capturing see Aiman-Smith, Scullen, & Barr, 2002; Karren & Barringer, 2002.)
Weights
“equal nominal weights are derived in different ways”; they identify equal weights more specifically as natural weights and unit (simplified) weights (pp. 92-93). When referring to equal unit weights, researchers typically use a weight of 1.0 for all factors, essentially
summing across predictors (e.g., Van Sliedregt, Voskuijl, & Thierry, 2001). Although Davis and Sauser (1991) refer to this method as “natural weighting” (a type of equal weighting), for the purposes of this study I refer to this method as equal unit weights. As previously stated, statistical weights are derived via regression using a benchmark sample.
The purpose of this study was to use a policy capturing approach to examine the relationship between job components at two different levels of aggregation and their efficacy in predicting wages (see Figure 1). More specifically, how much of the variance in national median wages is accounted for by job components from the DOT and from the O*NET? Additionally, this study examined the effects of weighting methods on the relationship between job components and wages. Specifically, do statistical or equal unit weights
moderate the relationship between job components (from the DOT and O*NET) and wages?
Method
Samples
The samples used in this study came from the O*NET and the DOT. I selected all OUs from the O*NET that met a wage cutoff described below. Each OU was linked to a corresponding list of job titles from the DOT. The National Crosswalk Service Center (NCSC) website provided a crosswalk between OUs and DOT job titles
(www.xwalkcenter.org). The number of DOT titles linked to one OU ranged from 1 to over 100. To create matched samples, I selected a prototypical DOT job title from the list
associated with each OU. This prototypical title was selected primarily based on the wording of job title from the DOT as it compared to wording of the OU title from the O*NET.
Both the O*NET and the DOT samples were split for subsequent cross-validation of the regression equations created from the statistical weights, thus resulting in four samples: one initial sample and one cross-validation sample from both the O*NET and the DOT. In splitting the data, I used two thirds for the derivation samples and one third for the cross-validation samples. The total sample size was 744, resulting in sample sizes of 496 and 248 for derivation and cross-validation, respectively. These split samples had approximately equal distribution of wages because they were stratified based on the wage data. To do this, I segmented the wage data at the 20th, 40th, 60th, and 80th percentile and randomly selected one third of the job titles from each quintile for the holdout sample.
Measures
DOT job components. The job components from the DOT consisted of the Worker
Functions ratings. These ratings are the fourth, fifth, and sixth digits of the DOT job code and are identified as data, people, and things, respectively. The aggregation of information into the data, people, and things categories is based on Fine’s Functional Job Analysis approach (for more information see Fine, Harvey, & Cronshaw, 2004). These three job components are consensus ratings based on several job analysts’ ratings of each job
contained in the DOT. The data ratings range from 0 to 6, people ratings range from 0 to 8, and things ratings range from 0 to 7. For each code, a lower rating indicates a more complex component (see U.S. Department of Labor, 1991). These data were reverse coded to
O*NET job components. Peterson et al. (2001) suggested that Generalized Work Activities (GWAs) could serve as compensable factors in job evaluation efforts. Therefore, job components from the O*NET consisted of the 41 GWAs. These fall under the
occupational requirements domain, as outlined by the O*NET Content Model (Peterson et al., 2001). For the majority of the OUs, each GWA is rated by job incumbents on a 5-point Likert-type scale of importance ranging from 1 (not important) to 5 (extremely important), which is averaged and converted to a 100-point scale. All 41 GWAs were included initially. These data were downloaded from the NCSC website (2000a). Because of the substantial difference in the number of potential job components contained within the O*NET system relative to the DOT system, stepwise regression was employed as an O*NET job component descriptor data reduction technique (see Appendix). This also helped reduce multicolinearity within the GWAs. The top three O*NET job components (GWAs) were retained:
“Analyzing data or information” (analyzing), “thinking creatively” (creative), and “provide consultation and advice to others” (advice).
Wages. Wage data were from the 2008 Occupational Employment Statistics survey.
middle-income jobs. To control for this, only wages that fell within two standard deviations of the mean of the medians were included in the analysis.
Weights. For the analyses, I used both statistical and equal unit weights. Statistical weights were included because they are the most commonly employed weighting method. I chose to include equal unit weights for contrast, because they imply that each job component contributes equally to wage determination. Additionally, Davis and Sauser (1991) stated that equal unit weights “deserve more consideration for use in job evaluation” (p. 92). The statistical weights came from conducting a multiple regression with both the DOT and O*NET derivation samples; the standardized beta weights associated with each job component were applied in the cross-validation sample. For the equal unit weights, I summed the values of job components, creating a job component composite. Wages were regressed on the job component composite. Following Davis and Sauser (1991; 1993), differences between the statistical and equal unit weight R2 values were tested using a formula developed for dependent samples (Howell, 2007; Steiger, 1980). This test is distributed as t, with N – 3 degrees of freedom.
Results Prediction
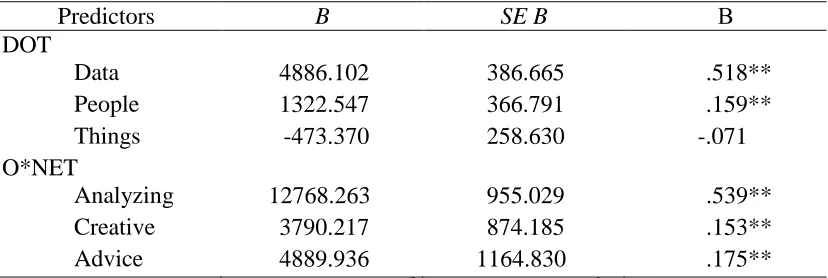
things job component had a negative, non-significant relationship with wages (p = .068). Next, I regressed wages onto the O*NET job components using the derivation sample. The analyzing, creative, and advice job components accounted for 58% of the variance in national median wages (Table 1). All three job components were significant predictors of wages; the analyzing job component had the strongest relationship with wages.
Weighting
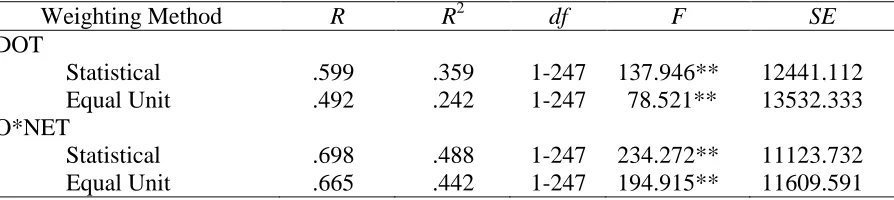
I used the cross-validation samples to determine whether weighting method moderated the relationship between job components and wages. The standardized beta weights obtained in the derivation sample regressions were applied as the statistical weights in the cross-validation samples. The DOT job components, using statistical weights,
accounted for 36% of the variance in wages (Table 2). For the equal unit weights, I summed across the three DOT job components and regressed wages onto the job component
composite score. Equal unit weighting accounted for 24% of the variance in wages (Table 2). The difference between the R2 values obtained using the statistical weights (.359) and the equal unit weights (.242) was significant, demonstrating that weighting method does
moderate the relationship between national median wages and DOT job components (t = 2.69, p < .01).
The O*NET job components, using the statistical weights obtained from the
national median wages (Table 2). Though there appeared to be little difference between the R2 values of the statistical and equal unit weights, this difference was statistically significant (t = 2.55, p < .05).
Discussion
Results from this study indicated job components from the DOT and O*NET (derivation samples) accounted for 39% and 58% of the variance in national median wages, respectively. As noted in Davis and Sauser (1993), many job evaluation studies “have consistently found R2 values for policy-capturing models in the range of .78 to .90” (p. 94). The large discrepancy between the findings from this study and previous job evaluation studies might be due to the nature of the data used. Many of those studies conducted a job analysis and formed job components based only on a select number of jobs, typically all within the same organization. These job components would be less aggregated than either the DOT or the O*NET. Also, the samples from these studies were typically small (i.e., less than 300). The sample used by Chi and colleagues (2007) consisted of over 1000 jobs from several different organizations and they were only able to predict 23.7% of monthly pay rate.
likely lost in national wage data. Rotundo and Sackett (2004) found occupational groups accounted for a substantial portion of the variance in wages; they were only able to account for 9% to 28% of wage variance above that explained by occupation, using skills/abilities as predictors.
Weighting method was demonstrated to moderate the relationship between job components and wages in both the DOT and the O*NET cross-validation samples (Table 2). These findings are consistent with those from Davis and Sauser (1991), in that the statistical weights accounted for a larger portion of the variance in wages. An interesting finding from this study is the differences in the moderator effects for the DOT and the O*NET job
components. The change in R2 for the DOT sample was noticeably larger than for the
O*NET sample (though both were statistically significant). Research suggests that equal unit weights can be used when there is a low to moderate correlation between predictors and criterion (Raju, Bilgic, Edwards, & Fleer, 1997). The three O*NET predictors were all highly correlated with wages; only two of the DOT predictors were highly correlated. The low, non-significant relationship between the things predictor and wages might have contributed to the larger change in R2 from statistical to equal unit weights. Furthermore, Davis and Sauser (1993) found little difference between weighting methods when the
One might have expected a smaller difference between the O*NET R2s and the DOT R2s, due to the O*NET being based on the DOT and both samples being aggregated job analysis data. There are two potential reasons for the large disparity. First, the O*NET data were linked to the national median wages by SOC code, thus it is not too surprising that there was a stronger relationship between the O*NET job components and wages. Second, the DOT data have not been updated since 1991; some industries and jobs likely have changed (or have been recently created) which would not be reflected in the DOT job components. If possible, future research could utilize wage data that are not linked to the O*NET or include data that are linked to the DOT, for comparison.
The DOT things job component was found to have a negative, non-significant
Limitations and Future Research
One clear limitation of the current study is the bias in the criterion. The O*NET OUs were linked to the national median wages by SOC code, with the DOT job titles reduced to match the O*NET. Furthermore, the DOT was last updated in 1991. The scope and structure of many jobs have changed over the past 20 years, likely resulting in a change in job components. These factors possibly contributed to the weaker relationship between the DOT job components and wages. Future research should use DOT level wage data to test whether there is, in fact, bias in favor of the O*NET.
The negative, non-significant relationship between the things job component and wages was also a limitation. Rotundo and Sackett (2004) correlated the DOT job
components with wages and found a positive correlation between the things job component and wages. However, they used “annual average median weekly wage for 1979 converted to an hourly wage based on a 35-hour work week” (p. 139). The specificity of the wage data and its closer link to the DOT might explain the difference between their study and this study. This could be an argument against the things job component being nominal. The relationship found in this study may be an artifact of the wage data used. Researchers may still want to consider recoding or reclassifying the things job component to see how this might change the relationship with wages.
Davis & Sauser, 1993; Robinson, Wahlstrom, & Mecham, 1974; Rotundo & Sackett, 2004). Some studies also included other factors in addition to the job components, such as education or tenure. Future research should explore the addition of other sources of job components from the O*NET and DOT, like skills or aptitudes, respectively.
Researchers might also consider reexamining a policy capturing or job evaluation study, substituting in either DOT or O*NET job components and comparing the results to those originally obtained in the study. This would help in understanding whether the level of aggregation in the DOT and O*NET is too high. Similarly, it would be interesting to know if the job components from those policy capturing and job evaluation studies would account for the same amount of variance in national wages as they did for specific wage data used in the studies.
Conclusion
This paper explored the use of two national job analysis databases, the DOT and the O*NET, in a job evaluation study using a policy capturing approach to predict national wage data. Although the job components explained less than 60% of the variance in wages, there is some argument for using information from these job analysis databases in wage setting. Smaller companies that cannot afford the services of job evaluation firms could apply the information from such databases to set or adjust wages as needed. However, caution must be used as reliance on only job components from these sources may not be enough.
References
Aiman-Smith, L., Scullen, S. E., & Barr, S. H. (2002). Conducting studies of decision making in organizational contexts: A tutorial for policy-capturing and other regression-based techniques. Organizational Research Methods, 5, 388-414. doi: 10.1177/109442802237117
Alterman, T., Grosch, J., Chen, X., Chrislip, D., Petersen, M., Krieg, E., et al. (2008).
Examining associations between job characteristics and health: Linking data from the occupational information network (O*NET) to two US national health surveys.
Journal of Occupational and Environmental Medicine, 50, 1401-1413. doi:
10.1097/JOM.0b013e318188e882
Arnault, E. J., Gordon, L., Joines, D. H., & Phillips, G. H. (2001). An experimental study of job evaluation and comparable worth. Industrial & Labor Relations Review, 54(4), 806-815. doi: 10.2307/2696113
Balma, M. J. (1959). The development of processes for indirect or synthetic validity: 1. The concept of synthetic validity. A symposium. Personnel Psychology, 12, 395-396. Chi, C. F., Chang, T. C., Hsia, P. L., & Song, J. C. (2007). Job compensable factors and
factor weights derived from job analysis data. Perceptual and Motor Skills, 104, 1193-1204. doi: 10.2466/pms.104.4.1193-1204
Davis, K. R., & Sauser, W. I. (1991). Effects of alternative weighting methods in a policy-capturing approach to job evaluation: A review and empirical investigation.
Davis, K. R., & Sauser, W. I. (1993). A comparison of factor weighting methods in job evaluation: Implications for compensation systems. Public Personnel Management, 22, 91-106.
Fine, S. A., Harvey, R. J., & Cronshaw, S. F. (2004, April). FJA strategies for addressing
O*NET limitations in a post-DOT environment. In Fleishman, E. A. (chair), Things,
Data, and People: Fifty years of a seminal theory. Symposium presented at the
Annual Conference of the Society for Industrial and Organizational Psychology, Chicago.
Forstmeier, S., & Maercker, A. (2008). Motivational reserve: Lifetime motivational abilities contribute to cognitive and emotional health in old age. Psychology and Aging, 23, 886-899. doi: 10.1037/a0013602
Geyer, P. D., Hice, J., Hawk, J., Boese, R., & Brannon, Y. (1989). Reliabilities of ratings available from the dictionary of occupational titles. Personnel Psychology, 42, 547-560. doi: 10.1111/j.1744-6570.1989.tb00668.x
Howell, D. C. (2007). Statistical methods for psychology. Belmont, CA: Thomson Wadsworth.
Johnson, J. W. (2007). Synthetic validity: A technique of use (finally). In S. M. McPhail (Ed.), Alternative validation strategies: Developing new and leveraging exisiting
validity evidence (pp. 122-158). San Francisco: Jossey-Bass.
Karren, R. J., & Barringer, M. W. (2002). A review and analysis of the policy-capturing methodology in organizational research: Guidelines for research and practice.
Organizational Research Methods, 5, 337-361. doi: 10.1177/109442802237115
Lapolice, C. C., Carter, G. W., & Johnson, J. W. (2008). Linking O*NET descriptors to occupational literacy requirements using job component validation. Personnel
Psychology, 61, 405-441. doi: 10.1111/j.1744-6570.2008.00118.x
Lawshe, C. H. (1952). Employee selection. Personnel Psychology, 6, 31-34. doi: 10.1111/j.1744-6570.1952.tb00990.x
Maxwell, N. L. (2008). Wage differentials, skills, and institutions in low-skill jobs. Industrial
& Labor Relations Review, 61, 394-409.
McCormick, E. J. (1959). The development of processes for indirect or synthetic validity: III. Application of job analysis to indirect validity. A symposium. Personnel
Psychology, 12, 402-413. doi: 10.1111/j.1744-6570.1959.tb01331.x
McCormick, E. J., DeNisi, A. S., & Shaw, J. B. (1979). Use of the position analysis
questionnaire for establishing the job component validity of tests. Journal of Applied
Psychology, 64, 51-56. doi: 10.1037//0021-9010.64.1.51
http://www.xwalkcenter.org/index.php?option=com_content &view=article&id=101:onet-140&catid=31
National Crosswalk Service Center. (2000b). ONET-DOT crosswalk (2009) [data file]. Retreived from
http://www.xwalkcenter.org/index.php?option=com_content&view=article&id=96: onet-supplemental-files&catid=31
Peterson, N. G., Mumford, M. D., Borman, W. C., Jeanneret, P. R., Fleishman, E. A., Levin, K. Y., et al. (2001). Understanding work using the occupational information network (O*NET): Implications for practice and research. Personnel Psychology, 54, 451-492. doi: 10.1111/j.1744-6570.2001.tb00100.x
Poletaev, M., & Robinson, C. (2008). Human capital specificity: evidence from the
dictionary of occupational titles and displaced worker surveys, 1984–2000. Journal of
Labor Economics, 26, 387-420. doi: 10.1086/588180
Raju, N. S., Bilgic, R., Edwards, J. E., & Fleer, P. F. (1997). Methodology review:
Estimation of population validity and cross-validity, and the use of equal weights in prediction. Applied Psychological Measurement, 21, 291-305. doi:
10.1177/01466216970214001
Robinson, D. D., Wahlstrom, O. W., & Mecham, R. C. (1974). Comparison of job evaluation methods: A “policy-capturing” approach using the position analysis questionniare.
Rotundo, M., & Sackett, P. R. (2004). Specific versus general skills and abilities: A job level examination of relationships with wage. Journal of Occupational and Organizational
Psychology, 77, 127-148. doi: 10.1348/096317904774202108
Scherbaum, C. A. (2005). Synthetic validity: Past, present, and future. Personnel Psychology, 58, 481-515. doi: 10.1111/j.1744-6570.2005.00547.x
Steel, P., & Kammeyer-Mueller, J. (2009). Using a meta-analytic perspective to enhance job component validation. Personnel Psychology, 62, 533-552. doi: 10.1111/j.1744-6570.2009.01147.x
Steiger, J. H. (1980). Tests for comparing elements of a correlation matrix. Psychological
Bulletin, 82(2), 245-251. doi: 10.1037//0033-2909.87.2.245
U.S. Department of Labor. (1991). Dictionary of occupational titles (4th ed.). Retreived from http://www.oalj.dol.gov/libdot.htm
U.S. Bureau of Labor Statistics. (1995a). Occupational employement statistics survey (May 2008)[data file]. Retrieved from http://www.bls.gov/oes/oes_dl.htm
U.S. Bureau of Labor Statistics. (1995b). Standard occupational classification. Retrieved from http://www.bls.gov/soc/
Van Sliedregt, T., Voskuijl, O. F., & Thierry, H. (2001). Job evaluation systems and pay grade structures: do they match? International Journal of Human Resource
Footnotes
Table 1
Statistical Weights for O*NET and DOT Predictors
Predictors B SE B Β
DOT
Data 4886.102 386.665 .518**
People 1322.547 366.791 .159**
Things -473.370 258.630 -.071
O*NET
Analyzing 12768.263 955.029 .539**
Creative 3790.217 874.185 .153**
Advice 4889.936 1164.830 .175**
Table 2
Regression of Wages on Job Components Using Two Weighting Methods
Weighting Method R R2 df F SE
DOT
Statistical .599 .359 1-247 137.946** 12441.112
Equal Unit .492 .242 1-247 78.521** 13532.333
O*NET
Statistical .698 .488 1-247 234.272** 11123.732
Equal Unit .665 .442 1-247 194.915** 11609.591
Table 3
Categories from the DOT's Things Job Component
Things Setting up
Precision working Operating-controlling Driving-operating Manipulating Tending
Feeding-offbearing Handling
Figure 1. Conceptual model of important variables in policy capturing of national wage data. DOT
Job Components O*NET Job Components
Job Component Weighting
Appendix A
Stepwise regression of O*NET job components
Model R R2
1 .731a .535
2 .752b .566
3 .762c .581
4 .771d .594
5 .781e .610
6 .788f .620
7 .790g .624
8 .793h .629
9 .796i .633
10 .797j .636
Note. The job components analyzing, creative, and advice are V9, V11, and V38, respectively.