Selection, Load and Inbreeding Depression in a Large Metapopulation
Michael C. Whitlock
1Department of Zoology, University of British Columbia, Vancouver, British Columbia V6T 1Z4, Canada
Manuscript received May 31, 2001 Accepted for publication November 27, 2001
ABSTRACT
The subdivision of a species into local populations causes its response to selection to change, even if selection is uniform across space. Population structure increases the frequency of homozygotes and therefore makes selection on homozygous effects more effective. However, population subdivision can increase the probability of competition among relatives, which may reduce the efficacy of selection. As a result, the response to selection can be either increased or decreased in a subdivided population relative to an undivided one, depending on the dominance coefficientFSTand whether selection is hard or soft. Realistic levels of population structure tend to reduce the mean frequency of deleterious alleles. The mutation load tends to be decreased in a subdivided population for recessive alleles, as does the expected inbreeding depression. The magnitude of the effects of population subdivision tends to be greatest in species with hard selection rather than soft selection. Population structure can play an important role in determining the mean fitness of populations at equilibrium between mutation and selection.
T
HE subdivision of species into local populations has Sabran1992;Pollak 1995), but population structure introduces new complications. In particular, if alleles been much studied, typically from the point of viewof the differentiation of neutral allele frequencies or are clustered in space and if the absolute success of the adaptation of these demes to locally divergent condi- individuals depends on some locally limited resource, tions (Felsenstein1976;Hedricket al.1976;Hedrick then the success of one individual will disproportion-1986;Barton2001). Yet most loci must be under some ately affect the reproductive success of other individuals selection, and arguably most selection must be largely carrying similar alleles. Another way of saying this is that independent of local conditions, because deleterious, the genetic variance within a population tends to be loss-of-function mutations at most loci are likely to de- reduced by local drift, such that the response to selec-crease fitness over a broad range of circumstances. For tion is lowered. Thus with population structure, the these classes of uniformly selected mutations, however, response to selection may be increased by the greater we have little population genetic theory appropriate for expression of homozygotes but decreased by the effects subdivided populations. of local drift and local competition.Bartonand Whit-The subdivision of a species into spatially isolated pop- lock(1997) briefly discussed the effects of population ulations affects the outcome of selection in several ways. subdivision with soft selection on a locus with additive Population structure engenders nonrandom mating, effects and found that the effects of population structure because organisms are more likely to mate with nearby were relatively minor in this case. Here this model is individuals than those far away. This results in an excess extended to include arbitrary dominance and a broader of homozygotes relative to that expected under random range of population structures and modes of selection. mating. If an uncommon allele is less than completely Simple expressions for the response to selection, muta-dominant to a common allele, then this excess of homo- tion load, and the inbreeding depression in structured zygotes will allow a greater response to selection at this populations are found. Population structure can have locus. More generally, with any deviation from additive a large effect on these important quantities.
gene action, the marginal effects of alleles will change as a function of their likelihood of expression as
homo-zygotes. The effects of inbreeding within a population CHANGE IN ALLELE FREQUENCY BY SELECTION on the response to selection have been extensively
stud-Definitions and moments of the gene frequency distri-ied (Wright1942;OhtaandCockerham1974;Lande
bution among populations:Consider the case of a locus and Schemske 1985; Charlesworth and
Charles-with two alleles, one fit and one somewhat deleterious. worth1987;CaballeroandHill1992;Pollakand
The frequencies of these alleles within demeiare given by pi and qi, respectively. For diploid individuals, the
relative fitnesses of the three possible genotypes are
1Address for correspondence:Department of Zoology, University of
Brit-given by 1, 1⫹hs, and 1⫹s, respectively. Assume for ish Columbia, 6270 University Blvd., Vancouver, BC V6T 1Z4, Canada.
E-mail: [email protected] now that there is random mating within each deme such
that the genotypes are present in local Hardy-Weinberg w⫽ 1⫹ sq(2h⫹ (1⫺2h)(FSTp⫹q)). (4) proportions. In this case, the local mean relative fitness
We also need the expected value ofq3, is given bywi⫽ 1⫹2hspiqi⫹ sq2i.
The overall change in the allele frequency of the E[q3]⫽q3(1 ⫺3F
ST⫹ 2␥)⫹ q2(3FST⫺3␥)⫹q␥,
metapopulation depends on the relationship between (5)
the mean fitness of a local population and its
contribu-where ␥ is a standardized measure of the skewness of tion to the next generation. Two extreme possibilities
allele frequencies among populations. This␥is approxi-are typically considered: soft and hard selection (
Wal-mately equal to the probability that three alleles chosen lace1968). With soft selection, each deme contributes
at random from the same deme are identical by descent. to the next generation independently of its mean
rela-As such it is approximately equal to the three-allele tive fitness, whereas with hard selection, its contribution
descent measure␥ofCockerham(1971; see also Whit-is proportional to its mean relative fitness. It Whit-is possible
locket al.1993). In general, we do not have theory to to scale between these two extremes; we can scale the
determine the value of␥for a wide range of theoretical relationship between the genetic makeup of a deme
models (seeTachidaandCockerham1987 and Whit-and its contribution to the next generation by a linear
lock et al. 1993 for some examples). For the neutral function with slopeb. DefineNi as the size of demei,
island model, however, it is easy to determine from
Ntot⫽ RNi, andw⫽ RwiNi/Ntotas the mean fitness of all
Wright’s distribution that ␥ ⫽2FST/(12 ⫹FST). In gen-demes. Ifi ⫽Ni/Ntotand⬘i are the proportions of all
eral, the deviation of ␥from the neutral island model individuals in the current and following generations,
expectation will often be small. (See theappendix.) We respectively, contributed by demei, we can write
can use this deviation to define a new identity disequilib-rium coefficient that will have useful properties, ⬅ ⬘i ⫽Cii
冢
1⫺b冢
1⫺wi
w冣冣, (1)
2F2ST/(1⫹FST)⫺ ␥. Therefore we can writeE[q3] as
whereCiis genotype independent and reflects differences E[q3]⬵(q3(1 ⫺FST)2 ⫹q2(3FST(1 ⫺FST))
in the success of demes due to effects extrinsic to this
⫹2q F2ST)/(1⫹ FST)⫹ q p(q⫺p). locus, such as variation in the quality of the local
envi-(6) ronment or selection at other loci. Throughout this
article, we assume thatCis not correlated withwor, Hard selection:With hard selection, demes are repre-which means that the expected value of ⬘i is wi(1⫺ sented in the next generation in proportion to their
b(1 ⫺wi/ w)) for all i. For simplicity of presentation, average fitness. If we assume, as we do for the rest of
then, all subsequent equations of global change in allele this article, that the nongenetic determinants of the frequency are given as expectations over the distribution contribution of a deme (
Ci) are not correlated with
of C, without explicit subsequent statement of this
as-allele frequency, then the expected change due to selec-sumption.
tion in the overall allele frequency is given by Note that⬘i is defined as the contribution of deme
i in this generation to the total number of individuals
⌬sq⫽
E[q(q(1 ⫹s)⫹(1⫺q)(1⫹hs))]
w ⫺ q
in the next generation. These individuals could still be in ior in any other deme. If b⫽ 0, then we have soft
⬵ s(qh⫹E[q2](1⫺ h))⫹q(1⫺ w), (7) selection, and all demes contribute to the next
genera-tion independently of their genetic fitness. In contrast, where the approximation holds forsⰆ1. Using
Equa-b⫽1 corresponds to hard selection, and the contribu- tions 2 and 3 and assuming that F
STdoes not change tion of each deme is in proportion to its mean fitness. on average withp, we can find
The mean relative fitness of all individuals in the
population can be calculated as ⌬sqhard⬵p q shard, (8)
w⫽
兺
i
i wi⫽ 1⫹ s(2hq⫹(1 ⫺2h)E[q2]), (2) wherehard⫽ FST⫹(1⫺FST)(h(1⫺ 2q)⫹ q). Hard se-lection is always more effective in a structured popula-whereqis the mean across demes ofqand the expecta- tion than in an undivided population because of the tions are taken weighted by (e.g.,q⫽Riqi, etc.). If increased expression of homozygotes, as long ash⬍1.
we define FST⫽V[q]/ p q, where V[q] is the variance With pure hard selection, however, there is no effect of among demes in allele frequencies, weighted by, we local competition among relatives; thus the response to can find the mean value ofq2across demes: selection is not discounted by relatedness.
Pure hard selection corresponds exactly to the case of
E[q2]⫽V[q]⫹ q2⫽q(F
ST⫹(1⫺ FST)q). (3)
inbreeding within an undivided population, as treated previously (Caballero et al. 1991), with FST used in Note that this definition ofFSTas weighted by population
place of the inbreeding coefficient in these equations. size can differ from that often calculated by some
one generation within a population as a result of soft tion ofFST is sufficient to describe the FST of selected loci, then it must also be true that|Nis|⬍1. However,
selection as
for the deterministic equations given in this article to suffice, it must be the case that the allele is not nearly ⌬sqi ⫽qi
pi(1⫹ hs)⫹qi(1⫹ s)
wi
⫺ qi. (9)
neutral at the species level;i.e., |Ntot s|⬎ 1. Together these assumptions will require that the number of demes IfsⰆ1, then Equation 9 is well approximated by
in the species is not small. It is likely that the violation ⌬sqi⬵qi(1 ⫺qi)s(h⫹ qi(1⫺2h)). (10) of the weak selection assumption will not cause a
qualita-tive change in the conclusions below, but certainly there Thus the expected value of the change in allele
fre-will be quantitative deviations from the predictions as quency over all demes is
selection gets strong.
E[⌬sq]⬵ s(qh⫹ E[q2](1⫺3h)⫺E[q3](1⫺ 2h)). Perhaps most importantly, it has been assumed that
(11) the strength of selection is equal everywhere. Clearly,
there is an important class of mutations that will vary Using the expected values ofq2andq3from Equations
not only in the magnitude but also in the direction of 3 and 6 above, we can find
selection in different subpopulations. This variability in ⌬sqsoft⫽E[⌬sq]⬵p qssoft, (12) what is locally adaptive will clearly change the
expecta-tions of mutation load and inbreeding depression from where
those derived later in this article. Relaxing these assump-tions represents a major challenge for future work. soft⫽ (1⫺FST)
(1⫹FST)(FST⫹(1 ⫺FST)(h(1 ⫺2q)⫹ q)) ⫹ (1⫺ 2h)(1⫺2q).
MUTATION-SELECTION BALANCE
Whenis small, softis therefore approximately equal
to (1⫺r)hard, whereris the relatedness of individuals Now let us focus on deleterious mutations, such that within a deme [r⬅2FST/(1⫹FST)]. With soft selection, s⬍0. With weak mutation, the change in average delete-the efficacy of selection is reduced by competition rious allele frequency from one generation to another among close relatives [reflected in the (1⫺ r) term]. is given by
Nevertheless, selection is also made more efficient for
⌬q⬵ p⫹ ⌬sq, (16)
many values of h by increased expression of homozy-gotes. For rare recessive alleles, selection is more
effec-whereis the mutation rate from the fit to less fit allele tive in subdivided populations than in unstructured
(see Barton and Whitlock 1997). Thus at equilib-ones, even with soft selection.
rium, when the effects of mutation and selection are Generalizing the hard-soft dichotomy: The overall
balanced, the frequency of the deleterious allele is on change in allele frequency is
average approximately ⌬sq⫽
兺
(q⬘i⬘ ⫺ qii)⫽兺
(⌬sqii⫹q⬘⌬i),(13)
qˆ⬵ (1 ⫹FST)
⫺s(1⫺(1 ⫺2b)FST)(FST⫹ (1⫺FST)h)
(17) where⌬ ⫽ ⬘ ⫺ is the change in the contribution
of the deme to the next generation, which arises as a (assuming thats2,2, andqˆ2are all small). Thus for hard result of selection at this locus. Using Equation 1, we selection the equilibrium allele frequency is/(⫺s(F
ST⫹ can then write (1⫺FST)h), and for soft selection it is (1⫺r) times that.
The frequency of a deleterious allele at equilibrium ⌬sq⫽(1⫺ b)⌬sqsoft⫹b⌬sqhard (14)
is likely to be much smaller in a subdivided population
or than in a panmictic population (see Figure 1). Selection
is more effective in subdivided populations (i.e., qˆ is ⌬sq⬵p qs((1⫺ b)soft⫹ bhard)⬅p qs. (15)
lower) if For rare alleles such thatqis small relative to eitherh
or FST and negligible identity disequilibrium, this last
h⬍ 1⫺FST(1 ⫺2b)
3⫺2b⫺ FST(1 ⫺2b). (18) term is approximately
⬵(1 ⫺FST⫹2b FST)[FST⫹ (1⫺FST)h]/(1⫹FST). With soft selection and low values ofF
ST, this condition isⵑh⬍1⁄
3. With hard selection, for all values ofFST(18) Limitations:These approximations have made a few
reduces to h ⬍ 1. Thus the frequency of deleterious assumptions, and their easy use requires a few more
mutations in a structured population is lower than for assumptions. Relatively standard assumptions have been
the same selection parameters in an undivided popula-made about the strength of selection, in particular that
Figure 1.—The equilibrium value of the frequency of a Figure2.—The mutation load in a metapopulation relative deleterious allele can be substantially changed by population to the load at a similar locus in an undivided population structure. Here the solid lines indicate pure soft selection, the (ⵑ2). For the values ofFSTlikely to be found within species dashed lines pure hard selection. With very recessive alleles, and relatively small values of the dominance coefficienth, the the equilibrium allele frequency is greatly reduced, relative mutation load can be substantially reduced in a subdivided to the case in an undivided population (whereqˆ⬵⫺/hs). population. The solid lines show pure soft selection, while the Parameter values used for these calculations weres⫽ ⫺0.1, dashed lines correspond to pure hard selection. Parameters ⫽10⫺6, and the three lines correspond toh⫽0.4, 0.1, and
for this example ares⫽ ⫺0.1, ⫽10⫺6, and the three pairs
0.01 from top to bottom. of curves correspond to h⫽0.4, 0.1, and 0.01 from top to
bottom.
MUTATION LOAD
selection the load is increased by proportion 1/(1 ⫺ The previous section has shown that under many cir- FST) with population structure.
cumstances, the frequency of deleterious alleles in sub- Note that, as in most discussions of load, this defini-divided populations is expected to be lower than in an tion of load does not predict the decline in the mean undivided population. If alleles were taken at random number of offspring per individual actually observed in from a subdivided species and crossed, the load calcu- a population, because under soft selection the mean lated would likely be much smaller than that in an undi- number of offspring is assumed to be constant per vided population. It is more biologically relevant, how- deme, and even under hard selection the mean produc-ever, to calculate the load in the context of the breeding tivity is constant for the species. These calculations system of the species, accounting for the nonrandom would give the mean deficit of the relative fecundity of mating associated with population structure. In princi- individuals from this species in competition with an ple, the load can be increased in a subdivided popula- individual without deleterious alleles or a hypothetical tion even ifqˆis lower, because of the increased expres- sister species.
sion of homozygotes. The load (L⬅1⫺w) associated Also note that these calculations are derived from the with a locus can be calculated using Equations 2 and equilibrium values in an infinitely large metapopula-17, assuming thatqˆ,s, andare all small, as tion. With finite metapopulations, there is a chance that deleterious alleles will fix in the population (and
L⬵ (1⫹ FST)(2h(1⫺FST)⫹FST)
(1 ⫺(1⫺ 2b)FST)(h(1⫺FST)⫹FST) therefore contribute to drift load) or that deleteriousalleles are lost. The mutation load due to segregating
alleles in species with a relatively small number of indi-⫽ ⫺(2h(1 ⫺FST)⫹ FST)sqˆ
viduals is likely to be different from the values given here.
⫽
(2h(1⫺ FST)⫹FST), (19)
which reduces to L ⫽ 2 as expected when FST ⫽ 0. INBREEDING DEPRESSION The extent of the change in load can be dramatic,
partic-Forh⬍1⁄
2ands⬍0, inbred individuals are likely to ularly with small values of h (see Figure 2). For hard
be less fit than relatively outbred individuals. This is selection, this reduces to the same result found (albeit
because inbred individuals are more likely to express with less approximation) byCrowandKimura(1970)
deleterious alleles as homozygotes than are outbreds. for inbreeding.
If organisms randomly chosen from a population are Similar derivations as above find the load for a haploid
inbred such that their relative inbreeding coefficient isf, population to be
then their total inbreeding coefficient will beFTOT⬅1⫺ ((1 ⫺ FST)(1 ⫺ f)). The mean fitness of these inbred
Lhaploid⬵
1⫺(1⫺ b)FST
. (20) individuals is
winbred⫽(1⫺FTOT)(1⫹2p qhs⫹q2s)⫹FTOT(1⫹sq). The haploid load thus is not changed by population
The inbreeding depression,␦, can be defined in several different ways, depending on the nature of the experi-ment (seeJohnstonandSchoen1994). One definition of inbreeding depression compares the reduction in fitness of experimentally inbred individuals relative to the average fitness of individuals mated randomly from individuals from the same deme; this definition would be appropriate for experiments that took samples from a single deme only. Let us call this␦1:
␦1⬅1⫺E
冤
winbred woutbred,within冥
. (22)
A second possible definition is that we might compare the average fitness of inbred individuals to the mean fitness of individuals outbred across all possible demes. In this case, the inbreeding depression (call it␦2) would be given by
␦2⬅ 1⫺ winbred
woutbred
, (23)
wherewoutbredis the fitness of the experimentally outbred individuals.
With these simple definitions and using the approxi-mation forqˆin (17), the approximate value of␦1 can be found. To approximate the value of an expectation of a ratio, we can use the formula derived in Lynch and Walsh (1998, Appendix 1), which requires the variance of the denominator and the covariance of the numerator and denominator. These covariance terms require the expectation ofq4, which is unknown in most cases but can be found as above for the neutral island
model from Wright’s distribution (details not shown). Figure3.—The inbreeding depression expected in a subdi-After some algebra, the mean inbreeding depression vided population, expressed as a ratio of the inbreeding de-pression expected in an undivided species with the same
ge-can be found to be approximately
netic parameters. (A) The inbreeding depression, measuring
␦1⬵⫺s f(1⫺ FST)(1⫺ 2h)qˆ (24) the fitness of inbred individuals relative to other members of the same local populations (␦1), can be much reduced by (assumingsⰆ1). Putting in the value ofqˆfrom above, population structure if h is small. As in other figures, the parameters used to calculate these graphs weres⫽ ⫺0.1, ⫽
the inbreeding depression for a given f is therefore
10⫺6, and the three pairs of curves correspond toh⫽0.4, 0.1, changed in subdivided populations relative to undivided
and 0.01 from top to bottom. The solid lines show pure soft
populations such that
selection, while the dashed lines correspond to pure hard selection. (B) When inbred individuals are compared to
indi-␦structured⬵ (1⫺F2ST)h
(1⫺(1⫺2b)FST)(FST⫹(1⫺FST)h)
␦unstructured. viduals that are experimentally outbred to randomly chosen members of the whole metapopulation, the inbreeding
de-(25) pression (␦
2) can be much reduced by population structure
or much increased, depending onFSTand h.(C) Since the
The inbreeding depression due to a locus is thus lower distribution ofhis largely unknown, a first guess of the overall in structured populations than undivided populations if effect of population structure is made by assuming thathis
uniformly distributed between 0 and 0.5. The relative inbreed-ing depression (␦1) can still be substantially reduced by
popula-h ⬍(1⫺(1 ⫺2b)FST)
2(1⫺b)(1⫺ FST)
, (26)
tion structure.
which for biologically relevant values ofFSTis true for all
h(h⬍1⁄2) that give inbreeding depression. See Figure 3A.
q2s. At mutation-selection balance, the inbreeding de-When inbreeding depression is calculated using the
pression defined in this way is then approximately mean fitness of experimentally inbred individuals
rela-tive to the mean fitness of individuals experimentally
␦2⬵ (1⫹ FST)FTOT(1⫺2h)
(1⫺ (1⫺2b)FST)(FST⫹(1⫺ FST)h) . (27) outcrossed randomly across the metapopulation, the
mean fitness of inbred individuals is as above, and the
⌬sqhard⫽p q s˜hard, (30) wheres˜hard⫽s(p⫹FSTq)⫺t(FSTp⫹q). With soft selec-tion,
⌬sqsoft⫽E[⌬sq]⬵ p q s˜soft, (31)
where s˜soft⫽ (1⫺r)s˜hard⫹(q⫺p)(s⫹t) and the ap-proximation holds for s, t Ⰶ 1, as above. Again, hard selection leads to larger average changes per generation in allele frequencies than does soft selection. To combine the soft-hard dichotomy,⌬sq⫽pq((1⫺b)s˜soft⫹bs˜hard).
Solving for an equilibrium and assuming small, we
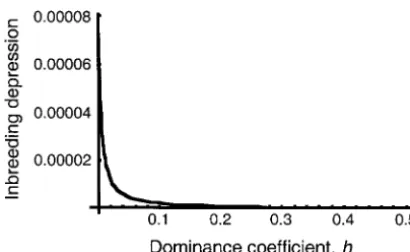
Figure 4.—The expected inbreeding depression due to can find the mean allele frequency
a locus at mutation-selection balance, as a function of the
dominance coefficienth.These values are calculated for an qˆ⬵ s⫺t FST
(s⫹t)(1⫺FST), (32)
undivided population, withs⫽ ⫺0.1 and ⫽10⫺6. Inbreeding
depression is dramatically larger for values ofhapproaching
zero. except in cases when this quantity is⬍0 or⬎1, in which
case the equilibrium is at 0 or 1, respectively. This condi-tion implies that intermediate equilibria that are stable in structured populations only for small values ofh.See
with random mating do not exist with population struc-Figure 3B. This is important though, because loci with
ture. This parallels results for inbreeding within popula-small values ofhare responsible for a disproportionate
tions, where fewer overdominant polymorphisms are fraction of inbreeding depression. Inbreeding
depres-stable (WorkmanandJain1966). The equilibrium al-sion is expected to be trivial for values ofh near1⁄
2, so lele frequency turns out to be independent of bifis most inbreeding depression due to recessive alleles is
small; therefore it is indifferent to hard or soft selection. likely due to the subset of mutations that have small
Calculating the segregation load,L⫽ 1⫺ w, gives values ofh (see Figure 4). It is exactly in this range in
which population structure has the strongest effect (see
L⫽(1⫹ FST)st
s⫹t , (33)
Figure 3, A and B). If, as a starting guess, new mutations had a uniform distribution ofhbetween 0 and1⁄2, then
which reduces to the segregation load in a panmictic the reduction in inbreeding depression due to
popula-population whenFST⫽0 (Crow1958). Therefore the tion structure can be dramatic (Figure 3C).
segregation load is (1⫹FST) times as great in a subdi-vided population as in an undisubdi-vided one, as expected
OVERDOMINANCE by the increased number of homozygotes.
The inbreeding depression expected due to a locus With overdominance, heterozygotes are the most fit
with overdominant selection in a structured population genotypes; therefore overdominance is another
poten-can be calculated as above assuming,s,tⰆ 1, giving tial cause of inbreeding depression. Similar equations
for␦1and␦2, respectively, to those above can be derived to predict the evolution
of overdominant loci in structured populations. With ␦1⫽f pˆ qˆ(1⫺ FST)(s⫹t) (34) the fitness of each of the three genotypes defined as 1⫺
and
s:1:1⫺t, the mean fitness of a deme with allele
frequen-ciespandq⫽ 1⫺p isw⫽1⫺(sp2⫹tq2). Similarly, ␦2⫽
FTOTpˆ qˆ(s⫹t). (35) the expected overall mean fitness is given by w⫽1⫺
Therefore the inbreeding depression in subdivided pop-(s E[p2]⫹t E[q2]). The expected change inqwithin a
ulations due to overdominance is expected to be deme, assuming that mutation is weak relative to
selec-tion, is given by
␦subdivided⫽(s⫺t FST)(t⫺s FST)
(1⫺FST)st ␦undivided, (36)
⌬sq⬅ q⬘ ⫺ q⫽q
p⫹q(1⫺ t)
w ⫺q. (28) for inbreeding depression measure 1 or approximately (1 ⫺ FST) as large as in an undivided population for Taking the expectation of (28) assumings, tⰆ 1 and
values ofs⬇t.The equivalent ratio for␦2is the same, using Equations 3 and 5, we get the change in allele
multiplied times FTOT/f. Thus, for either of the most frequency per generation with hard selection,
likely causes of inbreeding depression, overdominance or segregating deleterious recessive alleles, the inbreed-⌬sq⫽
E[q(1⫹ tq)]
w ⫺ q ing depression is expected to be somewhat lower in a subdivided population than in an undivided population
⬵t E[q2]⫹q(1⫺w). (29)
much more reduced than that due to overdominance. The exception to this prediction is if there are many overdominant loci with very asymmetric homozygote fitnesses (s⬆ t), such that the internal equilibrium is lost with nonrandom mating and inbreeding depression due to the locus goes to zero.
FINDING THEFSTOF SELECTED LOCI
The preceding calculations are useful only if we know
the value of FST for selected loci. In general this is a Figure5.—The relationship betweenFSTand selection in an
island model. With Wright’s distribution,FSTcan be calculated
difficult task, but for weak purifying selection theFSTof
directly. The top curve on this graph is the value ofFSTas a
loci that are under uniform selection may be closely
function of migration rate for a neutral locus. Overlapping
approximated by theFSTof a neutral locus under the this line is a graph of theFSTof a locus with two alleles, one same population structure. This can be quantified under of which is selected against withs⫽ ⫺0.001. In descending Wright’s island model, using Wright’s distribution of allele order, the other two lines haves⫽ ⫺0.01 and⫺0.1, respec-tively. In all cases, N ⫽ 1000 and h ⫽ 0.1 with a forward
frequencies among populations (Wright 1937a,b).
As-mutation rate of 10⫺5and backward mutation of 10⫺7. The suming mutation to be weak relative to migration, we can
neutralFSTpredicts theFSTof selected loci quite well as long
findE[q2] as
as⫺Nsⱕ 1 or ⫺s⬍ m. Note that in the regions with the worst fit, the neutralFSTis unreasonably large for conspecific
E[q2]⫽
冮
10
Cq2q4Nmq⫺1(1⫺q)4Nm(1⫺q)⫺1W2N, (37)
populations.
whereCis a constant of integration. If we assume that
With local inbreeding, each local population is not
S⬅⫺4NsⰆ 1 (remembering that thisNrefers to the
in Hardy-Weinberg proportions. The mean local fitness size of a local deme, not the species as a whole), then
is then (37) can be solved analytically. CalculatingFSTand
as-suming thatqis small, we then get wi⫽ 1⫹ s[(1⫺FIS)(2piqih⫹ q2
i)⫹FISqi]. (40)
FST⬵ FST,neutral(1⫺ ), (38) Then the change in allele frequency among descen-dants of demeiis given by
whereFST,neutral⫽1/(1⫹4Nm) and
⌬qi⫽
qi(FIS(1⫹s)⫹(1⫺FIS)(qi(1⫹s)⫹pi(1⫹hs)))
wi
⫺qi. ⫽S 3⫹8hNm
(2 ⫹4Nm)(3⫹4Nm). (39) (41)
Thus for the assumed parameter rangeSⰆ 1, the dis- Using the same formulas for the moments of the allele crepancy between neutral and selected loci forFSTwill frequency distribution as above, we can get the expected be negligible in the island model. The magnitude of change in mean allele frequency over the whole system, this discrepancy can be seen in Figure 5 for a variety of
⌬q⫽p q s
冢
bh⬘ ⫹(1⫺b)冢
1⫺FST1⫹FST(h⬘ ⫹FISFST) examples. Numerical calculations show that even when
S⬎1, the neutralFSTwell predicts the FSTfor selected
loci if|s|⬍m(Figure 5). ⫹ (1⫺2h)(1⫺2q)(1⫺FIS)
冣冣
,Similar calculations with overdominance show that
(42) if Ns, Nt Ⰶ 1, then FST of selected loci will be closely
approximated by a neutral FST if s, t ⬍ m. Here the where assumption of uniform selection has been quite
impor-h⬘ ⫽FIT ⫹(1⫺ FIT)(h ⫹q⫺ 2hq), tant. With balancing selection, locally variable selection,
or frequency-dependent selection, or even relatively and weak selection may potentially causeFSTto deviate from
FIT⫽ 1⫺ (1⫺FST)(1⫺FIS), its neutral expectation.
as defined by Wright. Keep in mind that the addition of local inbreeding is likely to decrease the local effective
LOCAL INBREEDING
population size and therefore increase the equilibrium value ofFST, so theFSTvalue in (42) is not constant with So far, we have assumed that each local population
mates at random. When this restriction is lifted, the changingFIS, all else being equal.
These equations match those fromCaballeroet al.
alleles within an individual can be correlated relative to
other alleles in the deme, which is reflected in Wright’s (1991) andOhtaandCockerham(1974) for the case of local inbreeding within an undivided population. local inbreeding coefficient, FIS. In this section results
struc-which individuals are more likely to breed and/or com-pete with nearby individuals, who are more likely to be related to each other than are randomly chosen members of the species. These simple facts change the way in which even the simplest selection acts to affect allele frequencies, mutation load, and the inbreeding depression that might result. With locally biased mating, the additive genetic variance within populations tends to be reduced for additive alleles but can be increased with rare recessive or overdominant alleles (Robertson 1952;TachidaandCockerham1987, 1989;Whitlock
Figure 6.—The effect of FIS on mutation load. In these
et al. 1993; Willis and Orr 1993). Selection within
examples, theFSTis held constant at 0.05, ignoring the fact
populations therefore tends to be less effective in
chang-that for a constant demography,FSTwill be increased somewhat
by increasedFIS, all else being equal. The y-axis is the load ing the frequencies of additively interacting alleles but
relative to the case ofFIS⫽0 (but unlike other graphs,FST⫽ can be more effective for rare recessive alleles. The
0.05). The solid lines correspond to soft selection, while the
genetic variance among populations and the total
ge-dashed lines plot hard selection. The mutation load can be
netic variance in the species tend to increase with
popu-substantially decreased by recurrent local inbreeding.
lation structure, for the same overall allele frequency. Therefore, even with additively acting alleles, if popula-ture is a contribution of FST to the total inbreeding tions are allowed to vary in their contribution to the coefficient term. With soft selection, however, FSTalso next generation (as it would be in the case of hard affects the change in allele frequency by selection by selection), then a structured population will have more affecting local competition, which is unlike the effects efficient response to selection than a panmictic one.
ofFIS. The balance between these two effects—the change (up
For deleterious mutations (s⬍0) at an equilibrium or down) in the response to selection within populations between mutation and selection, q Ⰶ 1. Making this and the increase in efficiency of selection among popu-assumption, we can solve for the equilibrium frequency lations—gives the overall effect of population structure
as above, and find on the change in allele frequency due to selection.
Whether⌬qis greater or less than expected in a panmic-tic population depends on whether individuals from
qˆ⬵
⫺s, (43) different demes compete for resources (hard vs. soft
selection), what the dominance relationships are be-where
tween alleles, and the extent of genetic differentiation ⫽b(FIT⫹(1⫺FIT)h)⫹(1⫺b) among populations.
For recessive alleles, the difference in response to ⫻
冢冢
1⫺FST1⫹FST
冣
(FISFST⫹FIT⫹(1⫺FIT)h)⫹ (1⫺2h)(1⫺FIS)
冣
. selection can be substantial, even for relatively weakpopulation structure. This difference is due largely to (44)
a change in the typical pattern of expression of the To find the mutation load, we want the mean fitness of
recessive alleles. With local mating, rare alleles are more the population given the mating system. In that case
likely to be expressed as homozygotes, and therefore the mutational load is given by
the response to selection on recessive alleles will be in L⫽1⫺w⫽1⫺(1⫹s[(1⫺FIT)(2p qh⫹q2)⫹FITq]).
proportion to their homozygous effects rather than (45) their weaker heterozygous effects. For hard selection, Putting in the equilibrium allele frequency from above, the change in the effects of selection and its
conse-we can find quences to load and inbreeding depression turn out
to be exactly as would be expected from treating the
L⫽
(1⫺(1⫺ FIT)(1⫺ 2h)) (46) nonrandom mating as a form of inbreeding (as in, for example,WorkmanandJain1966;CrowandKimura (to leading order ins). Note that with population struc- 1970;OhtaandCockerham1974;Landeand Schem-ture or local inbreeding, the load is a function of h, ske1985). With any soft selection, the resulting competi-which does not drop out as in the random mating case. tion among relatives causes population structure to have
See Figure 6. unique effects.
Genetic load: Since Haldane (1937) and Muller (1950) proposed that the mean fitness of a population
DISCUSSION
might be substantially reduced by “our load of muta-tions,” a great deal of argument has tried to resolve Efficiency of selection:Many if not most species are
sufficient to cause the mean fitness of populations to 1991; Byers and Waller 1999; Wang et al. 1999; Bataillonand Kirkpatrick 2000; Kirkpatrick and be dangerously low (Crow and Kimura 1964; Crow
1993;Lynchet al.1999). Jarne 2000), although experimental results are mixed (Byers and Waller 1999; Fowler and Whitlock If the genomic mutation rate to deleterious alleles is
represented byU, then the mutation load due to par- 1999). These reductions in load are temporary, how-ever, as mutation continues to increase load until it tially dominant, multiplicatively interacting deleterious
mutations in a large panmictic population is expected is returned to prebottleneck levels (Kirkpatrick and Jarne2000). In structured populations, however, purg-to be 1⫺e⫺U(Crow1993). Thus if the genomic
muta-tion rate approaches unity or higher (seeEyre-Walker ing is possible because of the increased expression of homozygous individuals, but the effect is not temporary andKeightley1999;Lynchet al.1999), the mutation
load could be quite large (e.g., 63% forU⫽1; 93% for because the populations continue to be somewhat inter-connected. New variation is brought into each
popula-U ⫽ 2.7). This has led to the exploration of various
deviations from these basic assumptions, as this load is tion by migration, so the purging does not stop as it does in inbred lines. [This effect is similar to the pattern thought to be too large to be borne by many species.
In particular, a great deal of attention has been paid observed by Wang (2000) with alternate outcrossing and full-sib mating.] The deleterious allele frequency to the idea that deleterious mutations might interact
synergistically, so that the rate of loss of fitness increases is therefore allowed to reach a different equilibrium, with fewer deleterious alleles and potentially a lower as the number of mutations goes up. While it is true
that synergistic epistasis can significantly reduce muta- mutation load than in an undivided population. The maximum reduction in load is by a factor of one-tion load in theory (Kimura and Maruyama 1966;
KondrashovandCrow1988), there is little empirical half (with hard selection and nearly completely recessive alleles). This reflects the fact that in this case, most support for the hypothesis that deleterious mutations
in-teract in this way consistently (Whitlock and Bour- individuals that die a selective death are homozygotes, taking two deleterious alleles from the population for guet2000 and references therein). Others suggest that
load may be reduced by intraindividual selection (Otto each selective death. Genetic load is a simple function of the number of individuals dying selective deaths and andOrive1995) or sexual selection (Whitlock2000).
It may be that reproductive excess in resource-limited the number of deleterious alleles that die with them (KondrashovandCrow1988). If the number of alleles populations is sufficient to allow for substantial load
without extinction (Wallace1991). It is also possible removed by each selective death could be doubled, then the genetic load is halved, as is almost the case in this that for most organisms the genomic deleterious
muta-tion rate is not so large (Garcı´a-Doradoet al.1999). example.
With overdominance and segregation load, however, Crow and Kimura (1970) showed that the expected
load at equilibrium with inbreeding can be reduced. the situation is reversed. Here the extra homozygosity caused by population structure results in a greater devia-Added to these explanations now is the hypothesis that
a substantial amount of the possible genetic load may tion from the maximum mean fitness, with an increase in load in proportion to FST (see Equation 33). This be eliminated by population structure. New analyses
and experiments show that new mutations tend to be change in segregation load is surprisingly independent of whether the population experiences soft or hard se-recessive with a mean dominance coefficient in the area
of 0.1–0.2 (Hughes1995; Houleet al. 1997;Garcı´a- lection. The relationship between load in subdivided and undivided populations is therefore likely to depend DoradoandCaballero2000). In this range, the
muta-tion load can be markedly reduced by even mild popula- on whether mutation load or segregation load is more important.
tion structure, especially under hard selection.
A striking difference caused by population structure It is important to note that the changes in genetic load that accompany population structure are not im-in the results for load is that the mutation load
contrib-uted by a locus is no longer independent of the genetic mediate. A previously undivided species that is suddenly subdivided will not change immediately to have a lower details of that locus. In particular, the dominance
coef-ficient is now an important determinant of the mutation frequency of deleterious alleles, but it will quickly come to have a higher homozygosity. As a result, a newly load, unlike the random mating case. Recessive alleles
are likely to contribute less than codominant ones to formed metapopulation will be expected to have some inbreeding depression and a lower fitness than either an the total mutation load.
The reduction in the overall frequency of deleterious undivided species or a metapopulation at equilibrium. Therefore, for example, the fragmentation that results recessive alleles and the expected decrease in the
muta-tion load experienced by a subdivided populamuta-tion have from human impact on the landscape is likely to have deleterious effects in the short to medium term. much in common with the phenomenon of purging in
bottlenecked or inbred populations. In bottlenecked or Inbreeding depression: Inbreeding depression is likely due to a combination of the expression as homozy-inbred populations, there can be a temporary reduction
mutation-selection balance and a reduction in the number of tion of dominance coefficients among new mutations. Nearly recessive mutations are much affected by popula-overdominant heterozygous loci. These two patterns are
called the dominance and overdominance models, re- tion structure, with great reductions in expected in-breeding depression expected even with relatively small spectively. With the dominance model, inbreeding not
only reduces fitness but also allows the population to values ofFST. Mutations with higher values of hare less likely to be affected. There is very little information purge deleterious alleles to some extent, such that
subse-quent inbreeding may not display as much inbreeding about some aspects of this important distribution. A simple theoretical observation may help. Alleles with depression (Lande and Schemske 1985; Byers and
Waller1999;BataillonandKirkpatrick2000;Wang dominance coefficients near1⁄2do not contribute much to inbreeding depression, even in a panmictic popula-2000). Overdominance depends on the presence of two
(or more) alleles in the population, and the equilibrium tion, for the simple reason that the value of their hetero-zygotes is not much different from the mean of the allele frequency maximizes fitness in a panmictic
popu-lation. Therefore purging is not possible with overdomi- homozygotes. Ashapproaches 0, inbreeding depression is much greater (see Figure 4). As a result, even if the nance, and inbreeding can only reduce fitness, both
immediately and ultimately. Therefore experimental spectrum of new mutations includes few that are nearly recessive, it is these that disproportionately cause in-metapopulations with hard selection will be a useful way
of discriminating between the dominance and overdom- breeding depression, and therefore the largest effect of population structure occurs for the dominance coeffi-inance models of inbreeding depression. An
experi-ment that artificially created metapopulations with hard cients that are most important.
One difficulty remains, however. A substantial frac-selection from a previously undivided species should,
at equilibrium, show much reduced inbreeding depres- tion of inbreeding depression is caused by alleles of very large effect (CharlesworthandCharlesworth sion if the dominance model is prevalent, but only
slightly reduced inbreeding depression if the overdomi- 1987). Such strong selection falls outside the conditions assumed in this article. While the inbreeding depression nance model is most important. (The caveat to this is
that if much inbreeding depression is due to overdomi- due to these large mutations, which tend to be nearly recessive (h ⬇0.02, Simmons and Crow 1977; Crow nant loci with very asymmetric homozygous effects, with
population structure these loci can fix for the allele and Simmons 1983), is likely to be much reduced in metapopulations for the same reasons as with weak se-corresponding to the fitter homozygote and the
associ-ated inbreeding depression goes to zero.) lection, the calculations with neutral FST will not give quantitative predictions for this class of alleles. Population structure causes some inbreeding, due to
the greater probability that individuals will mate with Conclusions: Spatial population structure has often been studied, both theoretically and empirically, re-related individuals in the same deme. This may reduce
inbreeding depression in two ways: first, because the flecting to some extent its prevalence in natural systems. We have measurements of FST from a wide variety of fitness of standard “outbred” individuals may reasonably
be measured relative to typical individuals in the species, species. Recently, the argument has been made thatFST is not a good measure of the rate of dispersal, the reason which are themselves somewhat inbred; and second, by
changing the allele frequencies of deleterious alleles in for whichFSTis often studied (WhitlockandMcCauley 1999). This article, however, has shown the value of the species as a whole. The two measures of inbreeding
depression discussed in this article include both of these studyingFSTof even neutral loci and its power to predict interesting evolutionary processes.FST, as defined in this effects (in the case of␦1) or just the second (in the case
of␦2). The extent of change in inbreeding depression in article, is an excellent description of the effects of spatial population structure on the response to weak selection. metapopulations depends on exactly how it is measured.
The inbreeding associated with population structure The FST found to be most useful for these results differs, however, from its standard definition. The pa-allows purging of rare, recessive, deleterious alleles and
therefore can reduce the inbreeding depression due rameter needed gives equal weight to all individuals and does not necessarily weight populations equally. In this to dominance but cannot much affect the inbreeding
depression due to overdominance. With overdominance, respect, it differs from other definitions in the literature. To simplify the mathematics, many theoretical models there is a smaller reduction in inbreeding depression
due solely to the fact that the mean fitness of outbred of FST assume equal population sizes at the point of measurement [e.g., the island model (Wright 1931), individuals is somewhat reduced, because of the
devia-tion in subpopuladevia-tions from the allele frequencies that the stepping stone models (Kimura andWeiss 1964), and the basic extinction-recolonization models ( Whit-give maximum mean fitness. The inbreeding depression
in structured populations is expected to be lower than lockandMcCauley1990)]. These models will predict theFSTrequired here, but more work is needed to define that in an undivided population, and it is much reduced
for the inbreeding depression caused by rare, deleteri- this weighting for other population structures. More importantly, current estimates of FSTfrom data weight ous recessive alleles.
Felsenstein, J.,1976 The theoretical population genetics of variable many systems with variance in population size, empirical
selection and migration. Annu. Rev. Genet.10:253–280. estimates of FSTdo not exactly match what is needed. Fowler, K.,andM. C. Whitlock,1999 The variance in inbreeding
depression and the recovery of fitness in bottlenecked popula-Statistical work allowing the estimation of this weighted
tions. Proc. R. Soc. Ser. B266:2061–2066. FSTwill therefore be very useful and straightforward.
Garcı´a-Dorado, A.,andA. Caballero,2000 On the average coef-Population structure allows an increase in homozygos- ficient of dominance of deleterious spontaneous mutations.
Ge-netics155:1991–2001. ity and competition among relatives, which both can
Garcı´a-Dorado, A., C. Lopez-Fanjul and A. Caballero, 1999 change the dynamics of selection. As a result, the effects
Properties of spontaneous mutations affecting quantitative traits. of selection can be weakened by local competition, but, Gen. Res.74:341–350.
Haldane, J. B. S.,1937 The effect of variation on fitness. Am. Nat. perhaps more importantly on balance, selection can be
71:337–349. intensified by the increase in genetic variance associated
Hedrick, P. W.,1986 Genetic polymorphism in heterogeneous envi-with greater homozygosity. As a result, equilibrium mu- ronments: a decade later. Annu. Rev. Ecol. Syst.17:535–566.
Hedrick, P. W., M. E. GinevanandE. P. Ewing,1976 Genetic tation load, inbreeding depression, and the rate of
re-polymorphism in heterogeneous environments. Annu. Rev. Ecol. sponse to selection can be changed, often in a way
Syst.7:1–32.
beneficial to the fitness of the population. Houle, D., K. A. Hughes, S. Assimacopoulos and B.
Charles-worth,1997 The effects of spontaneous mutation on quantita-I thank S. P. Otto, F. Rousset, M. Wade, S. Gle´min, and two
anony-tive traits. II. Dominance of mutations with effects on life-history mous reviewers for very helpful comments on the manuscript and N. traits. Genet. Res.70:27–34.
Barton, D. Charlesworth, J. Ronfort, and Y. Michalakis for discussions. Hughes, K. A.,1995 The inbreeding decline and average domi-This work was funded by the Natural Science and Engineering Re- nance of genes affecting male life-history characters inDrosophila search Council (Canada) and was done in part while I was kindly melanogaster.Genet. Res.65:41–52.
hosted at the Institute for Cell, Animal and Population Biology at the Johnston, M. O.,andD. J. Schoen,1994 On the measurement of inbreeding depression. Evolution48:1735–1741.
University of Edinburgh and at the Institut de Recherche pour le
Kimura, M.,andT. Maruyama,1966 The mutation load with epi-De´veloppment in Montpellier, France, funded by the Centre National
static gene interactions in fitness. Genetics54:1337–1351. de Recherches Scientifiques. Many thanks to them all.
Kimura, M.,andG. H. Weiss,1964 The stepping stone model of population structure and the decrease of genetic correlation with distance. Genetics49:561–576.
Kirkpatrick, M.,andP. Jarne,2000 The effects of a bottleneck
LITERATURE CITED on inbreeding depression and the genetic load. Am. Nat.155:
154–167.
Barrett, S. C. H.,andD. Charlesworth,1991 Effect of a change Kondrashov, A. S.,andJ. F. Crow,1988 King’s formula for the in the level of inbreeding on the genetic load. Nature352:522–524. mutation load with epistasis. Genetics120:853–856.
Barton, N. H.,2001 The evolutionary consequences of gene flow Lande, R.,andD. W. Schemske,1985 The evolution of self fertiliza-and local adaptation: future approaches, pp. 329–340 inDispersal, tion and inbreeding depression in plants. I. Genetic models. edited byJ. ClobertandE. Danchin.Oxford University Press, Evolution39:24–40.
Oxford. Lynch, M.,andB. Walsh,1998 Genetics and Analysis of Quantitative
Barton, N. H.,andM. C. Whitlock,1997 The evolution of meta- Traits.Sinauer, Sunderland, MA.
populations, pp. 183–210in Metapopulation Dynamics: Ecology, Ge- Lynch, M., J. Blanchard, D. Houle, T. Kibota, S. Schultzeet al., netics, and Evolution, edited byI. HanskiandM. Gilpin.Academic 1999 Perspective: spontaneous deleterious mutation. Evolution
Press, San Diego. 53:645–663.
Bataillon, T.,andM. Kirkpatrick,2000 Inbreeding depression Muller, H. J.,1950 Our load of mutations. Am. J. Hum. Genet.2: due to mildly deleterious mutations in finite populations: size 111–176.
does matter. Genet. Res.75:75–81. Ohta, T.,andC. C. Cockerham,1974 Detrimental genes with
par-Byers, D. L.,andD. M. Waller,1999 Do plant populations purge tial selfing and effects on a neutral locus. Genet. Res.23:191–200. their genetic load? Effects of population size and mating history Otto, S. P.,and M. E. Orive, 1995 Evolutionary consequences on inbreeding depression. Annu. Rev. Ecol. Syst.30:479–513. of mutation and selection within an individual. Genetics 141:
Caballero, A.,andW. G. Hill,1992 Effects of partial inbreeding 1173–1187.
on fixation rates and variation of mutant-genes. Genetics 131: Pollak, E.,1995 Some effects of selection when there is partial
full-493–507. sib mating. Genetics139:439–444.
Caballero, A., P. D. KeightleyandW. G. Hill,1991 Strategies for Pollak, E.,andM. Sabran,1992 On the theory of partially inbreed-increasing fixation probabilities of recessive mutations. Genet. Res. ing finite populations. 3. Fixation probabilities under partial
58:129–138. selfing when heterozygotes are intermediate in viability. Genetics
Charlesworth, D.,andB. Charlesworth,1987 Inbreeding depres- 131:979–985.
sion and its evolutionary consequences. Annu. Rev. Ecol. Syst.18: Robertson, A.,1952 The effect of inbreeding on the variation due
237–268. to recessive genes. Genetics37:189–207.
Cockerham, C. C.,1971 Higher order probability functions of identity Simmons, M. J.,andJ. F. Crow,1977 Mutations affecting fitness in of alleles by descent. Genetics69:235–246. Drosophilapopulations. Annu. Rev. Genet.11:49–78.
Crow, J. F.,1958 Some possibilities for measuring selection intensi- Tachida, H.,andC. C. Cockerham,1987 Quantitative genetic varia-ties in man. Hum. Biol.30:1–13. tion in an ecological setting. Theor. Popul. Biol.32:393–429.
Crow, J. F.,1993 Mutation, mean fitness and genetic load. Oxf. Tachida, H.,andC. C. Cockerham,1989 A building block model Surv. Evol. Biol.9:3–42. for quantitative genetics. Genetics121:839–844.
Crow, J. F.,andM. Kimura, 1964 The theory of genetic loads: Wallace, B.,1968 Topics in Population Genetics. Norton, New York. genetics today. Proc. Int. Congr. Genet.2:495–506. Wallace, B.,1991 Fifty Years of Genetic Load: An Odyssey.Cornell
Crow, J. F.,andM. Kimura,1970 An Introduction to Population Genet- University Press, Ithaca, NY.
ics Theory.Harper & Row, New York. Wang, J.,2000 Effects of population structures and selection
strate-Crow, J. F.,andM. J. Simmons,1983 The mutation load inDrosoph- gies on the purging of inbreeding depression due to deleterious
ila, pp. 1–35in The Genetics and Biology of Drosophila, Vol. 3c, edited mutations. Genet. Res.76:75–86.
byM. Ashburner, H. L. CarsonandJ. N. Thompson.Academic Wang, J., W. G. Hill, D. CharlesworthandB. Charlesworth,
Press, London. 1999 Dynamics of inbreeding depression due to deleterious
Eyre-Walker, A.,andP. D. Keightley,1999 High genomic delete- mutations in small populations: mutation parameters and in-breeding rate. Genet. Res.74:165–178.
Whitlock, M. C.,2000 Fixation of new alleles and the extinction then the probability that three alleles from the same of small populations: drift load, beneficial alleles, and sexual
deme are identical in state for allelea is selection. Evolution54:1855–1861.
Whitlock, M. C., andD. Bourguet, 2000 Factors affecting the
Pr[3aalleles]⬵q␥⬘ ⫹q2(3 ⫺3␥⬘)⫹q3(1⫺3 ⫹2␥⬘). genetic load inDrosophila: synergistic epistasis and correlations
among fitness components. Evolution54:1654–1660.
The approximation comes from assuming that the mean
Whitlock, M. C., andD. E. McCauley,1990 Some population
frequency of thea allele in the metapopulation is not genetic consequences of colony formation and extinction:
ge-netic correlations within founding groups. Evolution44:1717– much affected by the line of descent in any given local 1724.
population, which will be true with recurrent mutation
Whitlock, M. C.,andD. E. McCauley,1999 Indirect measures of
and a large number of demes. In that case, is well gene flow and migration: FSTdoesn’t equal 1/(4Nm⫹1). Heredity
82:117–125. approximated byF
ST, and␥⬘will be well approximated
Whitlock, M. C., P. C. PhillipsandM. J. Wade,1993 Gene
interac-by the standardized skewness defined above. tion affects the additive genetic variance in subdivided
popula-We can calculate the value of ␥in an island model. tions with migration and extinction. Evolution47:1758–1769.
Willis, J. H., andH. A. Orr,1993 Increased heritable variation Wright(1937a,b) determined the distribution of allele following population bottlenecks—the role of dominance.
Evolu-frequencies across populations for the neutral island tion47:949–957.
model without mutation,
Workman, P. L.,andS. K. Jain,1966 Zygotic selection under mixed random mating and self-fertilization: theory and problems of
⌿(q)⫽C(1⫺q)4Nm(1⫺q)⫺1q4Nmq⫺1, estimation. Genetics54:159–171.
Wright, S.,1931 Evolution in Mendelian populations. Genetics16:
where ⌿(q) is the probability density of populations 97–159.
Wright, S.,1937a The distribution of gene frequencies in popula- with allele frequency q, qis the mean allele frequency tions. Proc. Natl. Acad. Sci. USA23:307–320. across all populations,
Nm is the effective number of
Wright, S.,1937b The distribution of gene frequencies in
popula-migrants into and out of each population, and C is a tions. Science85:504.
Wright, S.,1942 Statistical genetics and evolution. Bull. Am. Math. constant of integration such that 兰10⌿(q)⫽ 1, so C ⫽ Soc.48:223–246. ⌫[4Nm]/(⌫[4Nmq]⌫[4Nm(1⫺q)]). The mean of this
distribution [given by兰1
0q⌿(q)dq] does resolve toq. We Communicating editor:D. Charlesworth
can confirm the variance among demes is as expected:
V(q)⫽E[q2]⫺q2⫽
冮
10
q2⌿[q]dq⫺q2⫽ q(1⫺q) 4Nm⫹1.
APPENDIX:␥AND THE SKEWNESS OF THE ALLELE
FREQUENCY DISTRIBUTION
Similarly, we can find the expected value ofq3, Let us define3to be the skewness ofqamong
popula-tions. If we define a term␥ ⫽ 3/(p q(p⫺q)) as a stan- E[q3]⫽
冮
10
q3⌿[q]dq⫽q(1⫹2Nm q)(1⫹ 4Nmq) (1⫹2Nm)(1⫹4Nm) , dardized skewness ofq(similar to the variance definition
ofFST), we can see that and the skewness (3),
E[q3]⫽q␥ ⫹q2(3F
ST⫺3␥)⫹q3(1⫺3FST⫹2␥).
3⬅E[(q⫺q)3]⫽ q(1⫺ q)(1⫺ 2q) (1 ⫹2Nm)(1⫹4Nm). A similar equation results from a consideration of the
probability of identity by descent of three alleles chosen Thus, for a neutral island model, from the same deme in a metapopulation. If and␥⬘
are the probabilities of identity by descent of two or ␥ ⫽ 1
(1⫹ 2Nm)(1⫹4Nm)⫽ 2F2
ST (1⫺FST)