Article
1
Enhanced nanoencapsulation of sepiapterin within
2
PEG-PCL nanoparticles by complexation with
3
triacetyl-beta cyclodextrin
4
5
Nataliya Kuplennik and Alejandro Sosnik1,*
6
7
1 Laboratory of Pharmaceutical Nanomaterials Science, Department of Materials Science and Engineering,
8
Technion‐Israel Institute of Technology, Haifa, Israel
9
* Correspondence: Laboratory of Pharmaceutical Nanomaterials Science, De‐Jur Bldg., Office 607,
10
Department of Materials Science and Engineering, Technion‐Israel Institute of Technology, 3200003 Haifa,
11
Israel; Email: [email protected], [email protected]; Tel.: +972‐(0)77‐887‐1971
12
13
Received: date; Accepted: date; Published: date
14
15
Abstract: In this work, we investigated for the first time the complexation of sepiapterin (SP), the
16
natural precursor of the natural essential cofactor tetrahydrobiopterin, that displays mild water‐
17
solubility and short biological half‐life, with the hydrophobic triacetyl‐β‐cyclodextrin (TAβCD) to
18
improve its encapsulation within methoxy‐poly(ethylene‐glycol)‐poly(epsilon‐caprolactone)
19
(mPEG‐PCL) nanoparticles. First, TAβCD‐SP complexes were produced by spray‐drying of
20
TAβCD/SP binary solutions by utilizing the Nano Spray Dryer B‐90 HP. Then, dry powders were
21
characterized by differential scanning calorimetry (DSC), Fourier‐transform infrared spectroscopy
22
(FTIR) and transmission and scanning electron microscopy (SEM and TEM, respectively) and
23
compared to the complex components and physical mixtures (PMs). Next, SP was encapsulated
24
within methoxy‐poly(ethylene‐glycol)‐poly(epsilon‐caprolactone) (mPEG‐PCL) nanoparticles by
25
nanoprecipitation of a SP/TAβCD complex/mPEG‐PCL solution. In addition to complex
26
nanoencapsulation, we assessed encapsulation of pure SP by nanoprecipitation with an
27
intermediate step, which comprised the co‐drying of SP, TAβCD and mPEG‐PCL copolymer
28
solution in organic solvent; this step aimed to promote the formation of molecular interactions
29
between SP, TAβCD and the PCL blocks in the copolymer. SP‐loaded mPEG‐PCL nanoparticles
30
were characterized by dynamic light scattering (DLS) and SEM. Nanoparticleswith size of 74‐75 nm
31
and small polydispersity index (PDI <0.1) were obtained when SP‐TAβCD equimolar spray‐dried
32
complex was used for nanoencapsulation, and SEM analysis indicated the absence of free SP
33
crystals. Moreover, the encapsulation efficiency (%EE) and drug loading (DL) were 85% and 2.6%,
34
respectively, as opposed to those achieved with pure SP encapsulation (14% and 0.6%, respectively).
35
Overall, our results confirm that spray‐drying of SP/TAβCD solutions at the appropriate molar ratio
36
leads to the hydrophobization of the relatively hydrophilic SP molecule, enabling its encapsulation
37
within mPEG‐PCL nanoparticles.
38
39
Keywords: Sepiapterin; triacetyl‐β‐cyclodextrin (TAβCD); hydrophilic drug/cyclodextrin complexes;
40
spray‐drying; methoxy‐poly(ethylene‐glycol)‐poly(epsilon‐caprolactone) (mPEG‐PCL)
41
nanoparticles.
42
43
1. Introduction
44
Tetrahydrobiopterin (BH4, Figure S1), a naturally occurring molecule, is present in probably
45
every cell or tissue of higher organisms and it is well‐established as cofactor in various essential
46
enzymatic pathways that include the degradation of phenylalanine and the biosynthesis of
47
neurotransmitters such as serotonin, melatonin, dopamine, noradrenaline and adrenaline [1,2]. BH4
48
is also a key player in various biological processes associated with cardiovascular homeostasis and
49
the immune response [1,3]. Defects in BH4 metabolism caused by congenital mutations in specific
50
genes encoding for enzymes involved in its synthesis or regeneration and known with the general
51
name of BH4 deficiency lead to the systemic deficiency of neurotransmitters in the CNS [4].
52
Moreover, decreased levels of BH4 have been also documented in neurological diseases such as
53
Parkinson’s disease, autism, depression and Alzheimer’s disease. In some of them, administration of
54
BH4 has been reported to improve the clinical symptoms [1,5]. However, BH4 undergoes fast aerobic
55
degradation, which results in a decrease of the treatment efficacy [6]. BH4 deficiency is a disease with
56
severe impact on neurological and cognitive development. In this framework, the development of
57
advanced delivery systems that improve the biological half‐life of BH4 and its bioavailability in the
58
central nervous system (CNS) emerges as a strategy to enhance the efficacy of the current replacement
59
therapy.
60
There exists a broad spectrum of synthetic biodegradable polymers used for production of
61
nanoparticulate drug delivery systems that improve the physicochemical stability and sustain the
62
release of hydrophobic cargos [7]. Among them, block copolymers made of hydrophilic components
63
(e.g., poly(ethylene glycol), PEG) and hydrophobic polyester blocks such as poly(lactic acid) (PLA),
64
poly(lactic‐co‐glycolic acid) (PLGA) and poly(epsilon‐caprolactone (PCL) have gained major
65
attention owing to the ability to fine‐tune the hydrophilicity/lipophilicity and the thermal properties
66
of the product and consequently to control the biodegradation and the release of the cargo in the
67
biological environment [8–15]. However, BH4 is highly water‐soluble (S0 = 23 mg ml‐1) and extremely
68
instable in water and air (Figure S2), precluding its encapsulation within polymeric nanoparticles.
69
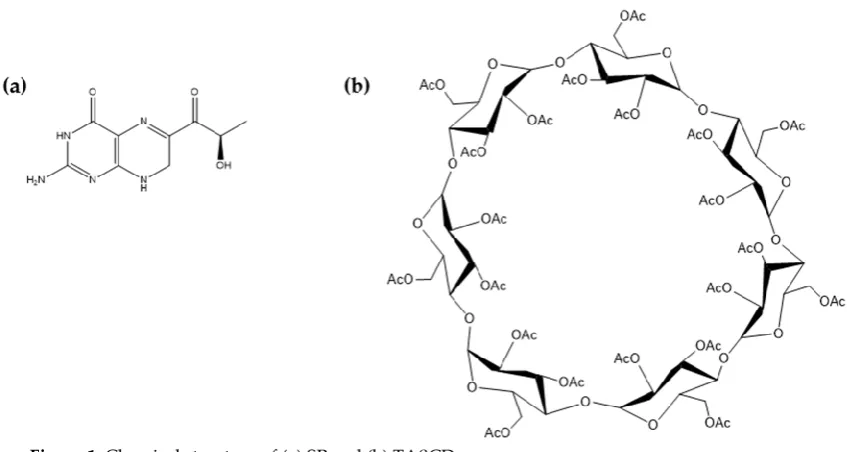
Sepiapterin (SP, Figure 1a) is the natural precursor of BH4 and it is intracellularly converted into
70
BH4 [16]. SP displays lower aqueous solubility (1.7 mg ml‐1) and higher chemical stability than BH4
71
and thus, it appears a good candidate to replace it in the design of advanced drug delivery systems.
72
At the same time, encapsulation of relatively hydrophilic molecules within hydrophobic polymeric
73
nanoparticles by utilizing conventional preparation methods remains a challenge and the
74
development of new encapsulation procedures is called for [17,18].
75
The use of cyclodextrins to increase the aqueous solubility of hydrophobic drugs has been
76
extensively investigated [19–22]. Recently, peracylated cyclodextrins (CDs) that are freely soluble in
77
organic solvents and poorly water‐soluble were proposed as excipients to decrease the water‐
78
solubility, prolong the biological half‐life and sustain the release of hydrophilic drugs through the
79
synthesis of water insoluble drug/CD complexes [23–27].
80
Aiming to encapsulate SP within polymeric nanoparticles as a platform for delivery and
81
targeting, in this work, we synthesized for the first time a SP/triacetyl‐β‐cyclodextrin (TAβCD)
82
(Figure 1b) complex by spray‐drying SP/TAβCD binary solutions utilizing the Nano Spray Dryer B‐
83
90 HP. Then, dry powders were characterized by differential scanning calorimetry (DSC), Fourier‐
84
transform infrared spectroscopy (FTIR) and transmission and scanning electron microscopy (SEM
85
and TEM, respectively) and compared to the pure complex components and SP/CD physical mixtures
86
(PMs). Finally, the optimized complex was encapsulated within methoxy‐poly(ethylene‐glycol)‐
87
poly(epsilon‐caprolactone) (mPEG‐PCL) nanoparticles by a direct nanoprecipitation method. Overall
88
results confirm the promise of this simple and scalable strategy for the nanoencapsulation of SP.
90
Figure 1. Chemical structure of (a) SP and (b) TAβCD.
91
92
2. Results and Discussion
93
2.1. BH4 and SP stability
94
BH4 (Figure S1) is known to undergo rapid degradation. Due to oxidation, BH4 solution
95
becomes yellow. SP is known to be less sensitive to oxygen than BH4. The stability of BH4 and SP in
96
deionized oxygen‐free water (1% w/v) was investigated by UV/Vis spectrophotometry (Figure
97
S2). The absorbance peak of BH4 at 266 nm decreased by 15% and red‐shifted after 48 h, while a new
98
absorbance peak at 329 nm appeared already after 1 h (Figure S2a). This also results in a change color
99
to yellow. Conversely, SP remained stable even after 8 days, confirming that this precursor is much
100
more stable than BH4 and a better candidate for encapsulation (Figure S2b). Moreover, the intrinsic
101
solubility of BH4 in water is higher than of SP and thus, its encapsulation in hydrophobic polymers
102
precluded. Thus, SP was chosen for further experiments, both due to higher stability and lower
103
solubility.
104
For improvement of SP encapsulation within mPEG‐PCL nanoparticles, we assessed two
105
approaches: (i) drying of a solution of SP, TAβCD and mPEG‐PCL copolymer in acetone prior to
106
redissolution in acetone and nanoprecipitation and (ii) spray‐drying of a solution of SP and TAβCD
107
to obtain SP‐TAβCD complex, and subsequent nanoprecipitation of the complexes and copolymers
108
to obtain SP‐encapsulated nanoparticles. Nanoprecipitaion in both approaches was performed
109
according to the protocol described in the experimental section. Spray‐dried SP/TAβCD complexes
110
were further fully characterized to get an insight on interactions occurring between the two
111
components.
112
2.2. Characterization of spray-dried SP/TAβCD complexes
113
In order to investigate possible SP/TAβCD interactions and exclude artifacts resulting from the
114
sample preparation, pure TAβCD was subjected to the same procedure (dissolution and spray‐
115
drying) as binary SP/TAβCD solutions; this sample is named processed TAβCD. Pure SP was not
116
spray‐dried owing to its high cost as spray‐drying requires relatively large amounts for sample
117
collection. Instead, a reference sample (processed SP) was prepared by dissolution of SP in ethanol
118
and drying under vacuum. Two SP:TAβCD molar ratios were used for complex preparation:
119
equimolar (1:1) and with an excess of TAβCD (2:1) (Table 1). PMs of the pure components with the
120
same molar ratios were prepared by grinding of dry TAβCD and SP using mortar and pestle.
Table 1. Nomenclature of SP/TAβCD complexes and their PMs.
123
Preparation method SP:TAβCD molar ratio
Nomenclature
Spray‐drying (SD) 1:1 SP1/TAβCD1 SD 1:2 SP1/TAβCD2 SD Drying with copolymer
(DWC)
1:1 SP1/TAβCD1 DWC 1:2 SP1/TAβCD2 DWC Physical mixture (PM( 1:1 SP1/TAβCD1 PM
1:2 SP1/TAβCD2 PM
124
2.2.1. Fourier-transform infrared spectroscopy
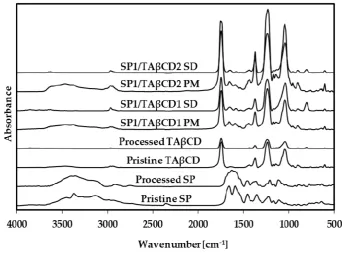
125
FTIR spectra of SP, TAβCD, their PMs and the spray‐dried samples are shown in Figure 1. Pure
126
and processed SP showed two bands at 3444 and 3377 cm−1 of N–H stretching vibration of primary
127
amine, a band at 3155 cm−1 due to the N–H stretching of secondary amine, and characteristic bands
128
at 1620 and 1590 cm−1 assigned to N‐H bending of primary amine (Figure 1). TAβCD displayed very
129
strong bands at 1708, 1371, 1234 and 1045 cm−1 that correspond to C=O, ‐CH3 and C‐O‐C vibrations
130
of the acetyl group (Figure 1) [28] . PMs spectra showed the overlapping of the bands of pure SP and
131
TAβCD and no significant shifts or depletion of the intensity of the characteristic bands with respect
132
to the pure components were observed. In contrast, FTIR spectra of the spray‐dried SP/TAβCD
133
revealed a strong reduction or the complete disappearance of the characteristic SP bands in the 3800‐
134
3000 cm‐1 region, suggesting the interaction between SP and TAβCD and the formation of a complex.
135
136
Figure 1. FTIR spectra of pristine and processed SP and TAβCD, their PMs and the SP/TAβCD
137
complexes obtained by spray‐drying.
138
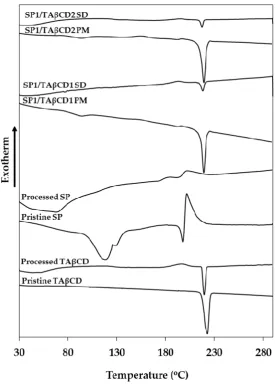
2.2.2. Differential scanning calorimetry (DSC)
139
DSC is widely used to study the interaction between a drug and a CD in the solid state
140
[20,29,30]. Thus, to further confirm the formation of a complex, we compared the thermal behavior
141
of pristine SP, SP/TAβCD PMs and spray‐dried SP/TAβCD by DSC. Pristine TAβCD was
characterized by a sharp melting endotherm at 223°C (Figure 2) associated with a melting enthalpy
143
(Hm) of 7.13 J g‐1 (Table 2). Processed TAβCD thermal behavior differed from the pristine one; spray‐
144
dried TAβCD displayed an exothermic peak upon heating at 195°C due to the crystallization of
145
amorphous TAβCD with a crystallization enthalpy (Hc) of 8.4 J g‐1 (Figure 2). The recrystallization
146
of acetylated CDs that undergo amorphization during spray‐drying was described elsewhere [31].
147
Then, recrystallized TAβCD melted at 220°C, though a smaller Hm of 13 J g‐1 than in pristine TAβCD
148
(43 J g‐1) was observed (Table 2). This kind of behavior was also reported for TAβCD recrystallized
149
from water/organic solvent solutions and indicates the partial amorphization of the CD [31]. Pure SP
150
showed a more complex thermal behavior. A broad endotherm at 116°C (Hm = 77.3 J g‐1) probably
151
stemmed from the release of bound water (Figure 2, Table 2). Then, the beginning of melting was
152
observed at 190°C followed by decomposition. Processed SP showed a similar profile, though the
153
water‐related peak of pristine SP was not apparent in the processed counterpart, suggesting the
154
efficient elimination of water residues available in the original sample. However, the broad
155
endotherm at 69°C probably corresponded to the evaporation of some solvent residues.
156
157
158
Figure 2. DSC thermograms of pristine and processed SP and TAβCD, their PMs and the complexes
159
obtained by spray‐drying.
160
The thermal analysis of PMs presented the endotherm associated with water release and the
161
characteristic transitions of pure SP and TAβCD. TAβCD crystallization on heating at lower
162
temperatures resulted from recrystallization of an amorphous form, obtained during the grinding
163
in the preparation of PMs [26]. Appearance of weak endothermic peak at 190°C, followed by an
exotherm, similar to that of pristine SP, was observed in both SP1/TAβCD1 and SP1/TAβCD2 PMs.
165
However, due to relatively low weight fraction of SP in the samples, these peaks were less prominent
166
compared to pristine SP. Such kind of thermal behavior of a drug in binary drug/CD PMs is typical
167
of this kind of systems [32,33]. These observations suggest that there are no solid‐state interactions
168
between the two components in the PM. In contrast, DSC curves of the spray‐dried SP/TAβCD
169
complexes showed complete disappearance of the SP melting peak, and a strong reduction in the
170
Hm of TAβCD, indicating the total SP and the partial TAβCD amorphization, and the formation of
171
a SP/TAβCD complex. In addition, considering that SP is a relatively hydrophilic molecule and that
172
the cavity of TAβCD is hydrophobic, it is likely that SP/TAβCD form a non‐inclusion complex.
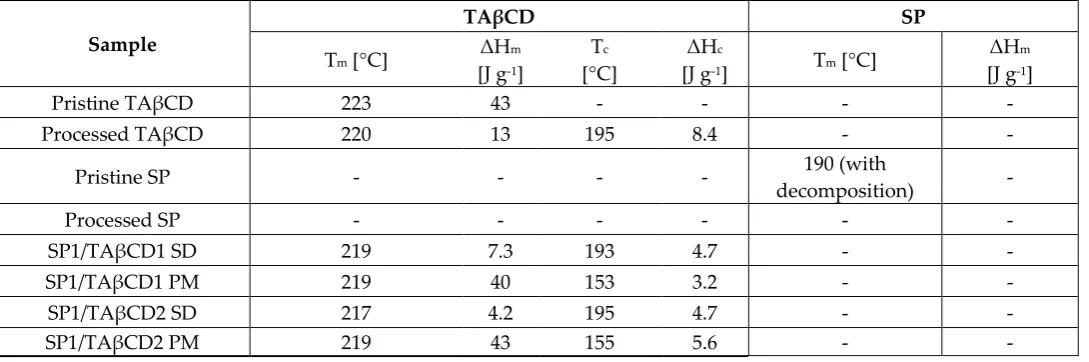
173
Table 2. Thermal analysis of pristine and processed SP and TAβCD, spray‐dried complexes and
174
PMs, as determined by DSC. Enthalpy values were normalized to TAβCD and SP content.
175
176
2.2.3. Morphological characterization of spray-dried complexes
177
Morphological characterization of the drug/CD complexes by electron microscopy is widely
178
used [30,34]. Nevertheless, it should be mentioned that even if an apparent difference in
179
crystallization state of the raw materials compared to the products exists, this characterization
180
method should be used to confirm the formation of a complex only when combined with other
181
chemical and thermal characterization methods [32]. The surface aspect of processed SP and TAβCD,
182
their PMs and the spray‐dried complexes were visualized by HR‐SEM (dry powders) and TEM
183
(powders re‐suspended in water and casted). In HR‐SEM, processed (spray‐dried) TAβCD appeared
184
as round‐shaped amorphous particles (0.5‐5 µm) (Figure 3a). In addition, processed SP showed
185
irregular elongated needle‐like crystals formed due to its crystallization during solvent evaporation.
186
HR‐SEM micrographs of SP/TAβCD PMs revealed the presence of the SP crystals dispersed in
187
TAβCD (Figure 3c,e); no molecular interactions between the two substances in solid state were
188
observed. Conversely, spray‐dried mixtures appeared as round‐shape particles, similar to spray‐
189
dried pristine TAβCD, with no visible SP crystals (Figure 3d,f). These results were consistent with
190
DSC analysis and confirmed the amorphous nature of the spray‐dried SP/TAβCD binary systems.
191
Sample
TAβCD SP
Tm [°C] ΔH m
[J g‐1]
Tc
[°C]
ΔHc
[J g‐1] Tm [°C]
ΔHm
[J g‐1]
Pristine TAβCD 223 43 ‐ ‐ ‐ ‐ Processed TAβCD 220 13 195 8.4 ‐ ‐
Pristine SP ‐ ‐ ‐ ‐ 190 (with
decomposition) ‐
Processed SP ‐ ‐ ‐ ‐ ‐ ‐
192
Figure 3. HR‐SEM micrographs of (a) processed TAβCD, (b) processed SP, (c) SP1/TAβCD1 PM, (d)
193
spray‐dried SP1/TAβCD1 complex, (e) SP1/TAβCD2 PM and (f) spray‐dried SP1/TAβCD2 complex.
194
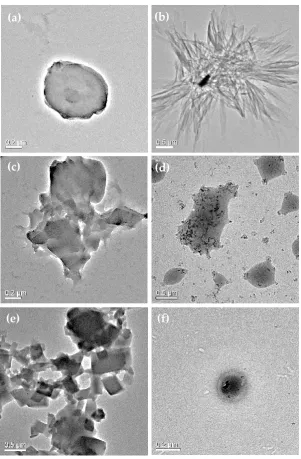
In addition, in TEM, processed TAβCD appeared as particles of irregular shape (Figure 4a),
195
while a processed SP sample produced by direct drop casting showed a needle‐like crystalline
196
morphology (Figure 4b). These results were similar to those obtained in HR‐SEM. Both SP/TAβCD
197
PMs showed the presence of square‐shaped glassy chip structures that are typical for TAβCD (Figure
198
4c,e), while these structures were not observed in spray‐tried complexes (Figure 4d,f) [31]. These
199
observations further supported that both components undergo amorphization during spray‐drying.
201
202
Figure 4. TEM micrographs of (A) processed TAβCD, (B) processed SP, (C) SP1/TAβCD1 PM, (D)
203
spray‐dried SP1/TAβCD1 complex, (E) SP1/TAβCD2 PM and (F) spray‐dried SP1//TAβCD2 complex.
204
2.3. Production and characterization of SP-loaded nanoparticles
205
2.3.1. mPEG-PCL copolymer synthesis.
206
A mPEG‐PCL copolymer with a relatively low hydrophilic‐lipophilic balance was chosen as a
207
model for nanoparticle production and synthesized by the ring opening polymerization (ROP) of
208
epsilon‐caprolactone (CL) initiated by the terminal hydroxyl group of a methoxy‐terminated PEG
209
with a molecular weight of 4000 g mol‐1 in the presence of tin(II) 2‐ethylhexanoate (SnOct) as catalyst
210
at 145oC for 2.5 h and in the appropriate CL:mPEG molar ratio to obtain a PCL block of approximately
211
20,000 g mol‐1 (Figure S3). The successful polymerization was confirmed by proton nuclear magnetic
212
resonance spectroscopy (1H‐NMR) (Figure S4) and the number average molecular weight (Mn), the
213
weight average molecular weight (Mw) and the dispersity (Đ, Mw/Mn) of the copolymer measured by
214
gel permeation chromatography (GPC) (Table S1). Figure S4 shows a representative 1H‐NMR
215
spectrum of the obtained mPEG‐PCL copolymer. The peak at δ = 3.60 ppm was assigned to the
216
(a)
(b)
(d)
(c)
methylene (–CH2) protons of the PEG chain. In addition, characteristic peaks of the methylene
217
protons of the PCL block appeared at δ = 2.26, 1.61, 1.35, and 4.02 ppm. Since the number‐average
218
molecular weight of the PEG block used for the reaction is known from the supplier, the molecular
219
weight of PCL block was calculated by taking the integration ratio of the characteristic peak of PEG
220
(δ = 3.60 ppm) and PCL (δ = 2.26 ppm) (Table S1). In addition, the molecular weight of the copolymer
221
was measured by GPC (Table S1). The experimental molecular weight was similar to the theoretical
222
one.
223
2.3.2. Nanoencapsulation of SP.
224
Pristine SP was encapsulated within mPEG‐PCL nanoparticles by a modified nanoprecipitation
225
method performed under inert nitrogen conditions in a flask protected from light to prevent the
226
possible oxidation of SP. Aiming to improve the SP loading within the nanoparticles, we assessed the
227
encapsulation by utilizing two methods (Figure 5).
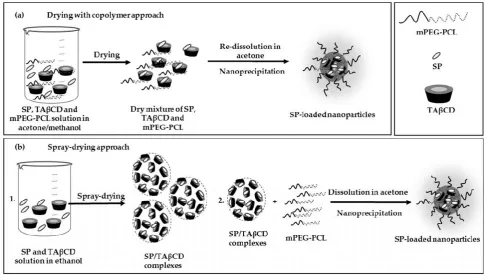
228
Figure 5. Method for the encapsulation of SP. (a) Drying of the SP, TAβCD with mPEG‐PCL
229
copolymer prior to nanoprecipitation and (b) co‐dissolution of spray‐dried SP/TAβCD complex with
230
the copolymer and nanoprecipitation.
231
The first included dissolution of SP, TAβCD and the mPEG‐PCL copolymer in organic solvent,
232
drying, and re‐dissolving in acetone with subsequent nanoprecipitation and nanoparticle formation
233
(Figure 5a), while in the second, a spray‐dried SP/TAβCD complex was co‐dissolved with the
234
copolymer and used for the nanoprecipitation (Figure 5b). It is worth stressing that equivalent
235
amounts of each component were used, as depicted in Table 3.
236
237
238
239
Table 3. Equivalent amounts of the different components used for the encapsulation of SP in
241
mPEG‐PCL nanoparticles.242
243
244
245
246
247
248
249
250
251
252
253
254
255
256
257
As for the first approach of preliminar dissolution of all three components and drying, we aimed
258
to promote both the interactions between hydrophobic TAβCD and slightly more hydrophilic SP, as
259
well as between hydrophobic PCL blocks of the copolymer and TAβCD and thus, increase the
260
entrapment of SP molecules in the PCL/TAβCD matrix formed during the nanoprecipitation process
261
with respect to TAβCD‐free counterparts.
262
2.3.3. Size and size distribution of SP-loaded nanoparticles.
263
The size (hydrodynamic diameter, Dh) and size distribution (polydispersity index, PDI) of SP‐
264
free and SP‐loaded nanoparticles produced by both methods, as well as suspensions of free TAβCD
265
subtracted to nanoprecipitation at the same conditions, were measured by DLS (Table 4).
266
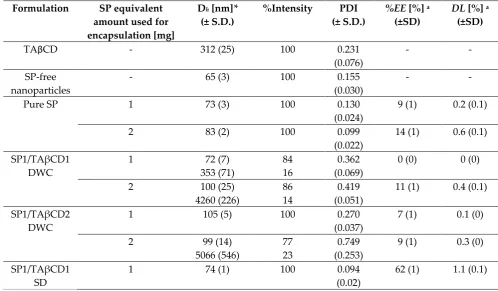
Table 4. Characterization of SP‐loaded mPEG‐PCL nanoparticles: size and size distribution (as
267
measured by DLS), SP encapsulation yield and drug loading in the nanoparticles.
268
Formulation SP equivalent amount used for encapsulation [mg]
Dh [nm]* (± S.D.)
%Intensity PDI (± S.D.)
%EE [%] a
(±SD)
DL [%] a
(±SD)
TAβCD ‐ 312 (25) 100 0.231 (0.076)
‐ ‐
SP‐free nanoparticles
‐ 65 (3) 100 0.155 (0.030)
‐ ‐
Pure SP 1 73 (3) 100 0.130 (0.024)
9 (1) 0.2 (0.1)
2 83 (2) 100 0.099 (0.022)
14 (1) 0.6 (0.1)
SP1/TAβCD1 DWC
1 72 (7) 353 (71)
84 16
0.362 (0.069)
0 (0) 0 (0)
2 100 (25) 4260 (226)
86 14
0.419 (0.051)
11 (1) 0.4 (0.1)
SP1/TAβCD2 DWC
1 105 (5) 100 0.270 (0.037)
7 (1) 0.1 (0)
2 99 (14) 5066 (546)
77 23
0.749 (0.253)
9 (1) 0.3 (0)
SP1/TAβCD1 SD
1 74 (1) 100 0.094 (0.02)
62 (1) 1.1 (0.1) Formulation
Equivalent amount used for encapsulation mPEG‐PCL [mg] SP [mg] TAβCD [mg] Pure SP 50 2 ‐ 1 ‐
SP1/TAβCD1 DWC 2 17
1 8.5
SP1/TAβCD2 DWC 2 34
1 17
SP1/TAβCD1 SD 2 17
1 8.5
SP1/TAβCD2 SD 2 34
2 75 (2) 100 0.091 (0.021)
85 (1) 2.6 (0.1)
SP1/TAβCD2 SD
2 69 (3) 312 (35) 4071 (852)
51 40 9
0.694 (0.067)
53 (1) 0.9 (0.1)
1 72 (1) 5105 (496)
89 11
0.389 (0.093)
50 (1) 1.5 (0.1)
aResults are the average of 3 experiments (n = 3).
269
270
All the SP‐loaded nanoparticles produced by the first approach, with the exception of the
271
SP1/TAβCD2 formulation that used 1 mg of SP, showed two size populations: one major in the
272
nanoscale (72‐100 nm) and one minor in the microscale (4.2‐5 µm) (Table 4). SP1/TAβCD2 DWC with
273
1 mg SP results in nanoparticles with monomodal size distribution and Dh of 105 nm. These results
274
indicated the poor mixing between both hydrophobic components in the nanoparticles. In the case of
275
spray‐dried complexes, SP1/TAβCD1 resulted in nanoparticles with small size of 74‐75 nm and PDI
276
<0.1 (Table 4).
277
2.3.4. Encapsulation efficiency and drug loading.
278
Two parameters, the encapsulation efficiency (%EE) and the drug loading (DL) of SP in mPEG‐
279
PCL nanoparticles were quantified. For this, SP‐loaded nanoparticle suspensions were washed
280
thoroughly to remove residues of free TAβCD and SP, free SP quantified in the filtrate fraction and
281
the %EE calculated according to Equation 1
282
283
%EE = SPt × 100% (1)
284
285
Where SPnanoparticle is the weight of SP in the nanoparticles and SPt is the total weight of SP used in the
286
encapsulation process.
287
288
In addition, the DL was calculated according to Equation 2
289
290
DL =
NPt x 100% (2)
291
Where SPnanoparticle is the weight of SP in the nanoparticles and NPt is the total weight of nanoparticles
292
used for the quantification.
293
SP is hydrophilic and thus, its water‐soluble nature makes it of difficult physical loading within
294
hydrophobic mPEG‐PCL nanoparticles, resulting in %EE and DL of 9‐14% and 0.2‐0.6% (Table
295
4). Similar or lower values were obtained with DWC systems. These results were consistent with DLS
296
data, confirming that in this method, there is no effective entrapment of SP molecules within the PCL
297
domains of the nanoparticle regardless of the presence of TAβCD molecules. When the CD was used
298
to hydrophobize SP by spray‐drying, both %EE and DL increased. In this context, the highest %EE
299
and DL values (85% and 2.6%, respectively) were observed for SP‐loaded nanoparticles produced
300
with SP1/TAβCD1 SD and 2 mg of SP in the nanoprecipitation.
301
2.3.5. Morphological characterization of SP-loaded nanoparticles.
302
Representative SP‐loaded nanoparticles were visualized using HR‐SEM (Figure 6). For this,
303
nanoparticles suspensions were drop‐casted on silicon wafer. Upon water evaporation and drying of
304
the sample, free SP crystallizes and forms needle‐like crystals, similar to those observed during TEM
305
analysis (Figure 4b). Free TAβCD can also undergo crystallization upon drying and form well‐
306
defined prismatic crystals or, conversely, to remain amorphous and form glassy chips [31]. As it can
be seen, in SP‐loaded nanoparticles prepared by the DWC method using 1 and 2 mg equivalent
308
amounts of SP (Figure 6a,b, respectively), both SP and TAβCD crystals were observed, confirming
309
the presence of free SP and TAβCD in the nanoparticle suspension. As for SP‐loading nanoparticles
310
prepared using spray‐dried complexes, in case of TAβCD1‐SP1 with 1 mg of SP, there were no SP or
311
TAβCD crystals (Figure 6c,d). However, TAβCD2‐SP1 produced with 1 mg of SP, several glassy
312
TAβCD chips were seen. These findings indicated that a higher relative weight fraction of TAβCD
313
used in the production of the complex with SP resulted in an excess of TAβCD which was not
314
efficiently entrapped within the PCL matrix of the nanoparticle formed during the nanoprecipitation.
315
In other words, the excess of TAβCD precluded the formation of stable mPEG‐PCL nanoparticles.
316
Overall these observations were in a good agreement with DLS data and confirmed that additional
317
size populations observed in DLS analysis were associated with the presence of free or aggregated
318
TAβCD.
319
320
321
Figure 6. HR‐SEM micrographs of SP‐loaded mPEG‐PCL nanoparticles utilizing (a) SP1/ TAβCD1
322
DWC (1 mg of SP), (b) SP1/TAβCD1 DWC (2 mg of SP), (c) encapsulation of spray‐dried SP1/TAβCD1
323
complex (1 mg of SP) under x5K, (d) x50K magnification of (c) and (e) and encapsulation of spray‐
324
dried SP1/TAβCD2 complex (1 mg of SP).
325
4. Materials and Methods
327
4.1. Preparation of spray-dried TAβCD-SP complexes.
328
TAβCD (85 or 170 mg for 1:1 and 1:2 SP/TAβCD complexes respectively; Sigma‐Aldrich, St.
329
Louis, MO, USA;) was dissolved in ethanol (19 and 38 mL for 1:1 and 1:2 complexes, respectively;
330
Gadot, Netanya, Israel) with assistance of sonication in an ultrasonic bath (5 min, Elmasonic S 30,
331
Elma Schmidbauer GmbH, Singen, Germany). SP (10 mg; Schricks Laboratories, Bauma, Switzerland)
332
was dissolved in ethanol (12 mL) and mixed with the TAβCD ethanol solution. The resulting binary
333
solution was stirred under heating at 55°C (10 min; Hei‐Tec Magnetic Stirrer, Heidolph Instruments,
334
Schwabach, Germany) in order to prevent TAβCD precipitation and subsequently spray‐dried (Nano
335
Spray Dryer B‐90, Büchi Labortechnik AG, Flawil, Switzerland) using a closed loop configuration,
336
under the following conditions: nitrogen flow 20 mL min−1, an inlet temperature of 55°C, an outlet
337
temperature of 60°C and 80% spraying. The obtained powder was kept in a sealed vial at 4°C and
338
protected from light until use.
339
Pure TAβCD was spray‐dried using the same method and named as processed TAβCD. A SP
340
reference sample (processed SP) was also prepared by dissolution of SP (10 mg) in ethanol (12 mL)
341
and drying under vacuum (Vacuum Oven Lab‐Line Instruments Inc., Dubuque, IL, US); SP is thermo‐
342
sensitive and undergoes degradation.
343
4.2. Preparation of PMs
344
PMs of SP and TAβCD were prepared by mixing the pristine substances (1 mg of SP with 8.5 or
345
17 mg of TAβCD for 1:1 and 1:2 SP/TAβCD PM, respectively) using a geometric dilution method by
346
continually grinding substances in a mortar and pestle.
347
4.3. Characterization of spray-dried SP/TAβCD complexes
348
Spray‐dried SP/TAβCD complexes (SD SP/TAβCD) were fully characterized in order to confirm
349
the formation of the complex and not of a PM.
350
4.3.1. Differential scanning colorimetry
351
DSC analysis was performed in a DSC 2 STARe system simultaneous thermal analyzer with
352
STARe software V13 (Mettler‐Toledo, Schwerzenbach, Switzerland) at a heating rate of 10°C min‐1 in
353
the 25–300°C temperature range under nitrogen flow of 20 mL min‐1 and using In as standard.
354
4.3.2. Fourier-transform infrared spectroscopy
355
FTIR was recorded in an Equinox 55 spectrometer (Bruker Optics Inc., Ettlingen, Germany). Each
356
sample (0.3% w/w) was thoroughly grinded with powdered KBr (Merck Chemical GmbH,
357
Darmstadt, Germany) and compressed to a pellet under pressure of 10 MPa before the analysis.
358
Spectra were obtained in the wavenumber range of 4000–500 cm‐1 with a resolution of 4 cm‐1 and 32
359
scans were performed for each spectrum.
360
4.3.3. Scanning electron microscopy
361
The surface morphology of the pure components and their binary combinations was visualized
362
by HR‐SEM (Zeiss Ultra‐Plus FEG‐SEM, Zeiss, Berkin, Germany), equipped with a high‐resolution
363
field emission gun. Samples were carbon sputtered prior to observation. The acceleration voltage was
364
2‐4 kV. Images were obtained using secondary electron detector at 3‐4 mm working distance.
365
4.3.4. Transmission electron microscopy
366
TEM was carried out in a Technai G2 T20 S‐Twin (FEI, Eindhoven, Netherlands), operated at
367
200 kV. Samples were dissolved in water, followed by placing three 10 µL drops one after the other
on a carbon grid (Formvar/Carbon 300 mesh; Electron Microscopy Sciences, Hatfield, PA, USA).
369
Samples were finally dried in a fume hood overnight before analysis.
370
4.4. Preparation of SP-loaded mPEG-PCL nanoparticles
371
4.4.1. Synthesis of mPEG-PCL copolymer
372
A mPEG‐PCL block copolymer was synthesized by a solvent‐free melt ROP of CL (5 g; Sigma‐
373
Aldrich) initiated by the terminal hydroxyl group of mPEG of molecular weight 4000 g mol‐1 (0.5 g;
374
Tokyo Chemical Industry Co. Ltd. Tokyo, Japan). The polymerization was catalyzed by SnOct (142
375
µL, 1:200 molar ratio to CL, Sigma‐Aldrich) and carried out at 145°C (2.5 h) under nitrogen
376
atmosphere (Figure S1). After the reaction, the crude mixture was cooled down to room temperature,
377
dissolved in dichloromethane (Gadot) and precipitated in an excess of diethyl ether (Bio‐Lab Ltd.,
378
Jerusalem, Israel). The precipitated mPEG‐PCL copolymer was filtered to remove remaining
379
unreacted reagents, washed several times with diethyl ether, vacuum‐dried at room temperature
380
until constant weight and stored at ‐24ºC until use. The formation of the copolymer was determined
381
by 1H‐NMR at 400 MHz utilizing a Bruker Avance III High Resolution spectrometer (Bruker BioSpin
382
GmbH, Rheinstetten, Germany). The Mn, Mw and Đ(Mw/Mn) of the copolymer were determined by
383
GPC (Alliance HPLC System, Waters Corp., Milford, MA, USA) with refractive index detector and 4
384
Styragel® HR (1‐4) columns (7.8 X 300 mm, packed with 5 µm particles, Waters Corp.). The sample
385
was prepared by dissolving mPEG‐PCL copolymer (1% w/v) in tetrahydrofuran (THF, HPLC grade,
386
Bio‐Lab) and injecting 20 L and the runs were conducted with a mobile phase flow of 1 mL min‐1, at
387
40°C. Poly(methyl methacrylate) standards (PSS polymer standards service, Mainz, Germany) with
388
molecular weights between 2,260‐171,000 g mol‐1 were used for molecular weights calibration.
389
4.4.2. Drying of SP and TAβCD with mPEG-PCL copolymer
390
SP, TAβCD and mPEG‐PCL, were dissolved in an acetone:methanol mixture (1:5 volume ratio)
391
and magnetically stirred for 1 h at room temperature. Then, solvents were evaporated in a rotary
392
evaporator (Rotavapor® R‐100, Büchi Labortechnik AG) at room temperature and the dry solid
393
mixture of SP, TAβCD and mPEG‐PCL, was re‐dissolved in anhydrous acetone. Nanoprecipitation
394
was performed as described below.
395
4.4.3. Encpasulation of free SP and SD SP/TAβCD complexes in mPEG-PCL nanoparticles by
396
nanoprecipitation
397
The encapsulation of pure SP and SD SP/TAβCD complexes in mPEG‐PCL nanoparticles was
398
performed using the nanoprecipitation method. In brief, the mPEG‐PCL copolymer and SD
399
SP/TAβCD complex (or pure SP) were dissolved in anhydrous acetone (10 mL) and the tertiary
400
copolymer solution was added dropwise to degassed deionized distilled water (50 mL) in a sealed
401
round‐bottom flask under nitrogen flow to prevent the oxidation of SP due to exposure to air using
402
a syringe pump (Laboratory Syringe Pump SYP‐01, MRC Laboratory Equipment Manufacturer, Kfar
403
Saba, Israel) at an injection rate of 0.333 mL min‐1 and under magnetic stirring (480 rpm, Hei‐Tec
404
Magnetic Stirrer). Then, the acetone was evaporated using a rotary evaporator (Rotavapor® R‐100),
405
at room temperature. The nanoparticle suspension was kept in a sealed vial at 4°C and protected
406
from light until use. The production of SP‐free mPEG‐PCL nanoparticles was carried out using the
407
same method, though without the addition of SP and the CD.
4.5. Characterization of SP-loaded nanoparticles
410
4.5.1. Size and size distribution
411
Dh and and PDI of the different nanoparticles were measured by means of DLS (Zetasizer
412
Nanoseries ZS90, Malvern Instruments, Malvern, UK).
413
414
4.5.2. SP encapsulation efficiency and drug loading
415
For quantification of %EE and DL and, free SP was separated from the nanoparticles by
416
ultrafiltration in Amicon® Ultra 15 mL Filters (MWCO 100 kDa, Merck Chemicals GmbH.). For this,
417
each sample was centrifuged at 4500×g for 15 min at room temperature and SP was quantified in the
418
filtrate fraction in a plate reader (Multiskan GO Microplate Spectrophotometer with SkanItTM
419
software, Thermo Fisher Scientific Oy, Vantaa, Finland) employing a calibration curve of SP in water
420
built in a range between 10 and 100 µg ml‐1 (R2 = 0.996).
421
4.5.3. Morphological analysis of SP-loaded nanoparticles
422
Representative samples of SP‐loaded nanoparticles were visualized by HR‐SEM (Zeiss Ultra‐
423
Plus FEG‐SEM). Samples were prepared by drop casting of 0.1% w/v nanoparticle suspension on a
424
silicon wafer (CZ polished silicon wafers; SEH Europe Ltd., West Lothian, U.K.). Samples were
425
carbon sputtered prior to analysis. The acceleration voltage was 2‐4 kV. Images were obtained using
426
secondary electron detector at 3‐4 mm working distance.
427
428
Supplementary Materials: The following are available online at www.mdpi.com/xxx/s1
429
Figure S1. Chemical structure of BH4.
430
Figure S2. UV‐Vis spectra of (a) pure BH4 and (b) pure SP solutions in water (1% w/v) at different
431
times.
432
Figure S3: Ring opening polymerization of CL initiated by the hydroxyl groups of mPEG with
433
molecular weight of 4000 g mol‐1.
434
Figure S34 1H‐NMR spectrum of the mPEG‐PCL copolymer in CDCl3.
435
Table S1: The number average molecular weight (Mn), the weight average molecular weight (Mw) and
436
the dispersity (Đ, Mw/Mn), as determined by 1H‐NMR and GPC.
437
438
Funding: This work was supported by the Niedersächsisches Ministerium für Wissenschaft und Kultur &
439
VolkswagenStiftung (Grant #88681). Partial support of the Russell Berrie Nanotechnology Institute (RBNI,
440
Technion) is acknowledged.
441
442
Conflicts of Interest: The authors declare no conflict of interest
443
444
References
445
1. Thöny, B.; Auerbach, G.; Blau, N. Tetrahydrobiopterin biosynthesis, regeneration and
446
functions. Biochem. J.2000, 347 Pt 1, 1–16.
447
2. Thöny, B. Tetrahydrobiopterin and its functions. 2004, 495–546.
448
3. Alp, N.J.; Channon, K.M. Regulation of Endothelial Nitric Oxide Synthase by
449
Tetrahydrobiopterin in Vascular Disease. Arterioscler. Thromb. Vasc. Biol.2004, 24, 413–420.
450
4. Hyland, K. Inherited Disorders Affecting Dopamine and Serotonin: Critical
451
Neurotransmitters Derived from Aromatic Amino Acids. J. Nutr.2007, 137, 1568S–1572S.
452
5. Blau, N.; Thöny, B.; Cotton, R.G.H.; Hyland, K. Disorders of tetrahydrobiopterin and related
453
biogenic amines. In The metabolic and molecular bases of inherited disease; 2001; Vol. 2, pp. 1725–
454
1776 ISBN 0079130356.
455
1988, 173, 345–351.
457
7. Sosnik, A.; Carcaboso, A.; Chiappetta, D. Polymeric Nanocarriers: New Endeavors for the
458
Optimization of the Technological Aspects of Drugs. Recent Patents Biomed. Eng.2010, 1, 43–
459
59.
460
8. Moretton, M.A.; Glisoni, R.J.; Chiappetta, D.A.; Sosnik, A. Biointerfaces Molecular
461
implications in the nanoencapsulation of the anti‐tuberculosis drug rifampicin within flower‐
462
like polymeric micelles. Colloids Surfaces B Biointerfaces2010, 79, 467–479.
463
9. Maitz, M.F. Applications of synthetic polymers in clinical medicine. Biosurface and Biotribology
464
2015, 1, 161–176.
465
10. Guo, J.; Gao, X.; Su, L.; Xia, H.; Gu, G.; Pang, Z.; Jiang, X.; Yao, L.; Chen, J.; Chen, H. Aptamer‐
466
functionalized PEG–PLGA nanoparticles for enhanced anti‐glioma drug delivery. Biomaterials
467
2011, 32, 8010–8020.
468
11. Danafar, H.; Davaran, S.; Rostamizadeh, K.; Valizadeh, H.; Hamidi, M. Biodegradable m‐
469
PEG/PCL core‐shell micelles: Preparation and characterization as a sustained release
470
formulation for curcumin. Adv. Pharm. Bull.2014, 4, 501–510.
471
12. Peng, W.; Jiang, X.; Zhu, Y.; Deng, W.; Yu, J.; Xu, X.; Zhang, W. Oral delivery of capsaicin
472
using MPEG‐PCL nanoparticles. Acta Pharmacol. Sin.2014, 36, 139–148.
473
13. Riley, T.; Govender, T.; Stolnik, S.; Xiong, C.D.; Garnett, M.C.; Illum, L.; Davis, S.S. Colloidal
474
stability and drug incorporation aspects of micellar‐like PLA‐ PEG nanoparticles. Colloids
475
Surfaces B Biointerfaces1999, 16, 147–159.
476
14. Danafar, H. MPEG–PCL copolymeric nanoparticles in drug delivery systems. Cogent Med.
477
2016, 3, 1142411.
478
15. Grossen, P.; Witzigmann, D.; Sieber, S.; Huwyler, J. PEG‐PCL‐based nanomedicines: A
479
biodegradable drug delivery system and its application. J. Control. Release2017, 260, 46–60.
480
16. Pannirselvam, M.; Simon, V.; Verma, S.; Anderson, T.; Triggle, C.R. Chronic oral
481
supplementation with sepiapterin prevents endothelial dysfunction and oxidative stress in
482
small mesenteric arteries from diabetic (db/db) mice. Br. J. Pharmacol.2003, 140, 701–706.
483
17. Massella, D.; Celasco, E.; Salaün, F.; Ferri, A.; Barresi, A.A. Overcoming the limits of flash
484
nanoprecipitation: Effective loading of hydrophilic drug into polymeric nanoparticles with
485
controlled structure. Polymers (Basel).2018, 10.
486
18. Barichello, J.M.; Morishita, M.; Takayama, K.; Nagai, T. Encapsulation of Hydrophilic and
487
Lipophilic Drugs in PLGA Nanoparticles by the Nanoprecipitation Method. Drug Dev. Ind.
488
Pharm.1999, 25, 471–476.
489
19. Londhe, A.S. and V. Inclusion Complexes of Hydroxy Propyl‐beta‐Cyclodextrin and
490
Paliperidone: Preparation and Characterization. Curr. Drug Discov. Technol. 2014, 11, 271–278.
491
20. Yang, H.; Parniak, M.A.; Isaacs, C.E.; Hillier, S.L.; Rohan, L.C. Characterization of cyclodextrin
492
inclusion complexes of the anti‐HIV non‐nucleoside reverse transcriptase inhibitor UC781.
493
AAPS J.2008, 10, 606–613.
494
21. Loftsson, T.; Ólafsdóttir, B.J.; Friðriksdóttir, H.; Jónsdóttir, S. Cyclodextrin complexation of
495
NSAIDSs: physicochemical characteristics. Eur. J. Pharm. Sci.1993, 1, 95–101.
496
22. Loftsson, T.; Hreinsdóttir, D.; Másson, M. Evaluation of cyclodextrin solubilization of drugs.
497
Int. J. Pharm.2005, 302, 18–28.
498
23. Nakanishi, K.; Masukawa, T.; Nadai, T.; Yoshii, K.; Okada, S.; Miyajima, K. Sustained release
of flufenamic acid from a drug‐triacetyl‐beta‐cyclodextrin complex. Biol. Pharm. Bull.1997, 20,
500
66–70.
501
24. Fernandes, C.M.; Veiga, F.J.B. Effect of the hydrophobic nature of triacetyl‐beta‐cyclodextrin
502
on the complexation with nicardipine hydrochloride: physicochemical and dissolution
503
properties of the kneaded and spray‐dried complexes. Chem. Pharm. Bull. (Tokyo).2002, 50,
504
1597–1602.
505
25. Fernandes, C.M.; Ramos, P.; Jose, F. Hydrophilic and hydrophobic cyclodextrins in a new
506
sustained release oral formulation of nicardipine : in vitro evaluation and bioavailability
507
studies in rabbits. 2003, 88, 127–134.
508
26. Corti, G.; Capasso, G.; Maestrelli, F.; Cirri, M.; Mura, P. Physical – chemical characterization
509
of binary systems of metformin hydrochloride with triacetyl‐ ‐cyclodextrin. 2007, 45, 480–
510
486.
511
27. Nunes, A.V.M.; Almeida, A.P.C.; Marques, S.R.; Sousa, A.R.S. De; Casimiro, T.; Duarte,
512
C.M.M. Processing triacetyl‐β‐cyclodextrin in the liquid phase using supercritical CO2. J.
513
Supercrit. Fluids2010, 54, 357–361.
514
28. Bratu, I.; Veiga, F.; Fernandes, C.; Hernanz, A.; Gavira, J.M. Infrared spectroscopic study of
515
triacetyl‐β‐cyclodextrin and its inclusion complex with nicardipine. Spectroscopy2004, 18, 459–
516
467.
517
29. Ghorab, M.K.; Adeyeye, M.C. Enhancement of Ibuprofen Dissolution via Wet Granulation
518
with β‐Cyclodextrin. Pharm. Dev. Technol.2001, 6, 305–314.
519
30. Carneiro, S.B.; Duarte, F.Í.C.; Heimfarth, L.; Quintans, J.D.S.S.; Quintans‐Júnior, L.J.; Júnior,
520
V.F.D.V.; De Lima, Á.A.N. Cyclodextrin‐drug inclusion complexes: In vivo and in vitro
521
approaches. Int. J. Mol. Sci.2019, 20, 1–23.
522
31. Bettinetti, G.; Sorrenti, M.; Catenacci, L.; Ferrari, F.; Rossi, S. Polymorphism,
523
pseudopolymorphism, and amorphism of peracetylated α‐, β‐, and γ‐cyclodextrins. J. Pharm.
524
Biomed. Anal.2006, 41, 1205–1211.
525
32. Sami, F.; Philip, B.; Pathak, K. Effect of auxiliary substances on complexation efficiency and
526
intrinsic dissolution rate of gemfibrozil‐beta‐CD complexes. AAPS PharmSciTech2009, 11, 27–
527
35.
528
33. Dollo, G.; Le Corre, P.; Chollet, M.; Chevanne, F.; Bertault, M.; Burgot, J.L.; Le Verge, R.
529
Improvement in solubility and dissolution rate of 1,2‐dithiole‐3‐thiones upon complexation
530
with β‐cyclodextrin and its hydroxypropyl and sulfobutyl ether‐7 derivatives. J. Pharm. Sci.
531
1999, 88, 889–895.
532
34. Sapte, S.; Pore, Y. Inclusion complexes of cefuroxime axetil with β‐cyclodextrin:
533
Physicochemical characterization, molecular modeling and effect of l‐arginine on
534
complexation. J. Pharm. Anal.2016, 6, 300–306.