
Integral Field Spectroscopy
Observations of SN 1987A
Karina Edna Herum Kjær
Integral Field Spectroscopy
Observations of SN 1987A
DISSERTATION
der Fakult¨at f¨ur Physik der Ludwig-Maximilians-Universit¨at M¨unchen
zur Erlangung des Grades
Doktor der Naturwissenschaften
Dr. rer. nat.
vorgelegt von
Karina Edna Herum Kjær
aus
Ballerup, D¨anemark
Abstract
This thesis is an observational study of the spectacular supernova 1987A in the near infrared (1-2.5 µm) in the Large Magellanic Cloud. The two epochs of data presented are from 17 and 18 years after explosion and we thus observe the supernova shock interacting with the pre-explosion circumstellar ring. The observations were done with an integral field spectrograph (SINFONI) mounted on the Very Large Telescope (VLT). These observations are the first of their kind for SN 1987A and they allowed me to establish the kinematics for the ring and ejecta separately.
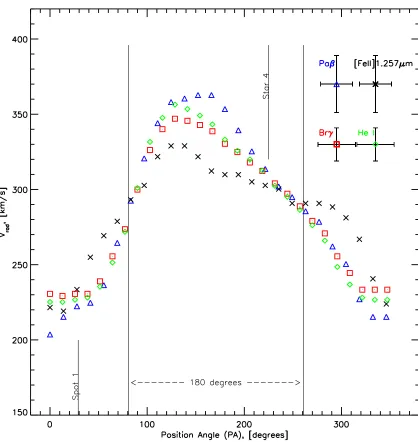
With the ring kinematics I was able to find ’nodal points’, where the ring intersects the plane of the sky, and from that I deduced that the ring is not only tilted with respect to the plane of the sky, but also has a rotation in the plane of the sky of 9◦. This has never been done before for SN 1987A (or any other supernova) and the result confirms what had been suspected from imaging and modelling of the nebula structure around SN 1987A (Sugerman et al. 2005).
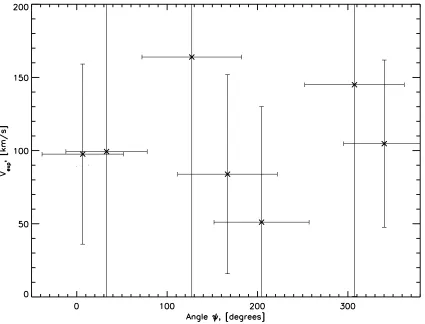
From the kinematics I derived an expansion velocity of the shocked gas component radially outward in the ring. I identified a vacant section of the circumstellar ring (in HST images at position angle∼ 307◦) with a larger expansion velocity of the shocked cooling gas, consistent
with the vacant region having a lower density than the rest of the ring.
The kinematics reveal that the ejecta’s elongated emission structure is bipolar in its velocity, in that the North part is blue shifted and the South part red shifted. I derived upper and lower bounds for the inclination angle of the ejecta and find it not to be perpendicular to the ring as was commonly expected. This challenges the current believes about the symmetry axis of SN 1987A and it cannot be explained by any of the existing models for SN 1987A. I propose 3 possible scenarios: (1) The observed emission originates from a very thick disk situated in the ring. (2) The explosion caused the SN outflow to be not along the rotation axis of the progenitor. (3) The progenitor rotation axis was not aligned with the axis of the 3 rings.
Zusammenfassung
Diese Dissertation beinhaltet eine Studie der spektakul¨aren Supernova 1987A in der Großen Magellanschen Wolke, auf der Grundlage von Beobachtungen im nahen infrarot (1-2.5 µm). Ich pr¨asentiere Daten aus zwei Epochen, 17 und 18 Jahre nach der Supernovaexplosion. Dies bedeutet, dass wir den Supernovaschock mit dem zirkumstellaren Ring wechselwirken sehen. Der Ring entstand schon vor der Explosion. Die Beobachtungen wurden mit einem Fl¨achen-Spektrographen (SINFONI) am Very Large Telescope (VLT) gemacht. Sie sind die ersten ihrer Art von SN 1987A, und aus ihnen konnte ich die Kinematik des Rings und des Supernovama-terials zum ersten Mal getrennt voneinander ableiten.
Mit der Ringkinematik war es mir m¨oglich die Knotenlinie zu finden, an denen der Ring die Himmelsebene schneidet. Daraus folgerte ich, dass der Ring nicht nur gegen¨uber der Him-melsebene gekippt, sondern auch mit einem Winkel von 9◦ in der Himmelsebene gedreht ist.
Diese Analyse wurde bisher noch nicht auf SN 1987A (oder andere Supernovae) angewendet. Die Ergebnisse best¨atigen die Vermutungen aus Bildanalysen und der Modellierung der Nebel-struktur von SN 1987A (Sugerman et al. 2005).
Aus der Kinematik leitete ich die Expansionsgeschwindigkeit der geschockten Gaskomponente ab, die sich radial im Ring nach aussen ausdehnt. Ich identifizierte einen freien Abschnitt im zirkumstellaren Ring (in HST Bildern, Positionswinkel∼307◦) mit einer h¨oheren
Expansions-geschwindigkeit des geschockten abk¨uhlenden Gases. Dies stimmt damit ¨uberein, dass die freie Region eine niedrigere Materiedichte aufweist, als der Rest des Rings.
Die Kinematik zeigt, dass die gestreckte Emissionsstruktur des Supernovaausw¨urfes in ihrer Geschwindigkeit bipolar ist. Der n¨ordliche Teil ist blauverschoben, der s¨udliche Teil ist rotver-schoben. Ich leitete obere und untere Grenzen f¨ur den Inklinationswinkel der Ausw¨urfe ab, und entgegengesetzt der allgemeinen Erwartungen ist dieser nicht rechtwinklig zum Ring. Dies stellt die g¨angigen Vorstellungen ¨uber die Symmetrieachse von SN 1987A in Frage, und es kann auch nicht durch existierende Modelle von SN 1987A erkl¨art werden. Ich schlage drei m¨ogliche Szenarien vor: (1) Die beobachtete Emission stammt von einer sehr dicken Scheibe, die sich im Ring befindet. (2) Die Explosion verursachte eine Abweichung der Auswurfrichtung von der Rotationsachse des Vorl¨aufers. (3) Die Rotationsachse des Vorl¨aufers stimmt nicht mit der Achse der drei Ringe ¨uberein.
Contents
1 Introduction 1
1.1 History of SN 1987A . . . 2
1.2 The Supernova at Twenty . . . 10
1.3 Emission structure . . . 13
1.4 This Thesis . . . 16
2 SINFONI: Instrument, Pipeline, and Methodology 19 2.1 Instrument . . . 19
2.2 The Pipeline . . . 22
2.3 Terminology and Methodology . . . 23
2.4 Adaptive Voronoi 2D-Binning . . . 24
3 Data Reduction and Calibration 27 3.1 Epoch 2004 . . . 27
3.2 Epoch 2005 . . . 30
4 Data Analysis 37 4.1 Epoch 2004 . . . 37
4.2 Epoch 2005 . . . 43
4.3 Spectral Comparison . . . 47
5 The Inner Circumstellar Ring 53 5.1 Epoch 2004 . . . 53
5.2 Epoch 2005 . . . 60
5.3 Evolution . . . 65
5.3.1 Radial Velocity Changes . . . 65
5.3.2 Temporal Flux Variations . . . 67
5.4 Comparison with HST and NACO . . . 70
5.5 Results Derived for the Ring . . . 74
6 The Ejecta 77 6.1 Epoch 2004 . . . 77
6.2 Epoch 2005 . . . 80
6.2.1 The Ejecta Spectrum . . . 80
6.2.2 Velocity Distribution of the Ejecta . . . 82
6.2.4 Geometry and Kinematics of the Ejecta . . . 87
6.3 Ejecta Summary . . . 93
7 Summary 95 7.1 The Ring . . . 95
7.2 The Ejecta . . . 96
7.3 The Future . . . 97
7.4 The Uniqueness of this Work . . . 98
Chapter 1
Introduction
Figure 1.1: SN 1987A with its triple rings in the visual. North is up and East is to the left as on all images in this thesis. The unique supernova SN 1987A has been a
bo-nanza for astrophysicists (see Figure 1.1 for a Hub-ble Space Telescope (HST) picture of SN 1987A and its triple ring system). It provided several ob-servational firsts, like the detection of neutrinos from the core collapse, the observation of the progeni-tor star on archival photographic plates, the signa-tures of a non-spherical explosion and mixing in the ejecta, the direct observation of supernova nu-cleosynthesis, including accurate masses of nickel and titanium, observation of the formation of dust in the supernova, as well as the detection of cir-cumstellar and interstellar material. Now, after 20 years, it continues to be an extremely exciting ob-ject as we are able to observe the supernova shock interacting with the circumstellar ring in real time, and we are able to resolve the expanding debris for the first time.
With its location in the Large Magellanic Cloud (LMC, a dwarf companion galaxy to our own Milky Way) SN 1987A is the most spectacular stellar object outside our own galaxy. It is the extra-solar object for which we have the most detailed information, but also the object where we have the largest amount of mysterious unexplained things happening (i.e. the mystery spot, the asymmetries, missing remnant etc.). This contrast arises because with the large amount of information we can no longer assume the ideal simple (e.g. spherical) case, and as the detailed knowledge grows so does the complexity of physics we observe.
I will in this chapter1 give a background of the observational history, in order to understand the place this work takes as the next step towards an understanding of SN 1987A.
1.1
History of SN 1987A
When the first signs of Supernova 1987A, the first supernova of the year 1987, were noticed early on 24 February 1987, it was clear that this would be an unusual event. It was discovered by naked eye and on a panoramic photographic plate taken with a 10-inch astrograph on Las Campanas in Chile by Oscar Duhalde and Ian Shelton, respectively. Even before this new supernova was observed, SN 1987A placed itself in history as being the first object, besides the Sun, from which neutrinos have been received.
Neutrino Burst
A few hours earlier, still on 23 February, three large underground proton-decay detectors reg-istered the passage of high-energy neutrinos. ”Kamiokande II” is a neutrino telescope whose heart is a huge cylindrical tub, 52 feet in diameter and 53 feet high, containing about 3000 metric tons of water; it is located in the Kamioka mine in Japan, 3,300 feet underground. On Febru-ary 23, around 7:36 am Greenwich time, the Kamiokande II recorded the arrival of 8 neutrinos within an interval of 2 seconds, followed by 3 more neutrinos 9 to 13 seconds later. Simulta-neously, the same event was revealed by the IMB detector (located in the Morton-Thiokol salt mine near Faiport, Ohio), which counted 8 neutrinos within about 6 seconds. A third neutrino telescope (the ”Baksan” telescope, located in the North Caucasus Mountains of Russia, under Mount Andyrchi) also recorded2 the arrival of 5 neutrinos within 5 seconds from each other.
Unlike the optical detections the localisation of the source was not so easy for the total of 24 neutrinos detected within about 13 seconds. Since SN 1987A exploded in the Large Magellanic Cloud (LMC), the detectors, all located on the northern hemisphere, measured the neutrinos af-ter passage through the Earth. In recognition for this first detection of neutrinos from a celestial object other than the Sun Masatoshi Koshiba was awarded the Nobel Prize of 2002 (shared with Riccardo Giacconi for X-ray astronomy and Raymond Davis Jr. for solar neutrinos).
The most important implication of the neutrinos was that it confirmed the hydrodynamic core collapse, releasing about 3x1053 ergs of gravitational energy, mainly in neutrinos of all kinds
(due to the process: e−+p → n + ν). This confirmed the predictions by Colgate, Arnett and others from the 1960s. Among many other results the few neutrinos showed that the electron-neutrino mass has to be rather small (mνe ≤20 eV, superseded in the meantime by direct
experi-ments) as no time-delay between different neutrino energies could be measured3. Also, the fact that there is no structure in the neutrino burst indicates that they came from the collapse to the neutron star, but no further collapse to a black hole occurred. At the same time these neutrinos
2The Baksan data has been largely ignored, perhaps because no methodology existed that could consistently
account for the relatively large background rate in the Baksan detector. Loredo & Lamb (2002) demonstrate that the Baksan data are fully consistent with the KII and IMB data.
3A nonzero neutrino mass will cause particles of different energies to arrive at different times, even if they are
gave an unprecedented accuracy of better than a minute (the reason the accuracy is not better had to do with the time keeping at the neutrino detectors) for the time of explosion, which opti-cal observations cannot provide as the photons emerge from the shock breakout on the surface of the exploding star, which can occur several hours later. The neutrinos were the direct signal from the collapse of the core of the progenitor star (Sanduleak -69o202) to a neutron star. Although the actual neutrino count was only 24, it was a significant rise from the previously-observed background level. This was the first time neutrinos emitted from a supernova had been observed directly, and the observations were consistent with theoretical supernova models in which 99% of the energy of the collapse is radiated away in neutrinos. The observations are also consistent with the models’ estimates of a total neutrino count of 1058 with a total energy
of 1046 joules. It is believed that a small fraction of these neutrinos revived the stalled shock and powered the great explosion of the star. By heating and expanding the star and triggering a new flurry of nuclear reactions in its layered interior, the revived shock was responsible for the supernova’s optical display. The effect was delayed by about two hours however: the shock had to traverse the entire star before any light leaked out. The neutrinos from the collapsing core easily out raced the shock. Passing through the rest of the star very close to the speed of light, they were the first signal to leave the supernova.
One highly significant result was obtained from the data regarding gravity. It appeared that the neutrinos and antineutrinos both took the same amount of time to arrive at earth, about 168,000 years. The difference in their arrival times was less than 13 seconds. This was the first empirical evidence that matter, antimatter, and photons all react similarly to gravity, which had been widely predicted by standard theories of gravity but had not been previously shown from direct empirical data.
Progenitor
Soon after the event was recorded, the progenitor star was identified as Sanduleak -69◦ 202, a
blue supergiant (spectral type B3, Arnett et al. 1989) with a relatively modest mass. This was an unexpected identification, because at the time a blue supergiant was not considered a possi-bility for a supernova event in existing models of high mass stellar evolution. Instead everyone expected that the exploding star would be a red supergiant. For a time astronomers thought that Sk -69◦ 202 might be just a foreground star, and that a red supergiant lurked behind it. But the two-hour delay between neutrino detection and the optical outburst was consistent with the relatively small radius appropriate to a B star.
Current understanding is that the progenitor was a binary system, the stars of which merged about 20,000 years before the explosion, producing a blue supergiant (Podsiadlowski et al. 1990). Difficulties persist with this interpretation, however.
The Light Curve
reddest supernova ever observed. The reason for this was that the supernova was discovered so early that the early cooling phase, when the supernova ejecta cool down from the shock pas-sage, could be observed. But SN 1987A did not become as luminous as expected. The compact nature of the blue supergiant meant that the adiabatic cooling was stronger producing a fainter object than usual, as traced by Arnett et al. (1989).
About four weeks after explosion the supernova light curve was powered by the radioactive de-cay of freshly synthesised56Ni. Unlike for any supernova before, it was possible to construct a
bolometric light curve of SN 1987A, which was extremely useful for the physical interpretation of the event. The absence of a significant plateau phase was understood in the context of the nature of the progenitor star and the extent to which the ejecta of the supernova were mixed. It turned out that helium was mixed into the hydrogen layer and hydrogen further down into the ejecta. This was also apparent from the early appearance of X-rays, originating from the56Co
decay. Further confirmation for the strong mixing of the layers in SN 1987A came from the line shapes of the infrared lines. The old models of spherical explosions had to be revised and the density inhomogeneities in the stellar structure were recognised as responsible for turbulent mixing when the shock moved across such boundaries.
Still just 4 weeks old the supernova came with the next surprise, which was a ’mystery’ spot close to the supernova. This spot was independently found by high-spatial resolution observa-tions with speckle cameras at the Anglo-Australian Telescope (AAT, Marcher et al. 1987) and the Cerro Tololo Inter-American Observatory (CTIO, Karovska et al. 1987) 4m telescopes. The nature of this phenomenon remains unclear, but it was a clear indication of a broken symmetry. The asymmetry was also detected in polarisation observations of SN 1987A.
The spectroscopic evolution provided further evidence for asymmetries in the explosion. The Bochum event is a rapid change in the P-Cygni profile of the Hαline observed with the Bochum telescope on La Silla. It is the signature of a radioactive blob rising from the inner ejecta to the surface (beginning March 14th, see Hanuschik & Dachs 1987; Hanuschik 1988, for details). The picture emerging from the observations of the first several weeks was certainly more com-plex than what had been assumed of supernovae ever before.
Once SN 1987A entered the radioactive decline one could have expected that it would become less exciting. Far from it! International Ultraviolet Explorer (IUE) observations started to ob-serve an increase in flux of several high-excitation lines4, like NV, NIV], N III], CV, CIII], He II, mirrored by similar behaviour of [O III] and Hαin the optical at about 80 days after explosion. These lines could not possibly come from the fast moving ejecta and were quickly recognised as originating from material outside the supernova ionised by the soft X-rays from the shock breakout. From the high ionisation of these lines a temperature of∼106K at the shock breakout
could be inferred. The circumstellar material had to be from the progenitor star itself due to
4The nomenclature here is, that NIV is nitrogen ionised 4-1=3 times. Square brackets denotes forbidden
the high nitrogen to carbon ratio, indicating CNO5 processing (Fransson & Lundqvist 1989).
This was, of course, emission from the inner circumstellar ring around SN 1987A, which was first imaged with the New Technology Telescope (NTT, Wampler & Richichi 1989). Later HST images provided the linear dimensions of the ring. In combination with the rise time for the nar-row circumstellar lines, this provided a purely geometric distance to SN 1987A (Panagia et al. 1991). With the Large Magellanic Cloud being the first rung in the distance ladder to determine the Hubble constant, SN 1987A provided a very solid stepping stone.
Radioactivity and Dust
Just at about the same time as the appearance of the UV lines the supernova ejecta were pre-senting another surprise. Infrared spectroscopy about 100 days after explosion showed CO and SiO molecules at substantial masses (about 10−3 M⊙). The presence of the molecules within
the ejecta was difficult to explain. The formation of molecules required that they be protected from the UV and X-rays in the harsh environment of the ejecta. This also contrasted with the observations of the characteristicγ-rays at 847 keV and 1.238 MeV from the56Co decay, ob-served with KVANT on MIR. The characteristic decay lines could be obob-served for the first time ever in a supernova confirming the radioactive energy source. The X-rays are from Compton scattering of theγ-ray rays and their emission peaked after about 200 days and slowly declined thereafter as the number of56Co nuclei decayed away. The presence of molecules was a clear
sign that there were regions in SN 1987A which could cool down significantly, while at the same time the radioactive material from the core had to be transported towards the surface to become observable.
Infrared wavelengths gained in importance as more and more radiation was emitted at longer wavelengths. The bolometric light curve very quickly started to become dominated by long-wavelength radiation and the inclusion of this spectral range became more and more important. ESO and CTIO collaborated for several years in providing this vital ingredient to measure the bolometric light curve. The decline of the light curve remained constant at the rate of the decay of 56 Co and allowed to measure the mass of 56Ni (0.07 M
⊙) produced in the explosion. The
Ni→ Co→ Fe decay chain could be observed directly in the changing line ratios of the near-infrared Co and Fe lines. The bolometric light curve was also the first indicator that something else was happening about 500 days after explosion. The light curve started to drop below the ex-pected decline rate due to dust formation in the ejecta. At the same time the near-infrared [Fe II] lines dropped dramatically as the ejecta cooled below the temperature to excite these lines, a signature of the infrared catastrophe predicted by modellers (Spyromilio & Graham 1992).
Macroscopic dust grains which partially covered the ejecta and hence blocked some of the light had formed. The radiation was absorbed in the optical spectrum and shifted to the far infrared, where it was detected by the Kuiper airborne observatory (Larson et al. 1987). Line shifts towards shorter wavelengths of the infrared emission lines coming from the ejecta were a signature of the same phenomenon. Again, the explanation was that the distant part of the object is blocked by intervening dust (Lucy et al. 1991).
5The CNO cycle (for carbon-nitrogen-oxygen) is one of two fusion reactions by which stars convert hydrogen
The light curve had one more unexpected deviation in store. After about 1200 days the decline started to slow down. First interpretations were that the slower decays of57Co were starting to
dominate the light curve, but this would have required unreasonably high isotope ratios, which were inconsistent with the expected nucleosynthetic yields or the known abundances and it was also incompatible with the observed decline of the infrared Co lines compared to the Fe line, which allowed to deduce the amount of 57Co. The explanation here was that the time scale
for recombination and cooling in the supernova envelope became comparable to the expansion time scale, i.e. some of the ’stored’ energy was finally released. This was termed ’freeze-out’ as the ejecta no longer were in thermal equilibrium and detailed time-dependent calculations had to be performed. The light curve did flatten later because of the57Co (0.001 M⊙) and by
now is powered mostly by44Ti ( 10−4M
⊙) (Fransson & Kozma 2002). The56Ni,57Co, and the
44Ti radioactive isotopes all formed during the first seconds of the explosion and the masses of
these together contribute some very strong constraints on the explosion models. Besides the determination of the radioactive isotopes also the masses of the most abundant elements formed in the progenitor star and in the explosion could be determined. This included such impor-tant elements as carbon, nitrogen, oxygen, manganese and silicon. For the first time one could determine reliable masses of these elements directly.
The Circumstellar Material
As mentioned, it was known from the ionised high-excitation lines that SN 1987A was sur-rounded by pre explosion material, expelled by the star during its evolution. Narrow-band imaging with the NTT about three years after the explosion revealed a circumstellar structure around SN 1987A, which resembled the triangular hat, which Napoleon would have worn. It was baptised ’Napoleon’s hat’ and the image provided the first opportunity for a 3-dimensional view of SN 1987A. This image together with the detection of extended narrow emission from the He I 1083 nm line and the IUE observations of the circumstellar gas was a first indication that there was more to come with this supernova. HST revealed first the inner ring and then later confirmed the outer rings (Fig. 1.1). The NTT was used to measure the density and other properties of the outer rings (Wampler et al. 1990). The HST images also showed the fading supernova ejecta in the middle. The ring on the other hand had been fading extremely slowly and hence after about ten years it started to outshine the ejecta. The circular ring is inclined by about 43o with the northern part closer to us. It is essentially stationary with an expansion velocity of about 10 kms−1(Gr¨oningsson et al. 2006).
Several light echoes, the integrated light from the peak phase reflected off interstellar sheets between the supernova and us, have been observed over the years around the supernova. They have been monitored with several telescopes and have been used to map the interstellar material in the LMC near the supernova.
The Crash
The first 10 years the supernova radiation was dominated by energy deposited in the interior by the decay of newly synthesised radioisotopes. Many wavelength observations yielded knowl-edge about dynamics and thermodynamics of the expanding debris. At around age of 9 years the supernova blast wave struck the inner circumstellar ring. Radio, infrared, optical and X-ray radiation changed to be dominated by the impact of the supernova debris with the circumstellar material. This transition marks the birth of a supernova remnant.
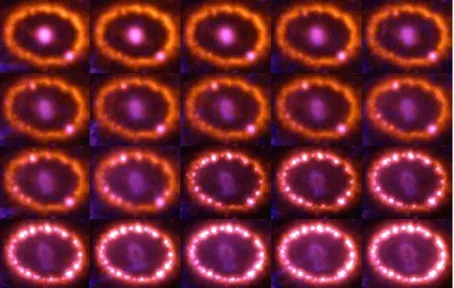
The prediction that the stationary ring would be reached by the supernova shock was made early on, but the exact date was debated. The radio flux of SN 1987A, -after an initial short emission of a few weeks, started to increase again after about 1200 days (Manchester et al. 2002). This brightening has continued since then and was the first signal of the interaction of the supernova shock with the circumstellar environment. Similarly, the X-ray flux started to increase, and has continued to increase almost exponentially (Park et al. 2006; Haberl et al. 2006). Finally, after 10 years a spot of optical emission appeared toward the North-East of the ring. And again this was a surprise: rather than having the shock reach a smooth ring more or less simultaneously, the ring appears to be more like spokes on a wheel with inward intrusions. Also, the expan-sion of the supernova shock may be not uniform and faster in some directions than others. The asymmetries in the explosion could be reflected in this interaction as well. Over the past few years the ring has continued to be lit up in various places and now resembles a pearl necklace (Fig. 1.3). The interaction is now observable at all wavelengths from the X-rays (Chandra and XMM), the optical and infrared (all major southern observatories VLT and Gemini, HST), as well as the far infrared (Spitzer) and radio (Australia Telescope Compact Array, -ATCA), and a rich data set is being assembled. We show in chapter 5 new infrared observations of the gas shocked by the ejecta ring interaction, with spectra from different positions around the ring.
The Ejecta
As already described in section 1.1 extensive early observations proved that the ejecta are as-pherical. This is deduced from (i) the ’Bochum event’, -basically radioactive blob rising from the inner ejecta to the surface, (ii) the spectropolarimetry, -which implied that the ejecta have a single well defined axis of symmetry, and (iii) the appearance of the mystery spot as secondary source offcenter from the bulk of the ejecta.
It is also known that the debris has a heterogeneous composition. The early emergence of gamma rays from SN 1987A showed that some of the newly synthesised 56Co (and probably
also clumps of oxygen and other elements) were mixed fairly far out into the supernova enve-lope by instabilities following the explosion (McCray 1993).
The ejecta was also observed in radio as an expanding annulus with a radial outward velocity of
electrons accelerated by shocks formed inside the inner ring where the supernova debris struck relatively low density circumstellar material.
1.2
The Supernova at Twenty
Now the supernova emission is dominated by the shock interaction, although we still detect faint emission from the ejecta. This section will provide an overview of the most recent observations of SN 1987A. Parts of this section has previously been published in Kjær et al. (2007a).
At optical/near-IR wavelengths we can now distinguish four emission sites in SN 1987A: (1) the ejecta in the centre with a typical velocity structure of 3000 km s−1, (2) the unshocked fluoresc-ing rfluoresc-ing material with 10 km s−1, (3) the shocked material in the ring, visible in the hot spots
and with velocities of about 300-500 km s−1, (4) the reverse shock moving back into the
su-pernova ejecta with a velocity of up to 15000 km s−1. Figure 1.4 shows a spectrum around the Hαline observed with the Ultraviolet and Visual Echelle Spectrograph (UVES on the VLT Gr¨oningsson et al. 2006) in 2002. Three different components can clearly be distinguished in the spectrum: the narrow lines, the broader lines, and the very wide component from the reverse shock.
Coronal emission from the shocked circumstellar ring
Figure 1.4 also shows the detection of a coronal line (emission from a highly excited element), and Gr¨oningsson et al. (2006) report on several such detections (e.g. [Fe XI],[Fe XIV]). A com-parison of the evolution of the line fluxes for the coronal lines and the X-ray emission reveals an interesting correlation. The line fluxes of the coronal Fe lines increased exactly like the soft X-ray (0.5–2 keV) emission as measured by the Chandra satellite (Park et al. 2005), see Fig. 1.5. This, together with similar shock velocities required to produce the coronal lines, led Gr¨oningsson et al. (2006) to argue that the coronal lines form in the same region as the soft X-rays. The coronal lines therefore offer a complementary view to the X-rays of the shock interaction. In this respect the high resolution spectrum of Chandra (Zhekov et al. 2005) is es-pecially interesting, showing lines from, e.g., Fe XVII. Several of these lines are coming from highly ionised atoms, in particular [Fe X], [Fe XI], [Fe XIV], [Ne V] and [Ar V]. These arise in the collisionally ionised gas behind the shock propagating into the dense protrusions of the ring. Gr¨oningsson et al. (2006) presented a detailed analysis of the coronal lines and derived the temperature required for their formation. The gas must be heated to about 2·106 K,
corre-sponding to a shock velocity of∼ 350 km s−1. The fact that also lines of low ionisation ions, like OI-III and Fe II, are seen shows that most of the emission is coming from radiative shocks. However, it cannot be excluded that some of the emission in the coronal lines of FeX–XIV arise from shocks which have not had time to cool yet.
In addition, the X-rays show evidence of shocked gas with a temperature of≥108K, which has
not had time to cool down enough to be seen in the optical (Zhekov et al. 2006).
Figure 1.4: The spectral region around Hαfor SN 1987A 5704 days after explosion as observed with UVES (Gr¨oningsson et al. 2006). The velocity scale is centred on Hα. Note the very broad component originating in the reverse shock, extending to∼ 15,000 km s−1. Superimposed on this are the narrow (FWHM ∼ 10 km s−1) and intermediate (FWHM ∼ 300 km s−1) velocity
5000 5500 6000 6500 7000 0 1 2 3 4
Normalized flux
Days after explosion
[Fe X] λ6375[Fe XI] λ7892 [Fe XIV] λ5303
5000 5500 6000 6500 7000 0
1 2 3
4 X−ray (0.5−2 keV)
Figure 1.5: Flux evolution of the coronal lines as measured in optical spectroscopy (left) and the flux increase of the X-ray emission from SN 1987A (Park et al. 2005). The fluxes have been normalised to the ones observed in October 2002 (see Gr¨oningsson et al. 2006, for more details).
production of non-thermal electrons, and probably also cosmic rays, in the shock.
The soft X-rays are traced by the infrared (IR) emission. The infrared emission show a brighten-ing of the lines from the coolbrighten-ing, shocked gas component (Kjær et al. 2007b), when compared to the older IR spectra. The optical and UV observations of this component corresponds neatly with the IR presented in this thesis.
In the mid infrared hot dust emission has been seen by Spitzer (an infrared space telescope), as well as by VISIR (VLT Imager and Spectrometer for mid Infrared an instrument on the Very Large Telescope (VLT)) and T-ReCS (Thermal Region Camera and Spectrograph) on Gemini observatory (Bouchet et al. 2006).
The reverse shock
The UVES spectra clearly show a broad Hα line extending to ∼ 15,000 km s−1 (Fig. 1.4).
This velocity component is called the reverse shock and is discussed in detail by Michael et al. (2002); Smith et al. (2005); Heng et al. (2006).
The expanding ejecta comprising mostly of neutral hydrogen, which has been adiabatically expanding and thus cooling, crosses the reverse shock at∼12000−15000 km s−1. The excitation
the reverse shock reaches it and the Hαemission from the reverse shock may stop (Smith et al. 2005; Heng et al. 2006; Heng 2007).
The ejecta and the remnant
The supernova ejecta themselves are now difficult to observe due to their faintness and the in-creasing brightness of the inner ring. The ejecta emission is now dominated by energy input from the radioactively excited core, i.e. 44Ti (Fransson & Kozma 2002; Bouchet et al. 2004,
2006). The evolution of the shape and size of the ejecta of SN 1987A has been analysed by Jansen & Jakobsen (2001) based on HST images and spectra from day 1278 (3.5 years) to day 4336 (∼12 years) since the explosion. They report the shape of the ejecta changing from spher-ical to elongated, as can be seen in Figure 1.3.
The compact remnant in the centre has so far remained elusive. The neutrinos indicate that such a compact object should exist, but it remains deeply embedded in the ejecta. The very low limits to both the optical (Graves et al. 2005) and X-ray luminosity (Park et al. 2006) may be explained by either gas or dust absorption. In this case, however, the radiation should emerge in some waveband, possibly the far-IR. Other possibilities to explain the apparent absence of a neutron star include a weak magnetic field, slow rotation6or that a black hole may have formed, possibly as a result of fall-back of material onto the new-born neutron star.
The Future
SN 1987A was full of surprises and it remains unique amongst the known supernovae. Not only was it the closest supernova for several centuries, it was also a very peculiar one coming from a blue supergiant progenitor, with a circumstellar environment unlike any other supernova known.
It is clear that with the kinematic information we will be able to further investigate the evolution of the supernova shock as it envelopes the circumstellar ring in the coming years.
SN 1987A represents a fascinating laboratory to study how a supernova interacts with its sur-rounding. The coming years will provide exciting times and SN 1987A will remain the focus of observations with many telescopes. The destruction of the inner ring will take many years and maybe it will hold a clue to its origin. The X-rays may also help illuminating any mate-rial outside the ionised ring from a possible red supergiant stage. The circumstellar ring of SN 1987A will be a bright source at all wavelengths for several years. We will continue to watch its evolution towards a supernova remnant.
1.3
Emission structure
After nearly two decades at least five emission mechanisms can be found in SN 1987A. The ejecta continue to glow as a result of the radioactive decay of long-lived nuclei (mostly44Ti),
but they are fading continuously because of the expansion and the reduced opacity. The nearly
6The energy radiated away in the magnetic dipole model is ˙E∝B2Ω4, where B is the magnitude of the surface
stationary rings around SN 1987A are still fluorescing from the recombination of matter origi-nally excited by the soft X-ray emission from the shock breakout at explosion of the supernova. The supernova shock reached the inner circumstellar ring about ten years ago and the forward shock is moving through the inner ring and leaves shocked material behind. This material is excited and accelerated. The reverse shock illuminates the fast-moving supernova ejecta as it catches up. And, finally light echoes in nearby interstellar matter can still be observed.
Figure 1.6 shows an illustration that summarises the different emission sites. The equatorial ring (red) is shown as a diffuse gas with inward protrusions, marked here as ’hot fingers’ (white) as they are engaged by the forward shock wave (bright yellow). In between the forward shock wave and the reverse shock wave (dark yellow) the hot gas resides (yellow). In the interior the cool ejecta (blue) resides.
The different emission mechanisms are explained in detail in the following.
Ejecta Emission
The ejecta emission is now dominated by energy input from the radioactively excited core, i.e.
44Ti (Fransson & Kozma 2002; Bouchet et al. 2004, 2006). The emission lines originating in or
near the ejecta are excited by this emission, and will most probably outline the titanium clumps. It is becoming clear that the supernova ejecta is deviating strongly from a spherical distribution (Wang et al. 2002). We show in chapter 6 new observations of the ejecta, in which the ejecta are spatially and spectrally resolved for the first time revealing their kinematics.
The freely-streaming debris has a unique velocity for a given radial distance from the SN core, exactly analogous to Hubble flow in an expanding universe. At the reverse shock this freely-streaming material is decelerated by the shock, and from this radius and further away from the SN core the velocities are governed by the shock.
Shock Emission
As supernova 1987A’s outer envelope expands into its surrounding circumstellar material a dou-ble shock structure forms (Chevalier 1982), consisting of a forward shock (the blast wave) that propagates into the circumstellar gas (∼ 4000−5000 km s−1), and a reverse shock that prop-agates outwards still but at a slower pace (∼ 3000−4000 km s−1), allowing the SN debris to
overtake it (debris∼ 12000−15000 km s−1). In between a contact discontinuity separates the
shocked circumstellar material and the shocked debris. Pun et al. (2002) gives a very thorough description of a double-shock structure in SNR-SN 1987A, see Figure 1.7, which shows the schematics for just spot 1.
The shock is caused by the impact of the supernova blast wave with a dense inward protrusion of the ring (Michael et al. 2000). When the blast wave overtakes such an obstacle, slower shocks are transmitted into it. Since a range of densities are present in the ring, it is expected that the transmitted shocks have a range of velocities.
The forward shock is the forefront of the blast wave propagating with a velocity ∼ 4000-5000 km s−1. When it hits an obstacle it will result in transmitted shocks in that obstacle,
Figure 1.6: Illustration of the emission sites from Chandra PR pages.
spots on the ring of SN 1987A are thought to be long elongated protrusions and thus only a small fraction of the blast wave participates in this head on collision. The rest of the blast wave moves unhindered on. The blast wave that runs along the sides of the long protrusions also causes shocks. These are called oblique shocks.
The radio and the X-ray light curves tracked each other very well until about 1999 (Park et al. 2007), when the soft X-rays brightened much faster than the hard X-rays. This happened roughly at the time when the hot spots appeared in the optical, supporting the idea that the optical and the soft X-rays are dominated by the hot spots (together with the UV).
We ever only see the part of the shocked gas, that had time to cool down. Most of the soft X-ray emission comes from relatively fast (v ∼500-700 km s−1) shocks, while the optical
emission comes from gas that has been compressed by relatively slow (v ∼ 150-300 km s−1)
shocks. Only gas that has had time to cool by radiation will emit significant optical radiation. The difference in velocity can be attributed to different shocks engaging protrusion from dif-ferent sides, and variations in density causing different transmitted shock velocities. What we observe will be an average velocity.
The larger the shock speed, the longer time it takes for the gas to cool. In the oblique shocks the velocities are much smaller, because the shock is not head on, but rather an instability caused by faster moving material on the surface of slower moving material (Kelvin Helmholz instability7).
The material heated this way will have a short cooling time because the density is higher and the shock velocity was slower. The physics in this region is dominated by radiative transfer and predominately optical and UV photons are emitted (together with the soft X-rays).
The shocked gas trailing behind the shock front is very hot because the shock velocity was
large. This means that this region is dominated by collisions and the cooling time is long. It is from this region that the infrared photons are thought to be emitted along side with the hard X-rays and radio. This shock component is called the intermediate component (IC) and shows line widths of∼200-300 km s−1.
Since the protrusions are engaged from several sides the velocity we derive from the emission lines Doppler displacement will be a crude average of the different shocks convolved with the geometry along any given line of sight.
The reverse shock is clearly seen in the Lyαand Hαemission lines emitted by hydrogen atoms that cross the reverse shock. This emission is not produced by recombination but by neutral hydrogen atoms in the supernova debris, that are excited by collision with electrons and protons in the shocked gas. The observed flux of broad Lyαis a direct measure of the flux of hydrogen atoms crossing the reverse shock. The reverse shock is propagating outwards with a velocity of about 80% that of the forward shock wave (Heng et al. 2007).
The Stationary Ring
Figure 1.7: Schematic representation of the double-shock structure of SN 1987A, from Pun et al. (2002)
A few months after the explosion narrow optical and ultraviolet emission lines were detected from the system. The emission revealed many details for the system: First of all that the emis-sion originated from an almost stationary gas (the emisemis-sion lines were narrow). The elements in the gas showed large ionisation, and it must have been ionised by soft X-rays from the explosion. The gas deposited by the progenitor showed large amount of nitrogen, which put constrains on the evolutionary path of the progenitor. The light-curve rise time put the gas at a distance of a light year from the supernova, and last the fading of the narrow emission lines put the density of the gas at 3×10³−3×104cm−3(Lundqvist & Fransson 1996).
Today we still can see the narrow lines from the stationary ring, they are expected to rise in strength as they are re-ionised by the emission from the shock interaction.
1.4
This Thesis
This thesis is an observational study of the spectacular supernova (SN) 1987A at infrared (IR) wavelengths (1-2.5 µm) in the Large Magellanic Cloud. Chapter 1 (current) aims to give a background on SN 1987A and explain the physics behind the IR emission we observe today. I present two epochs 17 and 18 years after explosion of data both observed with an integral field spectrograph operating in the IR (SINFONI) mounted on the Very Large Telescope (VLT, in Chile). This makes these the first IR observations to be published since Fassia et al. (2002) published spectra from the supernova at the age of 9 years.
The extended nature of the inner ring (and by now the ejecta) limits slit spectroscopy to indi-vidual regions of the ring. With an integral field unit, it is now possible to measure the ring and the supernova ejecta without losses, to reconstruct the ring emission in individual lines, and it allows for a clean separation of the ejecta from the ring.
was not expected and none of the existing models of SN 1987A can account for it. I have with these observations found another puzzle for supernova researchers in years to come.
The first epoch from 2004 was observed as a part of the science verification run on SINFONI, and thus were the first data of this kind of SN 1987A. The second epoch was observed in 2005 after I was awarded time via a normal proposal process (Principal Investigator: K. Kjær, pro-posal id: 080.D-0588C). I planned the observations based on the Science verification, where I had established which setting of the instrument would be most beneficial for the scientific output. Integral field spectroscopy is also called 3D spectroscopy, since the data format is 3-dimensional (position on sky and wavelength) and best represented as a cube. While this data-format has been used for some years for galaxies, I had to develop new analysing techniques and considerations, because SN 1987A is an emission line object, where the lines originate from different physical processes. Chapter 2 lays out the observational technique behind the instrument, the instrument pipeline which constructs the data format, and the methodology I developed in order to interpret the data. Chapter 3 explains the data reduction and calibration of the two epochs, and Chapter 4 shows the spectra and line identification. In Chapter 5 I analyse the circumstellar ring in ways only possible with 3D spectroscopy. I have with our data been able to separate the ejecta emission of the supernova from the circumstellar ring, and I describe our findings in Chapter 6. I finally discuss and summarise our results in Chapter 7.
Chapter 2
SINFONI: Instrument, Pipeline, and
Methodology
The work in this thesis is based on integral field spectroscopy observations. This is an excit-ing new technique in which spectra and images are obtained simultaneously. In this chapter I describe the instrument I used (SINFONI), the pipeline I used for the data reduction and a glos-sary for this kind of data. This Chapter also describes the considerations one should have when interpreting integral field spectroscopy data for an emission line object and the methodology I developed for the analysis.
2.1
Instrument
According to the user manual (Kissler-Patig & Szeifert 2005) SINFONI is a near-infrared (1.1-2.45 µm) integral field spectrograph fed by an adaptive optics module. The spectrograph op-erates with 4 gratings (J, H, K, H+K band) providing a spectral resolution aroundλ/∆λ2000, 3000, 4000 in J, H, K, respectively, and 1500 in H+K - each wavelength band fitting fully on the 2048 pixels of the Hawaii 2RG (2k×2k) detector in the dispersion direction.
The technique behind the integral field spectroscopy is to split the Field of View (FOV) im-age into parts and obtain spectra from each of those parts simultaneously. At the moment there are two ways this is successfully being done; Either by splitting the image using fibers or by using mirrors.
the two-dimensional spatial information together with the third, spectral information is used to create a data cube. The spatial resolution in y-direction is directly set by the height of the slitlets.
The pre-slit optics allows to chose the plate scale and thus the width of the slices. The choices are slit widths of 250mas (mas=10−3arcseconds), 100mas and 25mas, leading to field of views on the sky of 8”x8”, 3”x3”, or 0.8”x0.8” respectively. Each one of the 32 slitlets is imaged onto 64 pixels on the detector. Thus one obtains 32x64 spectra of the imaged region on the sky. Figure 2.2 shows a raw science image from SINFONI. The 32 slitlets are imaged next to each other in the x direction and with a small offset in the dispersion direction (y-direction). The (many) bright lines are skylines, the small bright points are cosmic rays or bad/hot pixels, and the fuzzier blobs are from the circumstellar ring of SN 1987A. In this exposure Star 3 is not in the FOV, since a star, being a continuum source, would appear as a bright vertical line.
SINFONI can be used without adaptive optics (AO) guide stars, in which case the AO mod-ule just acts as relay optics and the spatial resolution is dictated by the natural seeing. The full power of the instrument is, of course, achieved when an adaptive optics guide star is available. For best correction, the star should be brighter than R=11 mag. However, the AO can work (and will provide moderate image quality improvement) with stars as faint as R=17 mag in the best seeing conditions. Ideally, the AO guide star should be as close as possible to the scientific tar-get (if not the science tartar-get itself), and usually closer than 10”. Depending on the atmospheric conditions (atmospheric coherence length) the AO guide star could be chosen as far as 30” for the AO system to still provide a mild improvement of the encircled energy.
The Strehl ratio is commonly used to assess the quality of seeing in the presence of atmo-spheric turbulence and assess the performance of any adaptive optical correction system. The definition of the Strehl ratio is the ratio of the observed peak intensity at the detection plane of a telescope or other imaging system from a point source compared to the theoretical maxi-mum peak intensity of a perfect imaging system working at the diffraction limit1. The intensity
distribution in the image plane of a point source is generally called the point spread function (PSF). Obviously, characterising the form of the point-spread function by a single number, as
1A beam of light of a finite size undergoes diffraction and spreads in diameter. This effect limits the minimum
diameter d of spot of light to: d=1.22λaf, where f is the focal length and a is the diameter of the beam of light.
the Strehl Ratio does, will only be meaningful and sensible if the point-spread function is lit-tle distorted from its ideal (aberration-free) form. This is valid for well corrected systems that operate close to the diffraction limit. Had we observed a point spread function (PSF) star right after the science observations using the same AO loop as on the target, we would have observed the strehl in the centre of the image plane and been able to deconvolve the overall changes to the brightness profile the AO introduces. Essentially the AO correction changes the PSF profile to have more signal in the core and less in the wings.
Our observations were AO supported using a nearby star (Star 3, 1.65” from the SN) as a ref-erence source for the AO. When Star 3 is in the FOV we should be able to use the shape of the observed PSF of this star to deconvolve the whole image plane. However we are facing three problems: i) the signal from Star 3 is incomplete due to its position close to or at the edge of the FOV, ii) Star 3 has a magnitude of MB=15, which limits the effectiveness of the AO, and iii) we face a problem with our object being an extended source, which renders such a deconvolvement unreliable (Davies 2007). These three problems combined resulted in us not deconvolving the observations. For future observations we recommend the use of the LASER guide star system to boost the signal of the reference source, and additional observations of PSF stars after each science exposure.
According to the SINFONI user manual (Kissler-Patig & Szeifert 2005) the spectral PSF is dif-ferent in each plate scale and for different filters. This means that the shape of the emission lines are changed slightly in the observations, and more so for the 25mas plate scale than the 250mas plate scale. This fact has to be taken into consideration when the emission line shapes are examined, because a brighter core of a line might be artificial, as well as strange bumps around the peak of the line. These changes are complicated because they vary with wavelength within one filter. Currently there is no established way to deconvolve this effect.
The infrared night sky is very bright. This air-glow represents the dominant source of back-ground (i.e. foreback-ground) observations at J-, H- and most of the K band. It is mainly radiated by excited levels of the hydroxyl radical OH−, known as the Meinel bands, which are excited
through the reaction:
H+O3 −→OH∗+O2 (2.1)
The altitude of the air-glow emission is about 85-100 km, which causes it to affect all terrestrial sites. It is expected to be less at sites nearer the magnetic equator than the magnetic poles. For a thorough discussion on the IR sky see Glass (1999). The sky emission lines are numerous and highly variable. The sky brightness in the emission lines varies on large angular scales and with time, due to passage of gravity waves in the ionosphere. The variations are characterised by spatial periods of tens of km and temporal periods of 5-15 minutes, with amplitudes of typi-cally 10%. A decrease of intensity of order 50% during the night is not unusual.
Figure 2.2: Left a raw image from SINFONI, right the zoom of it. The bright lines are skylines. The fainter fuzzier blobs are emission lines from the ring. The little bright spots are either bad pixels or cosmic rays.
2.2
The Pipeline
We use the SINFONI pipeline version 1.22 (Schreiber et al. 2004; Modigliani et al. 2007) to
reduce and combine the raw data.
The pipeline has recipes for making both intermediate data products and final reduced data. The intermediate data products are files, which are used later in reducing the science frames. Amongst these intermediate files are bad pixel maps, tables with the position of the different slitlets, distortion maps, and wave maps with the wavelength calibration for the observations. In Figure 2.2 the raw data shows how the slitlets are shifted in the dispersion direction. This helps the pipeline determine when one image slice ends and an other one starts. In the zoom we see that the supernova ring is only detected in every other slitlets. This is because neighbouring slitlets are not originating from image slices next to each other. In fact every second slitlets are neighbouring slitlets in the image plane. If one wants to reduce the data not using the pipeline, the sequence of the slitlets in the raw image needs to be known. In the SINFONI data the upper image slice is imaged in the middle of the detector and its neighbouring slice is imaged skipping the space for one slice towards the edge of the detector. When the imaging of the slices reach the edge of the detector it turns around and image onto every second slice gap until it reached the far end of the detector, where it again turns around and image slices until it reached the position next to the middle. This imaging method reduces the effects bad areas of the detector would have on the observations.
The bright infrared sky is removed in the pipeline. The pipeline subtracts offset sky obser-vations from the science obserobser-vations, any residual skylines remaining after this are removed by the pipeline, which subtracts a theoretical sky spectrum scaled to fit the measures strength of the residual sky. This step can be suppressed by setting one of the parameters in the data reduc-tion recipes. For the longer exposures it often happens that the sky removal causes P-Cygni like profiles, where the red (or blue) part of the line is more subtracted than the blue (or red) part
of the skyline. This happens because the sky changes with time, not only in strength but also in its movement. Since all the skylines are narrow, a residual P-Cygni profile remains when the profile for a given line is not matched perfectly. Both the pipelines extra sky removal and this effect sometimes causes negative values in the spectra.
The final data product is a cube (x,y,λ), where the x and y directions are spatial. Because the 32 slitlets each are imaged onto 64 pixels the pixels in the reconstructed cube are rectangular. If the observations are of several exposures and those have been shifted a non integer amount of pixels the observations are dithered and a higher spatial resolution can be achieved. Several exposures in the same band are combined using a mean sigma algorithm, which first establish the distribution of the data points (counts) for each spatial position and each spectral element. Then the point(s) in the tails of the distribution, the outlying 10 % high and low values, is cut away. Finally the mean value is computed. The user can specify a sigma, for which the mean is computed disregarding data points that are more than that sigma away from the majority of the data-points. The size of sigma can be adjusted in the parameter file. We found the default sigma value of 2 to give good results.
2.3
Terminology and Methodology
The 3D data format consists of a cube (spatial x, spatial y, wavelengthλ) for each filter/band. The elements in the spatial plane (x,y) are called spaxels (as opposed to pixels), since each spaxel is a spectrum. The elements in a cube (x,y) belonging to a single wavelength element is called a frame, borrowed from the movie terminology, where a movie is made from many pictures or frames. The spectral resolution sets the distance in wavelength between the frames for a band.
In order to build a normal image in a filter we simply collapse the wavelength dimension by integrating over that axis. In such an integration we add frames, each with a different wave-length together:
Image(x,y)=
n
X
i=1
(x,y, λi), (2.2)
where n is the length of the wavelength axis. Such an integration is often also referred to as a
map, especially when the integration range in wavelength only covers one emission line. This
way it is possible to map out the spatial distribution of a single emission line.
We can also construct spectra from the cube by integrating over different spatial regions. This way we can imitate a slit of any size or geometry. Spectra constructed from a cube are often called extractions, since the spectrum is extracted from the cube. Especially if the extractions are circular the extraction area is called aperture, which comes from the optical definition of size of signal included when measuring stars.
A spectrum extracted with a circular aperture is added over the spatial directions:
Spectrum(λ)= X
|xi−xc|<r
X
|yi−yc|<r
where r is the extraction radius of the aperture centred on spaxel (xc,yc).
It is important to only compare emission line strengths between extractions of same aperture size, since the flux is very dependent of aperture. When we extract the complete spectrum for the ring and supernova we do not specify the extraction area, since we already have all the signal within our area, which means the flux would not grow with larger area. For all other extractions we scale the flux of the extracted spectrum with the area of the extraction, so we can compare between different extractions.
In the collapsed cubes displaying the FOV of our observations we can measure the full width half maximum (FWHM) of the star(s) in the image. The FWHM is not just the seeing from the atmospheric disturbance and the AO correction, but also a measure of the spatial dispersion in the cube and the spatial resolution. Since the FWHM combines so many distortion effects, we rename it to ’image quality’ and use the number as an estimate for reasonable extraction sizes.
We mainly use circular extraction areas because the PSF of a point source in the collapsed cube is close to being circular. Rectangular extraction areas makes here little sense.
At first we adopted the image quality as a radius, reasoning that the area would reflect the max-imum spatial area from which the emission originated. This however, only caused additional contamination from surrounding areas. Later we ended up using the image quality as a measure of the diameter, which diminished the contamination, and still seemed a sound praxis. Thus the diameter of the extractions are of the size of the FWHM for a point source.
We could use extractions of one spaxel only, but here it is questionable if the emission is from the given spaxel or from a more luminous neighbouring spaxel.
2.4
Adaptive Voronoi 2D-Binning
There are several tools to help the interpretation of 3D data, most of them are instrument or wavelength specific. There is a significant difference between ground based and space based observations, in that space observations are not affected by the atmosphere created PSF, and thus the binning does not need to enclosure the PSF area on the detector. X-ray observations are implicit 3D data, since each photon carries information about position and energy, and a binning of the photons (each one count in x-rays) is often chosen to be rectangular in shape.
The Adaptive Voronoi 2D-Binning is an IDL algorithm written by Cappellari & Copin (2003), which bins two-dimensional data to a constant signal-to-noise ratio per bin. This routine has been developed for the SAURON (Spectrographic Areal Unit for Research on Optical Nebulae) instrument, which is a panoramic integral-field spectrograph. The programs can easily be used for data not observed with this instrument, and the program performs adaptive spatial binning of Integral-Field Spectroscopy (IFS), X-ray or imaging data. The attractive feature about this technique is the algorithm, which builds a map of bins with equal signal to noise ratio.
The algorithm starts by the pixel with the highest signal to noise and then the bins are created by accreting pixels to the bins until the requested signal to noise ratio has been reached. In this accretion process the three requirements are kept fulfilled.
When applying the Adaptive Voronoi 2D-Binning to our data we have to consider where this make sense. The most used application of this program is to extract stellar kinematics from galaxies by the SAURON consortium. Their results are displayed as velocity maps, showing the velocity difference at spatial different positions for a galaxy, often revealing the rotation (or lack thereof) in the objects. They use the program on continuum sources and extended objects, which are connected over the whole emission region, and which have a somewhat simple topol-ogy.
It make little sense to use the binning on the ring as the emission there is originating from many individual shock sites (spots), which are not (yet) physically connected. Furthermore we would like to bin our data in equally large apertures, which centres are on the ring itself, a requirement this routine cannot securely provide. In the binning we use for the ring, see Chapter 5, we have oversampling in that our bins overlap, but we see this as a necessity in order to catch the spots on the ring, and avoid the case of a spot to be only mapped halfway in one or two bins. Since the flux depends on the aperture size we can only compare flux from equal size apertures. However, we find the Adaptive Voronoi 2D-binning algorithm useful in mapping the velocity distribution of the ejecta, see Chapter 6. The ejecta emission at spatially different positions share physical properties, in that they once were causally connected.
Chapter 3
Data Reduction and Calibration
This chapter describes the data reduction and calibration of two epochs of SINFONI data of SN 1987A and the circumstellar ring interaction. The first epoch is from November 2004 and covers a total of 80 minutes on target in three filters, whereas the second epoch is observed with a higher spatial resolution and a total of 230 minutes on target in three filters, and thus deeper observations.
3.1
Epoch 2004
Our first epoch of SN 1987A observations are from 2004 and consists of Science Verification observations with SINFONI observed by Markus Kissler-Patig on 28 and 29 November 2004 (day 6488/6489, preliminary results were published in Gillessen et al. 2005, to announce first science with SINFONI). Integral-field spectroscopy was obtained in J (1.11-1.35µm), H (1.49-1.79µm) and K (1.99-2.38µm) bands. The observations were AO supported using Star 3 as the reference source. We have not deconvolved the images, since deconvolving extended sources is unreliable (Davies 2007). SN 1987A was observed with two different spatial resolution settings. The primary data in J, H, and K were obtained with a spatial resolution of 250 mas/spaxel and thus with a field of view of 8”×8”. In J we also obtained an observation with a spatial resolution of 100 mas/spaxel and a field of view of 3”×3” (denoted as J100 in the following). All single integrations were 600 seconds long and Table 3.1 displays the total integrations per setting. When several integrations were obtained the individual exposures were offset by sub-spaxel spacings to improve the spatial resolution. The exposures were separated by sky exposures of equal integration time in a target-sky sky-target sequence.
J
H
K
E
N
Star 3
Star 2
1"
J100
1"
Table 3.1: Summary of observations of epoch 2004. The rows designate the observation date (UT), the time since the explosion of SN 1987A on 23 February 1987A, the spaxel size of the observation, the wavelength range of the spectrograph setting, the spectral resolution, the total exposure time and the image quality as measured from the combined data cube on Star 2 and Star 3. We further list the standard stars used for the flux calibration, and the uncertainty in the flux as determined from a comparison of Star 2 from the corresponding black body curve, the uncertainty in the wavelength calibration as measured from night sky lines and the corresponding uncertainty in velocity.
J H K J100
Date 2004/11/28 2004/11/29 2004/11/29 2004/11/28
Day 6488 6489 6489 6488
Spatial Res. 250mas 250mas 250mas 100mas
Wavelength 1.11-1.35µm 1.487-1.792µm 1.985-2.375µm 1.11-1.35µm
λ/∆λ 2000 2000 4500 2000
Exptime 600s 1200s 1800s 1200s
Image quality 0.62” 0.46” 0.48” 0.32”
Std. Star HD36531 HD29303 HD29303 HD36531
ǫFlux 1 % 13 % 4 % 4 %
δ(λ) 8×10⁻⁵µm 7×10⁻⁵ µm 7.5×10⁻⁵µm 8×10⁻⁵µm
δ(v) 19 km s−1 12 km s−1 11 km s−1 19 km s−1
The data have been reduced and recombined into data cubes using the SINFONI pipeline (Schreiber et al. 2004; Modigliani et al. 2007). We crosschecked the wavelength solution with the atmospheric OH lines (Rousselot et al. 2000) and the resulting wavelength calibration is accurate to 8×10⁻⁵µm, 7×10⁻⁵µm and 7.5×10⁻⁵µm, in J, H and K, respectively. This corre-sponds to systematic velocity uncertainties of 19 km s−1, 12 km s−1, and 11 km s−1, as listed in
Table 3.1.
Reddening Correction
The interstellar dust in the Large Magellanic Cloud (LMC) and Milky Way (MW) redden the light, which is best expressed via the extinction law from Cardelli et al. (1989):
hA(λ)
A(V)i= 0.574·x
1.61− 0.527
RV
· x1.61, (3.1)
which is valid for 0.3µm−1 ≤ x ≤ 1.1µm−1, where x=1/λ(in microns) and the absorption, A, is
measured in magnitudes. Using the approximation AV ≈ RV· E(B-V) and noting that this is an average extinction law we get:
hA(λ)i = AV ·(0.574− 0.527
RV
)·x1.61
hA(λ)i = RV ·E(B−V)·(0.574− 0.527
RV
)· x1.61
We de-reddened the spectra using the galactic extinction law equation 3.1, assuming RV = 3.1, and EB−V=0.16 (Fitzpatrick & Walborn 1990) for the colour excess towards SN 1987A, based on EB−V=0.10 from the LMC and EB−V=0.06 from the Milky Way (Staveley-Smith et al. 2003). The differences between the LMC and galactic extinction law are negligible at low colour excess in the near-IR. This gives:
hA(λ)i = 0.16·(3.1·0.574−0.527)·x1.61
hA(λ)i = 0.200
λ1.61
Flux Calibration
Standard stars were observed directly before or after the supernova and have been used to re-move the telluric features (i.e. the absorption and emission from the atmosphere). We used the standard stars to construct a sensitivity curve and derive the flux calibration, based on their measured magnitudes from the 2MASS catalogue (Cohen et al. 2003). In this way the whole data cube had the same flux calibration, and we could derive calibrated spectra for Stars 2 and 3 as well. To test the absolute flux calibration we compared the spectrum of Star 2 (a B2 star NW of the SN, Walborn et al. 1993) with the blackbody curve of a star with R=8.3 R⊙ and
Te f f=22500 K at the distance of 50 kpc, see Figure 3.2. These values for the star are reasonable when considering a type B2 star (Trundle et al. 2007). The derived flux differences are of the order of 10% and are listed as ǫFlux in Table 3.1. For the J100 observations we calibrated the flux using Star 3, since Star 2 is not in this smaller FOV. As Star 3 is variable we used the observed values of Star 3 in the J250 to cross correlate the value. The total flux from Star 3 observed in J100 was 4% different from the total flux from Star 3 obtained from J250 using the same aperture in arcseconds. We combined the two J observations into one spectrum weighting the spectra with the exposure time. The flux error estimate for this combined spectrum is of the order of 2%. We do not think that any emission contamination from the ring will influence the result beyond the 10% we find as the accuracy of the flux.
3.2
Epoch 2005
Based on the 2004 epoch we had seen that the emission lines had enough flux to be observed with the 100mas setting, which would spread the faint object over a larger area of the de-tector. For this second epoch we thus chose to observe with the higher spatial resolution of 100×50mas/pixel for all bands, and thus with a field of view of 3”×3”.
Figure 3.2: Flux calibration check on Star 2. The black body curve is the theoretical curve for Star 2. The observed J, H and K spectrum for Star 2 is plotted on top (aperture of 2”). The bottom panel shows the residuals.
Table 3.2: Summary of the observations of epoch 2005. Each filter was observed on three different nights. The day after explosion (Day), standard star, helio centric velocity (vhelio) and total exposure time (Exp) are listed for each separate observation night and filter.
Band Exp Date Std. Star vhelio Airmass Day



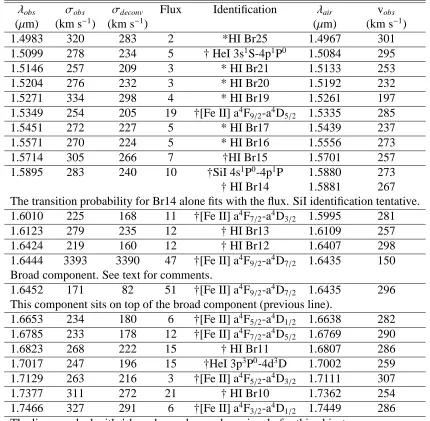
![Figure 5.2: Left: Extraction of spectra from the reduced data cube close to the [Fe II] 1.257 µmand Paβ lines in the J100 band](https://thumb-us.123doks.com/thumbv2/123dok_us/8171090.1364188/64.595.101.541.99.316/figure-left-extraction-spectra-reduced-close-umand-pab.webp)
![Figure 5.5: Flux variations for diffAerent angular positions around the ring. The aperture area is=π ∗ (0.375′′)2 for the H and He lines, and A=π ∗ (0.35′′)2 for the [Fe II] line.](https://thumb-us.123doks.com/thumbv2/123dok_us/8171090.1364188/69.595.108.529.240.560/figure-flux-variations-diaerent-angular-positions-aperture-lines.webp)
