Article
1
Effects of Channel Wall Twisting on the Mixing in a
2
T-Shaped Micro-Channel
3
Dong Jin Kang1*
4
1 School of mechanical engineering, Yeungnam University, Daehak-ro 280, 712-749, Gyungsan, Korea
5
* Correspondence: [email protected]; Tel.: (+82-53-810-2463)
6
Received: date; Accepted: date; Published: date
7
Abstract: A new design scheme is proposed for twisting the walls of a microchannel, and its
8
performance is demonstrated numerically. The numerical study was carried out for a T-shaped
9
microchannel with twist angles in the range of 0 to 34. The Reynolds number range was 0.15 to 6.
10
The T-shaped microchannel consists of two inlet branches and an outlet branch. The mixing
11
performance was analyzed in terms of the degree of mixing and relative mixing cost. All numerical
12
results show that the twisting scheme is an effective way to enhance the mixing in a T-shaped
13
microchannel. The mixing enhancement is realized by the swirling of two fluids in the cross section
14
and is more prominent as the Reynolds number decreases. The twist angle was optimized to
15
maximize the DOM, which increases with the length of the outlet branch. The twist angle was also
16
optimized in terms of the relative mixing. The two optimum twisting angles are generally not
17
coincident. The optimum twist angle shows a dependence on the length of the outlet branch but it
18
is not affected much by the Reynolds number.
19
Keywords: T-shaped microchannel; degree of mixing; twisting angle
20
21
1. Introduction
22
Microscale fluid mixing is needed to homogenize reagents in many microfluidic systems, such
23
as microreactors and micrototal analysis systems (TASs). Applications include biological and
24
chemical reactions, the dilution of drug solutions, and sequencing nucleic acids [1]. In these systems,
25
the mixing is usually done in various types of microchannels. However, the fluid flows are extremely
26
slow and have very low Reynolds numbers. Therefore, molecular diffusion is a major mechanism of
27
mixing. It is very important to enhance the mixing for the design of microchannels [2].
28
The techniques to improve mixing in microchannels can be classified as passive, active, or
29
combined techniques. One major difference is the usage of an external energy source other than the
30
energy source that drives the flow. Active techniques use various types of external energy sources,
31
such as electrokinetic [3], magneto-hydrodynamic [4], electroosmic [2], ultrasound wave [5], and
32
pulsed flow sources [6, 7]. In contrast, passive techniques use the channel geometry or wall
33
modifications to agitate or generate secondary flow in microchannels. Therefore, passive techniques
34
are much easier to integrate into microfluidic systems. Combined methods involve both passive and
35
active techniques. For example, Chen et al. [8] used a pulsatile flow through wavy channel walls,
36
while Lim et al. [9] combined a periodic osmotic flow with geometry modification.
37
Passive techniques can be categorized into several groups according to how the channel is
38
modified. Many passive techniques modify the channel wall of the outlet branch, which is the portion
39
of a microchannel after the junction where the two fluids merge. Some examples use recessed grooves
40
in the channel wall [10] and a herringbone wall [11]. The second type of technique involves building
41
structures inside the channel, such as indentations and baffles [12, 13], periodic geometric features
42
[14], and a simple block in the junction [15].
43
The third type of technique involves rearranging the overall structure of THE microchannel
44
instead of using a straight microchannel. For example, Kashid et al. [16] studied five different generic
45
microchannel designs with focus on the region before the fluid merges. They tested five different
46
layouts of inlet branches. Kockmann et al. [17] studied various mixer structures to obtain higher
47
mixing in micromixers. Other examples are the AccoMix split-and-recombine technique by Panic et
48
al. [18], the FAMOS multi-lamination micromixer by Keoschkerjan et al. [19], and the K-M collision
49
micromixer by Schneider et al. [20]. These designs use complex elements such as multiple flow
50
passages, 3-dimensional structures, and curved or non-straight channels.
51
Recently, a new concept of twisting the outlet branch has been studied to enhance the mixing in
52
a microchannel. For example, Jafari et al. [21] studied a twisted channel with the Reynolds number
53
ranging from 76.7 to 460.3. They coiled the outlet branch at a given twist angle. Sivashankar et al. [22]
54
proposed a twisted 3D microfluidic mixer fabricated by a laser writing technique. They showed that
55
a twisted channel enhances the mixing.
56
We propose a new twisted channel geometry that is easily fabricated. We also characterized the
57
mixing performance in a T-shaped microchannel. The design has a channel with twisted walls along
58
the outlet branch. The mixing performance was studied numerically, and the performance was
59
analyzed by calculating the degree of mixing and relative mixing cost.
60
61
2. Microchannel with twisted channel walls
62
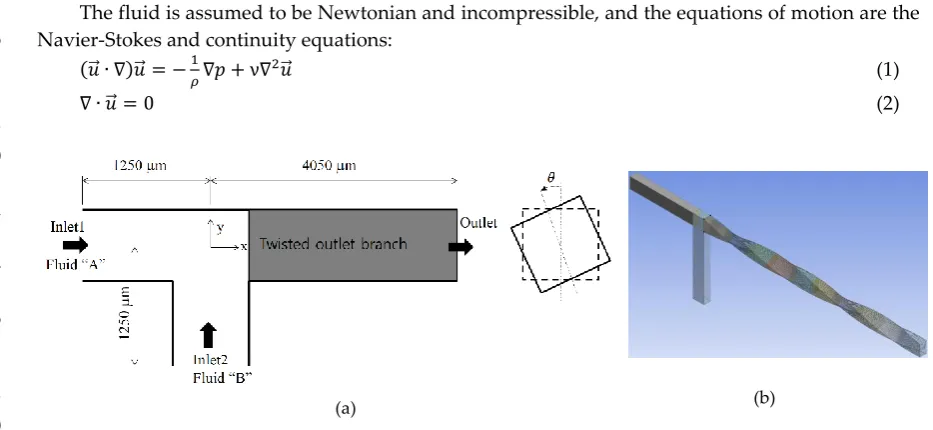
Fig. 1 shows the layout of a T-shaped microchannel with three branches. All three branches have
63
a rectangular cross section that is 200 m high and 120 m deep. Inlet 1 and inlet 2 are both 1250 m
64
long. The branch after the junction of the inlets is the outlet branch, which was varied from 2950 to
65
4050 m long. The channel walls of the outlet branch are twisted, as shown in Fig. 1(a). The twisting
66
angle was varied from 0 to 34 ( revolutions). The shape of the cross section remains unchanged
67
along the outlet branch. Fig. 1(b) shows an example of 2 twisting (1 revolution).
68
For simplicity, we assume that the same aqueous solution flows into the two inlets. The fluid is
69
assumed to have the properties found in many existing BioMEMS systems. Its diffusion constant is
70
D=10-10 m2s-1, and the kinematic viscosity of the fluid is =10-6 m2s-1 at room temperature. This
71
diffusion constant is typical of small proteins in an aqueous solution. The Schmidt (Sc) number is 104
72
(the ratio of the kinetic viscosity and the mass diffusion of fluid).
73
3. Governing equations and computational procedure
74
The fluid is assumed to be Newtonian and incompressible, and the equations of motion are the
75
Navier-Stokes and continuity equations:
76
(𝑢⃗ ∙ ∇)𝑢⃗ = −1
𝜌∇𝑝 + ν∇
2𝑢⃗ (1)
77
∇ ∙ 𝑢⃗ = 0 (2)
78
79
80
81
82
83
84
85
86
87
88
89
90
91
92
where u is the velocity vector, p is the pressure, is the mass density, and is the kinematic
93
viscosity. The evolution of the concentration is computed from the advection diffusion equation:
94
(a) (b)
(𝑢⃗ ∙ ∇)𝜙 = 𝐷∇2𝜙 (3)
95
where D is the diffusion constant, and is the local concentration or mass fraction of a given species.
96
The governing equations (Eqs. (1)-(3)) were solved using the commercial software FLUENT 14.5.
97
All of the convective terms in Eqs. (1) and (3) were approximated by the QUICK scheme (quadratic
98
upstream interpolation for convective kinematics), which third-order theoretical accuracy. A uniform
99
velocity profile was assumed at the two inlets, while the outflow conditions were specified at the
100
outlet. For example, the fluid velocity at the inlets is 1 (mm/s) for a Reynolds number of 0.3. All of the
101
other walls were treated as no-slip walls. The mass fraction of the fluid was set to = at inlet 1
102
and= at inlet 2.
103
The performance of the bridge design was evaluated by calculating the DOM. The DOM defined
104
by Glasgow et al. [5] is used in the following form:
105
𝐷𝑂𝑀 = 1 −1 𝜉√∑
(𝜙𝑖−𝜉)2
𝑛 𝑢𝑖 𝑢𝑚𝑒𝑎𝑛 𝑛
𝑖=1 (4)
106
where ui is the velocity in the ith cell, umean is the mean velocity at the outlet of the microchannel, is
107
the mass fraction in the ith cell, and n is the number of cells is specified as 0.5, which indicates equal
108
mixing of the two solutions.
109
The relative mixing cost was also evaluated using the ratio of the mixing cost to the mixing cost
110
obtained without any twist:
111
𝑀𝐶 = (𝐷𝑂𝑀
∆𝑝)𝑡𝑤𝑖𝑠𝑡
(𝐷𝑂𝑀
∆𝑝)𝑛𝑜 𝑡𝑤𝑖𝑠𝑡
(5)
112
A smaller MC means that channel wall twisting is more effective. The fluid mixing, MF, is defined as
113
follows:
114
𝑀𝐹 = 1 − 2|0.5 − 𝜙| (6)
115
MF=1 means that the fluid is completely mixed, while MF=0 indicates an unmixed fluid of A or B.
116
The computational domain was meshed by structured hexahedral cells. All computational cells
117
have equal size and are each 5 m long. A detailed study of the grid independence of the numerical
118
solutions was carried out previously [8]. According to the results, the total mass flow rate at the outlet
119
has an accuracy of 0.1% when the cell sides are 10 m long. Thus, 5 m is small enough for the cell
120
length. For the baseline design without twisting, the DOM was calculated at the section of x=3 mm
121
as 0.12, which is the same value reported by Glasgow et al. [5].
122
123
4. Results and discussion
124
Computations were carried out for given flow conditions to study how the twisting of the
125
channel walls improves the mixing. The mean velocities at the two inlets are uniform in the range
126
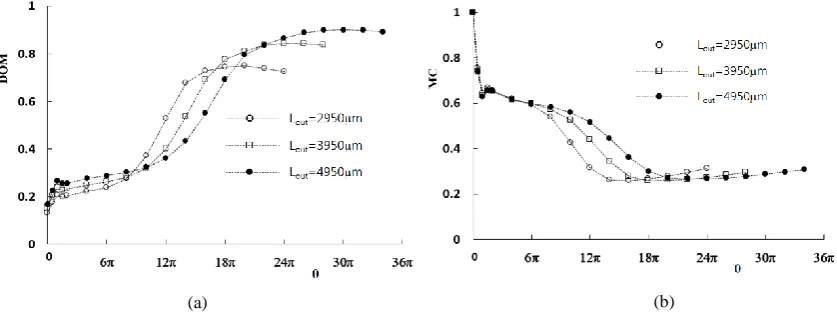
from 0.5 mm/s to 20 mm/s, and the corresponding Reynolds number is 0.15 to 6. Fig. 2 shows the
127
computed DOM and the MC with respect to the twist angle . The DOM was calculated at the outlet.
128
The pressure difference was measured between the two inlets and outlet, and the larger value was
129
used to compute the MC. The DOM shows a significant improvement as the twist angle increases,
130
regardless of the Reynolds number. For example, the DOM with a twist angle of 24 (12 revolutions)
131
is 0.867 for Re=0.3, which is about 5.2 times larger than that obtained without twisting.
132
There is an optimum twist angle where the maximum DOM occurs. However, the optimum
133
angle is almost independent of the Reynolds number. The distribution of the DOM in Fig. 2(a) shows
134
that the effects of the Reynolds number decrease as the Reynolds number increases. This suggests
135
that the twisting of the channel walls becomes a dominant mixing mechanism when the Reynolds
136
number is greater than about 6.
137
In contrast, the MC generally decreases as the twist angle increases. It also has an optimum
138
value, as shown in Fig. 2(b). The optimum twist angle for the minimum MC is smaller than that of
139
the maximum DOM. To examine how the twisting of channel walls improves the DOM, Fig.3 shows
140
the mass fraction contours at several cross sections along the outlet branch. The results were obtained
141
with a twist angle of 18 where the minimum MC occurs. The Reynolds number is 0.3. The contours
show that the fluids A and B rotate clockwise in the cross section as the channel walls twist in the
143
counter clockwise direction. This swirling motion elongates the boundary between the fluids in the
144
cross section, and the mixing is greatly enhanced along the boundary (green area in the figures).
145
The swirl motion is very slow compared with the rate of the channel wall twisting along the
146
outlet branch. For example, fluid B (blue in Fig. 3(b)) moves circumferentially by about 0.5 in
147
comparison to Fig. 3(a) when the cross section is twisted by . Therefore, much greater twisting may
148
hinder the swirling of fluids in the cross section. This suggests that there is an optimum twisting
149
angle where the maximum DOM occurs.
150
151
152
153
154
155
156
157
158
159
160
161
162
163
164
165
166
167
168
169
170
171
172
173
174
175
(a)
Figure. 3 Mass fraction contours at several cross sections along the outlet branch: (a) =0; (b) = (c) = (d)
= (e) = (f) = (g) = (h) = (i) = (j) = (k) = (l) = (m) =1 (n) = (o)
= (p) = (q) = (r) = (s) =
(b) (c) (d) (f) (g)
(h) (i) (j) (k) (l) (m) (n)
(o) (p) (q) (r) (s)
(a) (b)
Figure. 2 Variation of the DOM and MC with the twist angle: (a) DOM; (b) MC.
176
177
178
179
180
181
182
183
184
185
186
187
188
189
190
191
192
193
194
195
196
197
198
199
200
201
202
Fig. 4 shows the contours of the mixed fluid at the same planes as in Fig. 3. The results confirm
203
that the twisting causes vigorous mixing along the boundary. The red streak in the figures indicates
204
the mixed fluid, which develops along the boundary. The length of the boundary increases with the
205
twisting angle i of the cross section. The mixed fluid zone spreads out as the boundary impinges on
206
the channel walls, which means that the channel walls slow down the swirling motion, and the mixed
207
fluid spreads along the channel walls.
208
Fig. 5 compares the mass fraction and the mixed fluid contours at the cross section of i =8 for
209
several twist angles. For a given length of the outlet branch, a larger twist angle results in a greater
210
rate of twisting along the outlet branch. Figs. 5(a)-(d) show how the twisting rate affects the swirl
211
motion in the cross section. As the twisting rate increases, a stronger swirl motion is observed in the
212
cross section with the same twist of i=8. A stronger swirl motion results in a longer boundary of the
213
fluids A and B, as shown in Fig. 5(e)-(h). This eventually enhances the mixing of the two fluids along
214
the boundary.
215
Fig. 6 shows the mass fraction and the mixed fluid contours at the mid-section in the z-direction.
216
The contours of the mass fraction show that the positions of fluids A and B move up and down
217
successively as they flow downstream, which indicates the swirl motion in the cross section. The
218
contours of the mixed fluid confirm that the mixing greatly enhanced along the boundary between
219
fluids A and B. The mixing occurs along the centerline from the junction of the fluids and is greatly
220
Figure. 5 Mass fraction and mixed fluid contours at the cross section of i=8 for several twist angles: mass fraction
contours for (a) =12, (b) =16 (c) = and (d) = mixed fluid contours for (e) =12, (f) =16 (g)
= and (h) = the same colour scale is used as in Fig. 3
(a) (b) (c) (d)
Figure. 4 Distribution of the mixed fluid at several cross sections along the outlet branch: (a) i =0; (b) i = (c) i
= (d) i = (e) i = (f) i = (g) i = (h) i = (i) i = (j) i = (k) i = (l) i = (m) i
=1 (n) i = (o) i = (p) i = (q) i = (r) i = (s) i =
(a) (b) (c) (d) (e) (f) (g)
(h) (i) (j) (k) (l) (m) (n)
(o) (p) (q) (r) (s)
enhanced near the channel wall as the fluids flow downstream. This enhancement is due to the swirl
221
motion.
222
The DOM was optimized, and the corresponding twist angle remained almost constant for the
223
range of Reynolds numbers studied. This suggests that the mixing enhancement mechanism is mostly
224
affected by the twist angle. However, the swirl motion is very slow compared with the rate of , so
225
excessive twisting may hinder the fluid swirling.
226
227
228
229
230
231
232
233
234
235
236
237
238
239
240
241
242
243
244
245
246
247
248
249
250
251
252
253
254
255
256
257
258
259
260
261
262
263
Fig. 7 shows the effects of the length of the twisted outlet branch on the mixing. The DOM shows
264
a strong dependence on the length of the outlet branch. The maximum DOM decreases as the length
265
of the outlet branch decreases. The twist angle where the maximum of DOM occurs increases with
266
the length of the outlet branch. For example, the angles are 10, 12, and 14 for Lout = 2950, 3950, and
267
4950 m, respectively. Similarly, the minimum of MC is obtained at a larger twist angle as the length
268
of the outlet branch increases (8, 9, and 12 for Lout = 2950, 3950, and 4950 m, respectively).
269
However, the ratio of the twist angle to the length of the outlet branch decreases as the length of the
270
outlet branch increases. This means that greater twisting is required as the length of the outlet branch
271
decreases.
272
Figure. 6 Contours at the mid-section in the z-direction: (a) mass fraction of fluid “A”; (b) mixed
fluid; the same colour scale is used as in Fig. 3.
(a) (b)
Figure. 7 Effects of length of the outlet branch on mixing: (a) DOM; (b) MC.
(a)
273
5. Conclusions
274
This study numerically examined the effects of channel wall twisting on the mixing performance
275
of a T-shaped microchannel. The performance was evaluated by examining the DOM and the MC.
276
The channel walls were twisted continuously from the junction of the two inlet branches to the outlet,
277
and the twist angle of the cross section increases continuously. This twisting scheme is easy to
278
fabricate and very effective for improving the DOM.
279
The simulation results showed that the twisting significantly enhances the mixing due to the
280
swirl motion of the fluids in the cross section along the outlet branch. In general, increasing the twist
281
angle increases the swirl motion, which elongates the boundary between fluids A and B and enhances
282
the DOM. But the swirl motion is very slow compared with the rate of the channel wall twisting along
283
the outlet branch. Excessive twisting hinders the swirl and decreases the DOM, so there is an
284
optimum twist angle where the maximum of DOM occurs. This optimum twist angle increases with
285
the length of the outlet branch but is almost independent of the Reynolds number.
286
The twisting angle was also optimized in terms of the relative mixing cost. This twist angle is
287
different from that where the maximum DOM occurs and shows a dependency on the length of the
288
outlet branch. Greater twisting is required as the length of the outlet branch decreases. As the
289
Reynolds number increases, the twisting becomes dominant in mixing the fluids, and its effects on
290
the DOM is limited. But the relative mixing cost is improved further as the Reynolds number
291
increases, which suggests that the twisting is a useful passive design concept for a wide range of
292
Reynolds numbers.
293
294
295
Acknowledgments
296
This work was supported by the 2018 Yeungnam University Research Grant.
297
Conflicts of Interest
298
The authors declare no conflict of interest.
299
References
300
1. Karniadakis, G.; Beskok, A.; Aluru, N. Basic concepts and technologies. In Microflows and nanoflows,
301
fundamentals and simulations; Publisher: Springer, New York, 2004.
302
2. Hadigol, M.; Nosrati, R.; Nourbakhsh, A.; Raisee, M.; Numerical study of electroosmotic micromixing of
303
non-Newtonian fluids, J. Non-Newtonian Fluid Mechanics, 2011, 166, 965-971.
304
3. Oddy, M.H.; Santiago, J.G.; Mikkelsen, J.C. Electrokinetic instability micromixing, Anal. Chem., 2001, 73,
305
5822-5832.
306
4. Bau, H. H.; Zhong, J.; Yi, M. A minute magneto hydro dynamic (MHD) mixer, Sens. Actuator B, 2001, 79,
307
207-215.
308
5. Rahimi, M.; Aghel, B.; Hatamifar, B.; Akbari, M.; Alsairafi, A. CFD modeling of mixing intensification
309
assisted with ultrasound wave in a T-typ2 microreactor, Chem. Eng. Processing, 2014, 86, 36-46.
310
6. Goullet, A.; Glasgow, I.; Aubry, N. Effects of microchannel geometry on pulsed flow mixing, Mech. Res.
311
Comm., 2006, 33, 739-746.
312
7. Glasgow, I.; Lieber, S.; Aubry N. Parameters influencing pulsed flow mixing in micro channels, Anal. Chem.,
313
2004, 76, 4825-4832.
314
8. Chen, C.; Cho, C.; A combined passive/active scheme for enhancing the mixing efficiency of microfluidic
315
devices, Chem. Eng. Sci., 2008, 63, 3081-3087.
316
9. Lim, C. Y.; Lam, Y. C.; Yang, C. Mixing enhancement in microfluidic channel with a constriction under
317
periodic electro-osmotic flow, Bio-microfluidics, 2010, 4, 014101.
318
10. Stroock, A. D.; Dertinger, S. K.; Whitesides, G.M.; Ajdari, A. Patterning flows using grooved surfaces, Anal.
319
Chem., 2002, 74, 5306-5312.
320
11. Somashekar, V.; Olse, M.; Stremler, M. A. Flow structure in a wide microchannel with surface grooves,
321
Mech. Res. Comm., 2009, 36, 125-129.
12. Sotowa, K.I.; Yamamoto, A.; Nakagawa, K.; Sugiyama, S. Indentations and baffles for improving mixing
323
rate in deep microchannel reactors, Chem. Eng. J., 2011, 167, 490-495.
324
13. Kang, D.J. Effects of baffle configuration on mixing in a T-shaped microchannel, Micromachines, 2015, 6,
325
765-777.
326
14. Fang, Y.; Ye, Y.; Shen, R.; Guo, P.Z.; Hu, Y.; Wu, L. Mixing enhancement by simple periodic geometric
327
features in microchannels, Chem. Eng. J., 2012, 187, 306-310.
328
15. Kang, D.J.; Song, C.H.; Song, D.J. Junction contraction for a T-shaped microchannel to enhance mixing,
329
Mech. Res. Comm., 2012, 33, 739-746.
330
16. Kashid, M.; Renken, A.; Kiwi-Minsker, L. Mixing efficiency and energy consumption for five generic
331
microchannel designs, Chem. Eng. J., 2011, 167, pp. 436-443.
332
17. Kockmann, N., Kiefer, T., Engler, M., and Woisa, P., Convective mixing and chemical reactions in
333
microchannels with high flow rates, Sensors and Actuators B: Chemical, 2016, 117, 495-508.
334
18. Panic, S.; Loebbecke, S.; Tuercke, T.; Antes, J.; Boskovic, D. Experimental approaches to a better
335
understanding of mixing performance of microfluidic devices, Chem. Eng. J., 2004, 101, 409-419.
336
19. Keoschkerjan, R.; Richer, M.; Boskovic, D.; Schnurer, F.; Lobbecke, S. Novel multifunctional microreaction
337
unit for chemical engineering, Chem. Eng. J., 2004, 101, 469-475.
338
20. Schnurer, M. A.; Maeder, T.; Ryer, P.; Stoessel, F. A microreactor based system for the study of fast
339
exothermic reaction in liquid phase: characterization of the system, Chem. Eng. J., 2004, 101, 241-250.
340
21. Jafari, Omid; Rahimi, M.; Kakavandi, F.H. Liquid-liquid extraction in twisted micromixer, Chem. Eng.
341
Process: Process Intensification, 2016, 33-40.
342
22. Sivashakar, S.; Agambayev. S.; Mashraei, Y. A twisted microfluidic mixer suitable for a wider range of flow
343
rate applications, Biomicrofluidics, 2016, 10, 034120.