March 1, 2012
1
JAB_2011_0137.R3
2 3
A Comparison of Treadmill and Overground Walking Effects on Step Cycle Asymmetry in Young
4
and Older Individuals
5 6
1
Hanatsu Nagano ([email protected]), 1 Rezaul K. Begg ([email protected]),
7
1
William A. Sparrow ([email protected]) and 1 Simon Taylor ([email protected]) 8
9
10
1
Institute of Sport, Exercise and Active Living (ISEAL) and School of Sport and Exercise Science
11
(SES), Victoria University, Victoria, Australia
12 13 14
15 16
17 18
19 20 21
Word count: 2846
22
Conflict of Interest Disclosure: none
23
Corresponding Author: W.A. Sparrow Victoria University, Victoria, Australia
24
Tel. +61 3 9919 1116; fax: +61 3 9919 1242; email: [email protected]
Abstract
27
Although lower limb strength becomes asymmetrical with age, past studies of ageing effects on gait
28
biomechanics have usually analysed only one limb. This experiment measured how ageing and
29
treadmill surface influenced both dominant and non-dominant step parameters in older (Mean 74.0
30
yr) and young participants (Mean 21.9 yr). Step-cycle parameters were obtained from 3-D
31
position/time data during preferred-speed walking for 40 trials along a 10 m walkway and for
10-32
minutes of treadmill walking. Walking speed (Young 1.23 m/s, Older 1.24 m/s) and step velocity
33
for the two age groups was similar in overground walking but older adults showed significantly
34
slower walking speed (Young 1.26 m/s, Older 1.05 m/s) and step velocity on the treadmill due to
35
reduced step length and prolonged step time. Older adults had shorter step length than young adults
36
and both groups reduced step length on the treadmill. Step velocity and length of older adults’
37
dominant limb was asymmetrically larger. Older adults increased the proportion of double support
38
in step time when treadmill walking. This adaptation combined with reduced step velocity and
39
length may preserve balance. The results suggest that bilateral analyses should be employed to
40
accurately describe asymmetric features of gait especially for older adults.
41 42
Key Words: Ageing, Treadmill Walking, Asymmetry, Gait, Spatio-temporal Parameters
43 44
45 46 47
48 49
Introduction
52
There is a worldwide research effort to better understand ageing effects on gait
53
biomechanics with the aim of determining how stability might be compromised and the risk of
54
falling increased.1 Two fundamental consequences of age-related declines in sensory motor function
55
are evident in walking mechanics. The first is reduced performance, primarily due to loss of muscle
56
strength and associated force production. These changes are reflected in both the kinetic dimensions
57
of gait control2 and associated spatial and temporal parameters of the step and stride cycle, such as
58
reduced step length, which has been considered the most appropriate spatio-temporal measure of
59
age-related frailty and falls risk.3, 4 The second major gait-related consequence of ageing is
60
compensatory adaptations that emerge to protect the walker; these effects are reflected in
61
“functional” or adaptive changes to gait cycle variables. The progression toward shorter steps and
62
slower walking as we age, for example, appear to compromise dynamic stability, particularly in the
63
medio-lateral axis.3, 5-8 Increased step width and prolonged double support in older adults, may
64
therefore emerge as functional responses, in this case maintaining medio-lateral stability. 4, 9 While
65
such ageing-related gait adaptations have been well researched, one characteristic of older adults’
66
gait that has received relatively little attention is the symmetry of step control, as reflected in step
67
length and step time measures sampled from both lower limbs simultaneously.
68
Previous gait biomechanics investigations have typically described the motion of only one
69
limb and unilateral analysis has, possibly, been employed on the assumption that ageing influences
70
both limbs in the same way. Consequently, traditional averaging of right and left side gait variables
71
would preclude the opportunity to recognise any asymmetry. Adaptive locomotor control is,
72
however, dependent on interactions between the lower limbs and kinetic and kinematic variables
73
could be more unequal or “asymmetrical” than previously reported. Sadeghi et al.,10-12 for example,
74
suggested that asymmetry in spatio-temporal parameters has not only been observed in pathological
75
gait but is also seen in non-impaired individuals, a finding that supports earlier research. 13, 14
Sadeghi et al.11 introduced the “functional asymmetry” hypothesis, in which the dominant
77
limb primarily serves forward progression while the non-dominant limb maintains stability but
78
there is no conclusive evidence of ‘functional asymmetry’ to explain gait asymmetry in healthy
79
young individuals 11, 15 despite the implication of partial support.12 While previous studies of
80
functional asymmetry have not examined older adults’ gait, Perry et al.2 found that with ageing the
81
dominant limb becomes asymmetrically stronger. It is, therefore, reasonable to hypothesise that
82
spatio-temporal gait parameters also become asymmetrical with ageing. Asymmetry in older
83
individuals has previously been linked to falls risk2, 16, 17 but there are no previous reports of ageing
84
effects on the symmetry of step cycle parameters.
85
The aim of this experiment was to investigate ageing effects on step cycle parameters by
86
employing bilateral measurements of individual step cycles, rather than employing the more usual
87
stride cycle analysis that does not separately examine the contribution of the two limbs and
88
therefore masks any asymmetry in spatio-temporal parameters. Accordingly, it was hypothesised
89
that older adults would show greater asymmetry in spatio-temporal parameters (see Figure 1) than
90
young controls. In unconstrained overground walking healthy older adults may be capable of
91
concealing asymmetric features of their gait and use both limbs equally but when encountering a
92
more challenging task they could show increased confidence in their dominant limb. To test
93
whether gait asymmetry is related to the level of challenge in walking we studied gait adaptations
94
when walking at preferred speed overground and also when treadmill walking. Young adults are
95
reported to fully familiarise to treadmill walking18 whereas in one study, when on a motor driven
96
treadmill older participants were requested to match their overground walking speed, two-thirds
97
were unable to do so without using the safety handrail.19 Older adults appear, therefore, to be
98
destabilized during treadmill walking and it was of interest to determine whether a challenging
99
treadmill walking condition was reflected in step cycle parameters.
100
Methods
Participants
102
Ten young adults (18 – 35 years, 6 males/4 females, age 21.9 ± 3.30 years) and ten older
103
adults (> 65 years, 6 males/4 females, age 74.0 ± 7.63 years) participated; their height, body mass
104
and limb dominance characteristics were as follows: Young: Height (1.67 ± 0.10 m), Weight (68.4
105
± 12.21 kg), Limb dominance (n = right/left: 8/2) Older: Height (1.69 ± 0.11 m), Weight (73.1 ±
106
9.06 kg); Limb dominance (n = right/left: 8/2). The limb used to kick a ball was classified as the
107
dominant limb, as previously used.15 All older adults lived independently, were able to perform
108
routine daily activities, free of any known cognitive, orthopaedic or neurological abnormalities and
109
able to walk for at least 20 minutes continuously. Older volunteers were also excluded if they
110
exceeded 12 seconds on a ‘timed up and go test’, scored less than 20 on a visual contrast sensitivity
111
test (‘Melbourne Edge Test’) and reported at least one fall within the previous two years. None of
112
the participants were regular treadmill users. All participants provided informed consent using
113
procedures approved and mandated by the Victoria University Human Research Ethics Committee.
114
Experimental Protocol
115
Overground walking was performed at each participant’s preferred speed along a ten meter
116
overground walkway for 40 trials. Two force platforms (AMTI, Watertown, MA, USA) located in
117
the middle of the walkway flush with the floor recorded foot-ground contact at 1200 Hz for
118
consecutive steps. An Optotrak® optoelectric motion capture system (Northern Digital Inc.,
119
Canada) with two camera towers tracked the 3D position of eight markers (light-emitting diodes) on
120
each foot at 240 Hz. Post-test processing of the overground walkthrough trials allowed the
121
calculation of average preferred walking speed. A 10-minutes rest was provided for each participant
122
before proceeding to treadmill walking to minimise the effect of fatigue on their gait.
123
The treadmill condition included a 10 minute warm up and familiarity phase during which
124
preferred treadmill walking speed was determined by beginning at the average of overground
125
walking speed and then decreasing by 0.3km/h every 10 strides until participants reported that it
was uncomfortable to maintain normal walking. Speed was then decreased a further 0.3km/h and
127
then increased systematically by 0.3km/h until reported as being uncomfortably fast. This procedure
128
was repeated three times with the average of the six reported speeds taken as preferred walking
129
speed on the treadmill. This protocol for determining treadmill walking speed has been applied in
130
previous research.20-22 After a suitable rest participants walked at their determined speed for 10
131
minutes and 3-D motion data were continuously collected throughout the treadmill walking test for
132
analysis. All participants wore a safety harness when treadmill walking and their own flat, rubber
133
soled, walking shoes.
134
____________________________
135
Insert Figure 1 about here
136
____________________________
137
Data Acquisition and Analysis
138
Using an established procedure23 the distal end of most anterior toe part of a shoe and the
139
proximal inferior surface of the shoe out-sole (i.e. heel) were reconstructed to represent toe and heel
140
motion, respectively. Raw data of the markers and analogue data were low-pass filtered with a 4th
141
order zero-lag Butterworth Filter with a cut-off frequency of 15 Hz (e.g. Mathie et al.24). Average
142
overground preferred walking speed was calculated from all valid walkthrough trials using the heel
143
contact events. To identify heel contact and toe off in both walking surface conditions we applied a
144
foot velocity algorithm similar to that proposed by O’Connor et al.25
The validity of the method was
145
also supported by our own comparisons of kinematic and force plate data from the overground
146
walking trials. The dependent variables were the analysed spatio-temporal step parameters: step
147
velocity, step length, step width, and step time (including swing and double support). The
148
independent variables were walking surface (overground and treadmill), limb (dominant and
non-149
dominant), and age (young and older). Step velocity was calculated as step length divided by step
150
time for the two limbs separately. Displacement between successive contralateral heel contacts in
the anterior-posterior direction defined step length and in the medio-lateral direction, step width.
152
Step time was the time taken to complete one step. Each step parameter was measured separately
153
for the dominant and non-dominant limbs except step width. Step time comprises swing time and
154
double support time (Figure 1). As commonly employed in gait cycle analysis the swing phase was
155
the interval between ipsilateral toe off and heel contact, while double support was the interval
156
between contralateral heel contact and ipsilateral toe off. Swing time and double support time were
157
also normalised to a percentage of step time. A similar algorithm to that proposed by O’Connor et
158
al.25 was applied to obtain the timing of heel contact and toe off
159
A 2 X 2 X 2 (age x surface x limb) repeated measures mixed model Analysis of Variance
160
(ANOVA) design was applied to all spatial-temporal dependent variables. Age was the between
161
subject factor with surface and limb the within subject factors. F-ratios were accepted as significant
162
when computed p values were .05 or less (using SPSS 16.0, SPSS Inc., Chicago, IL, USA).
Post-163
hoc comparisons between means for significant interactions were analysed using Tukey’s
164
procedure.
165
Results
166
Mean walking speeds were; Overground, Young 1.23 m/s, Older 1.24 m/s and for Treadmill
167
Walking Young 1.26 m/s and Older 1.05 m/s. There were no main effects on walking speed for
168
either age or surface but an age x surface interaction (F (1, 18) = 5.0, p=.038) supported the above
169
observation that the older participants selected an equivalent preferred speed overground but were
170
significantly slower on the treadmill. Consistent with the walking speed data, young adults’ step
171
velocity was relatively constant across walking surfaces for both limbs and, as expected from the
172
walking speed analysis, an age x surface interaction was again obtained (F (1, 18) = 5.0, p = .038)
173
indicating that older adults’ step velocity was significantly lower in treadmill walking than
174
overground (Figure 2).
There was a limb effect on step velocity (F (1, 18) = 8.1, p = .011) but again, an age x limb
176
interaction (F (1, 18) = 11.6, p = .003) was obtained, such that older adults’ non-dominant step
177
velocity was significantly lower than their dominant limb in both the overground and treadmill
178
walking tasks.
179
Step length was longer in the young (F (1, 18) = 9.8, p = .006) and significantly shorter
180
when treadmill walking in both age groups (F (1, 18) = 8.8, p = .008). There was also a significant
181
difference between the limbs (F (1, 18) = 13.4, p = .002) due to shorter non-dominant steps but this
182
was observed only in the older group as revealed by a significant age x limb interaction (F (1, 18) =
183
15.9, p = .001). Step width was larger in the older adults for the both walking conditions (Figure 2).
184
The comparison between overground and treadmill walking of the older adults showed the marked
185
increase, but the difference did not achieve statistical significance (F (1, 18) = 4.3, p = .053).
186
Step time analysis found an age x surface interaction (F (1, 18) = 5.5, p = .031) with young
187
adults reducing step time while the older participants increased step time when treadmill walking.
188
Examination of the step cycle sub-components revealed age x surface interactions for double
189
support (F (1, 18) = 4.7, p = .044) and swing (F (1, 18) = 4.6, p = .047). Thus, increased absolute
190
step time in treadmill walking as a function of age was due to both support time and swing time
191
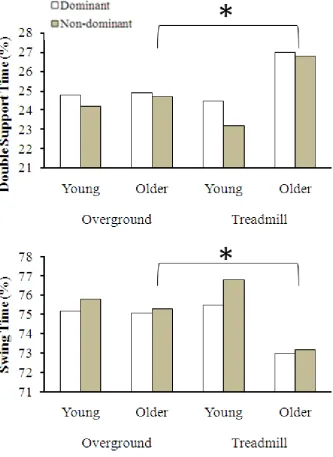
being extended. In addition, the proportion of double support in step time also increased
192
significantly in the older groups’ treadmill condition (age x surface, F (1, 18) = 5.6, p = .030) while
193
as a consequence percentage swing time decreased (Figure 3).
194
___________________________________
195
Insert Figures 2 and 3 about here
196
____________________________________
197
Discussion
198
In this experiment both age groups walked at the same speed overground and with the same
199
overground step velocity. In contrast, Whittle4 and others8, 26 reported lower average walking speeds
in older adults but older persons in their upper range walked faster than the mean for young adults.
201
The older participants in this study were healthy and physically active while other studies may have
202
had greater diversity within their selected ‘healthy’ older adult sample. The results here suggest that
203
when walking for a short duration at preferred speed on an unobstructed level surface, the effect of
204
ageing alone in the absence of gait pathology may not significantly reduce walking speed relative to
205
young controls.
206
When, in this study, the dominant and non-dominant step velocities were analysed separately,
207
older adults showed asymmetrically greater step velocity and step length in the dominant limb. This
208
result is consistent with previous work indicating that with age the dominant limb becomes
209
asymmetrically stronger despite an overall reduction in absolute strength (e.g., Perry et al.2). Slower
210
step velocity and shorter step length in the non-dominant limb may, therefore, be due to
age-211
specific asymmetry in lower limb kinetics. The accentuated asymmetry revealed in significantly
212
faster step velocity and longer step length in the older sample’s dominant limb could be interpreted
213
as evidence of an increased propulsive role consistent with the “functional asymmetry” hypothesis
214
discussed earlier. Confirming the non-dominant limb’s role in support is more problematic in that
215
both step width and double support potentially comprise a contribution from either limb or both
216
limbs. One limitation of the current study is that a limited number of step cycle parameters were
217
investigated and a more detailed account of gait cycle kinematics may be required to determine
218
more conclusively the non-dominant limb’s role in supporting gait. Further information to
219
complement the findings reported here would, therefore, be required to more strongly support the
220
hypothesised functional contribution by the non-dominant limb. It is, however, also possible that
221
the dominant limb could play the larger supporting role if it becomes stronger with ageing27 and in
222
that case the ‘functional asymmetry’ hypothesis would be revised accordingly.
223
As found in earlier work (e.g., Seeley et al.15) the young adults in this experiment did not
224
demonstrate functional differences between the two limbs; but it is noteworthy that earlier
investigators had not examined limb dominance effects on the kinematic characteristics of step
226
cycle parameters.
227
In addition to limb dominance brain laterality may also have influenced gait asymmetry. 11
228
Due to the limited number of left-limb dominant subjects, the current study could not effectively
229
explore the possibility of whether further classification into the right or left limb dominance would
230
reveal any evidence of brain laterality but this hypothesis could be usefully addressed in future
231
work.
232
In support of a previous treadmill gait validation study27 both age groups reduced step length
233
and in older subjects ambulation was slower than overground. The young adults, however,
234
significantly reduced step time (higher step frequency) to compensate reduced step length to
235
maintain the same walking velocity on both surfaces. In contrast, older adults prolonged step time
236
(lower step frequency) in addition to reducing step length, resulting in significantly slower step
237
velocity in treadmill walking. Double support time and swing time showed the age by surface
238
interaction similar to step time; in older participants double support and swing increased on the
239
treadmill while for young subjects the effect was opposite, with shorter double support and swing.
240
The proportion analysis revealed a significant increase in double support when older adults walked
241
on the treadmill while there were no age group differences on time-normalised double support in
242
overground walking. This finding is important in suggesting that physically active older adults, who
243
did not walk overground significantly slower than their young counterparts, may have increased
244
double support in response to the more destabilizing treadmill task. Reduction in step length and
245
associated step velocity also support this hypothesis because these responses have previously been
246
reported as safety-related adaptations.4, 7, 28, 29 Whittle4 identified typical age-related changes in
247
spatio-temporal parameters as including reduced step length and associated walking velocity,
248
increased step width and greater double support duration. These responses were also seen here
249
when comparing older adults’ overground walking to their treadmill gait. It is, therefore, reasonable
to conclude that treadmill walking challenged the healthy older adults recruited for this study. If the
251
link between spatio-temporal asymmetry and age-related gait deterioration is further confirmed,
252
portable gait assessment tools such as the Gaitrite system could be used in clinical settings to
253
identify individuals with higher falls risk.
254
In summary, the results supported the asymmetry hypothesis in older adults’ gait, with
255
significantly lower velocity and spatially shorter steps for the non-dominant limb on both surfaces,
256
supporting the ‘functional asymmetry’ hypothesis proposed by Sadeghi11 in which step asymmetry
257
is functional in assigning the dominant limb a primary role in progression while the non-dominant
258
limb stabilizes or “secures” gait. In the data presented here, however, there was no evidence to
259
support the proposition that the non-dominant limb serves a “gait securing” function. Older
260
individuals increased step time in treadmill walking while young controls decreased step time but
261
both groups decreased step length relative to overground locomotion. In older adults, relative to
262
overground gait, increased double support and reduced swing time (percentages) in both limbs were
263
found in treadmill walking.
References
265 266
1. Berg, W.R., Alessio, H.M., Mills, E.M., & Tong, C. (1997). Circumstances and consequences
267
of falls in independent community dwelling older adults. Age and Ageing, 26, 261-268.
268
[journal article]
269 270
2. Perry, M.C., Carville, S.F., Smith, I.C.H., Rugherford, O.M., & Newham, DiJ. (2007). Strength,
271
power output and symmetry of leg muscles: effect of age and history of falling. European
272
Journal of Applied Physiology, 100, 553-561. [journal article]
273
274
3. Kirkwood, R.N., Moreira, B.S., Vallone, M.L.D.C., Mingoti, S.A., Dias, R.C., & Sampaio, R.F.
275
(2010). Step length appears to be a strong discriminant gait parameter for elderly females
276
highly concerned about falls: across-sectional observational study. Physiotherapy, 97,
126-277
131. [journal article]
278
279
4. Whittle M. (2007). Gait analysis: an introduction. 4th edition. Butterworth-Heinemann
280
Elsevier.[entire book]
281 282
5. Brujin, S.M., vanDieёn, J.H., Meijer, O.G., & Beek, P.J. (2009). Is slow walking more stable?
283
Journal of Biomechanics, 42, 1506-1512. [journal article]
284
285
6. Espy, D.D., Yang, F., Bhatt, T., & Pai, Y-C. (2010). Independent influence of gait speed and
286
step length on stability and fall risk. Gait and Posture, 32, 378-382. [journal article]
287
288
7. Menz, H.B., Lord, S.R., & Fitzpatrick, R.C. (2007). A structural equation model relating
impaired sensorimotor function, fear of falling and gait patterns in older people. Gait and
290
Posture, 25, 243-249. [journal article]
291 292
8. Prince, F., Corriveau, H., Hebert, R., & Winter, D.A. (1997). Gait in the elderly: Review article.
293
Gait and Posture, 5, 158-135. [journal article]
294 295
9. Rochart, S., Bula, C.J., Martin, E., Seematter-Bagnoud, L., Karmaniola, A., Aminian, K., Piot-
296
Ziegler, C., & Santos-Eggimann, B. (2010). What is the relationship between fear of falling
297
and gait in well-functioning older persons aged 65 to 70 years? Archives of Physical
298
Medicine and Rehabilitation, 91, 879-884. [journal article]
299 300
10.Sadeghi, H., Allard, P., & Duhaime, M., (1997). Functional gait asymmetry in able-bodied
301
subjects. Human Movement Science. 16, 243-258. [journal article]
302 303
11.Sadeghi, H., Allard, P., Prince, F., & Labelle, H. (2000). Symmetry and limb dominance in
304
able-bodied gait: a review. Gait and Posture, 12, 34-45. [journal article]
305
306
12.Sadeghi, H. (2003). Local or global asymmetry in gait of people without impairments. Gait and
307
Posture, 17, 197-204. [journal article]
308 309
13.Du Chatinier, K., & Rozendal, R. (1970). Temporal symmetry gait of selected normal subjects.
310
Anatomy, 73, 353-361. [journal article]
311 312
14.Rosenrot, P. (1980). Asymmetry of gait and the relationship to lower limb dominance.
Proceeding of the special conference of the Canadian Society of Biomechanics, 26-27.
314
[conference paper]
315 316
15.Seeley, M.K., Umberger, B.R., & Shapiro, R. (2008). A test of the functional asymmetry
317
hypothesis in walking. Gait and Posture, 28, 24-28. [journal article]
318 319
16.Hill, K., Schwarz, J., Flicker, L., & Carroll, S. (1999). Falls among healthy, community-
320
dwelling, older women: a prospective study of frequency, circumstances, consequences and
321
prediction accuracy. Australian and New Zealand Journal of Public Health, 23, 41-48.
322
[journal article]
323 324
17.Di Fabio, R.P., Kurszewski, W.M., Jorgenson, E.E., & Kunz, R.C. (2004). Footlift asymmetry
325
during obstacle avoidance in high-risk elderly. Journal of American Geriatrics Society, 52,
326
2088-2093. [journal article]
327
328
18.Matsas, A., Taylor, N., & McBurney, H. (2000). Knee joint kinematics from familiarised
329
treadmill walking can be generalised to overground walking in young unimpaired subjects.
330
Gait and posture, 11, 469-53. [journal article]
331
332
19.Wass, E., Taylor, N., & Matsas, A. (2005). Familiarisation to treadmill walking in unimpaired
333
older people. Gait and Posture, 21, 72-79. [journal article]
334
335
20.Dingwell, F.N., & Marin, L.C. (2006). Kinematic variability and local dynamic stability of
336
upper body motions when walking at different speeds. Journal of Biomechanics, 39,
444-337
452. [journal article]
339
21.England, S.A., & Granata, K.P. (2007). The influence of gait speed on local dynamic stability of
340
walking. Gait and Posture, 25, 172-178. [journal article]
341 342
22.Jordan, K., Challis, J.H., & Newell, K.M. (2007). Walking speed influences on gait cycle
343
variability. Gait and Posture, 26, 128-134. [journal article]
344
345
23.Cappozzo, A., Della C.U., Leardini, A., & Chiari, L. (2005), Human movement analysis using
346
stereophotogrammetry: Part 1: theoretical background. Gait and Posture, 21, 186-196.
347
[journal article]
348 349
24.Mathie, M.J., Coster, A.C.F., HLovell, N., & GCeller, B. (2004). Accelerometry: providing an
350
intergrated practical method for long-term, ambulatory monitoring of human movement.
351
Physiological Measurement, 25, R1-R20. [journal article]
352
353
25.O'Connor, C.M., Thorpe, S.K., O'Malley, M.J., & Vaughan, C.L. (2007). Automatic detection
354
of gait events using kinematic data. Gait and Posture, 25, 469-474. [journal article]
355
356
26.Kerrigan, D., Lee, L., Collins, J., Riley, R., & Lipsitz, L. (2001). Reduced hip extension during
357
walking: Healthy elderly and fallers versus young adults. Archives of Physical Medicine and
358
Rehabilitation, 82, 26-30. [journal article]
359
360
27.Riley, P.O., Paolini, G., Croce, U.D., Paylo, K.W., & Kerrigan, D.C. (2007). A kinematic and
361
kinetic comparison of overground and treadmill walking in healthy subjects. Gait and
362
Posture, 26, 17-24. [journal article]
364
28.Herman, T., Giladi, N., Gurevich, T., & Hausdorff, J.M. (2005). Gait instability and fractal
365
dynamics of older adults with a “cautious” gait: why do certain older adults walk fearfully?
366
Geriatric Nursing, 23, 250-257. [journal article]
367
368
29.Kang, H.G., Dingwell, J.B. (2008). Separating the effects of age and walking speed on gait
369
variability, Gait and Posture, 27, 572-577. [journal article]
372
Figure Captions
373 374
Figure 1. The stance and swing phases of a complete walking cycle defined by successive heel
375
contacts of the same limb. Steps are identified for the dominant (D) and non-dominant (N)
376
limbs with each step subdivided into double support time (DST) and swing time (SwgT).
377
Step length is the anterior-posterior displacement of one step; step time is the time to
378
complete one step, the sum of DST and SwgT
379 380
Figure 2. Dominant and non-dominant step parameters for treadmill and overground walking at
381
self-selected speed for older adults and young controls. An asterisk (*) indicates a
382
significant between-limb difference associated with an age x limb interaction; error bars
383
indicate one standard deviation. Figure 2A: step velocity, step length, and step width;
384
Figure 2B: step time, double support time and swing time.
385
386
Figure 3. Double support time and swing time (%) relative to step time (100%) for dominant and
387
non-dominant steps; conventions as in Figure 2. Asterisk (*) indicates significant age x
388
surface interaction.
389
Figure 1
391 392 393
Figure 2
396
Figure 3
400 401 402