International Journal of COPD 2016:11 2457–2465
International Journal of COPD
Dove
press
submit your manuscript | www.dovepress.com 2457
O r I g I n a l r e s e a r C h
open access to scientific and medical research
Open access Full Text article
Characterization of sputum biomarkers for
asthma–COPD overlap syndrome
Jing gao1
hiroshi Iwamoto2
Jukka Koskela3
harri alenius4
noboru hattori2
nobuoki Kohno5
Tarja laitinen6
Witold Mazur1
Ville Pulkkinen1
1heart and lung Center, University
of helsinki and helsinki University hospital, helsinki, Finland;
2Department of Molecular and
Internal Medicine, graduate school of Biomedical sciences, hiroshima University, hiroshima, Japan; 3Clinical
research Unit of Pulmonary Diseases and Division of Pulmonology, heart and lung Center, University of helsinki and helsinki University hospital, 4Unit of systems Toxicology,
Finnish Institute of Occupational health, helsinki, Finland; 5hiroshima
Cosmopolitan University, hiroshima, Japan; 6Department of Pulmonary
Diseases and Clinical allergology, Turku University hospital, University of Turku, Turku, Finland
Abstract: Asthma–COPD overlap syndrome (ACOS) is a commonly encountered chronic airway disease. However, ACOS is still a consensus-based clinical phenotype and the under-lying inflammatory mechanisms are inadequately characterized. To clarify the inflammatory mediatypical for ACOS, five biomarkers, namely interleukin (IL)-13, myeloperoxidase (MPO), neutrophil gelatinase-associated lipocalin (NGAL), chitinase-like protein (YKL-40), and IL-6, were selected. This study hypothesized that sputum biomarkers relevant for airway inflammation in asthma (IL-13), COPD (MPO, NGAL), or in both asthma and COPD (YKL-40, IL-6) could be used to differentiate ACOS from COPD and asthma. The aim of this study was to charac-terize the inflammatory profile and improve the recognition of ACOS. Induced sputum levels of IL-13, MPO, NGAL, YKL-40, and IL-6 were measured by enzyme-linked immunosorbent assay/Luminex assay in a Finnish discovery cohort (n=90) of nonsmokers, smokers, and patients with asthma, COPD, and ACOS and validated in a Japanese cohort (n=135). The classification accuracy of potential biomarkers was compared with area under the receiver operating charac-teristic curves. Only sputum NGAL levels could differentiate ACOS from asthma (P,0.001 and P,0.001) and COPD (P,0.05 and P=0.002) in the discovery and replication cohorts, respectively. Sputum NGAL levels were independently correlated with the percentage of pre-bronchodilator forced expiratory volume in 1 second predicted in multivariate analysis in the discovery and replication cohorts (P=0.001 and P=0.002, respectively). In conclusion, sputum biomarkers reflecting both airway inflammation and remodeling of the tissue show potential in differentiation between asthma, COPD, and ACOS.
Keywords: COPD pathology, asthma, ACOS
Introduction
The asthma–COPD overlap syndrome (ACOS) has recently been recognized as a consensus-based clinical phenotype sharing the features of asthma and COPD.1–3 Approximately 20%–50% of patients with irreversible airway obstruction show airflow variability characteristic to asthma.4–7 Differential diagnosis of ACOS from asthma and COPD is increasingly important, since ACOS has a poor prognosis and different treatment guidelines. ACOS is associated with low health-related quality of life,6 increased exacerbation rate and hospital admissions, a rapid decline in lung function, and high mortality.5,6,8 However, ACOS cannot be diagnosed unambiguously on the basis of lung function tests, patients’ demographics, and sputum cell counts or by imaging of the lungs.6,9,10 There is an unmet need to develop novel diagnostic biomarkers for clinical assessment of ACOS.
Although the inflammatory pathways of asthma and COPD are markedly different,11,12 they coincide in ACOS, and both eosinophils and neutrophils in sputum are characteristic for ACOS. Clinically, the main interest would be to identify those Correspondence: Ville Pulkkinen
University of helsinki, Biomedicum, PO Box 63, 00014, helsinki, Finland Tel +358 50 427 0555
email ville.pulkkinen@helsinki.fi
Journal name: International Journal of COPD Article Designation: Original Research Year: 2016
Volume: 11
Running head verso: Gao et al
Running head recto: Sputum biomarkers for ACOS DOI: http://dx.doi.org/10.2147/COPD.S113484
International Journal of Chronic Obstructive Pulmonary Disease downloaded from https://www.dovepress.com/ by 118.70.13.36 on 22-Aug-2020
For personal use only.
Number of times this article has been viewed
This article was published in the following Dove Press journal: International Journal of COPD
Dovepress gao et al
patients with ACOS who could be responsive to inhaled corticosteroids.13 For this, the assessment of fractional exhaled nitric oxide or immunoglobulin E in COPD patients could be useful.14 For the current study, interleukin (IL)-13,15,16 which is a T-helper 2 type marker known to be important in eosino-philic inflammation and asthma, was analyzed. In addition, chitinase-like protein (YKL-40),17,18 which is elevated in both asthma and COPD, was selected.19 IL-6 was selected because its serum and sputum levels are associated with impaired lung function,15,20,21 and elevated serum IL-6 levels were detected in patients with ACOS.22 In addition, myeloperoxi-dase (MPO) and neutrophil gelatinase-associated lipocalin (NGAL) were assessed based on the authors’ earlier findings that suggested enhanced neutrophil-mediated inflammation and/or airway epithelial injury in ACOS.9
This study hypothesized that sputum biomarkers relevant for airway inflammation in asthma (IL-13), COPD (MPO, NGAL), or in both asthma and COPD (YKL-40, IL-6) could be used to differentiate ACOS from COPD and asthma and further could be used to improve the determination and recognition of ACOS.
Subjects and methods
subjects
The discovery cohort consisted of 90 volunteer individuals who were a part of the cohort previously reported in Iwamoto et al.9 The cohort size was smaller than the original one because of the consumption of sputum samples. The patients, who were a part of the longitudinally followed cohort of Finnish asthma and COPD patients (FinnCADStudy),6,9,23 were recruited from the Helsinki University Hospital. Based on their medical history and self-reported questionnaire data, the subjects were categorized into five groups: healthy nonsmokers (NSs, n=14), healthy smokers (HSs, n=14), and patients with asthma (n=24), COPD (n=20), and ACOS (n=18). Spirometry with a bronchodilator test and the diffus-ing capacity of the lung for carbon monoxide were performed on all participants. The control subjects (NSs and HSs) consisted of responders to an advertisement in the Helsinki University Hospital and the local media. These participants were asymptomatic, never, or current smokers with no history of lung disease confirmed by a normal lung function with post-bronchodilator forced expiratory volume in 1 second (FEV1)/forced vital capacity (FVC) $0.7 in spirometry.
The diagnosis of asthma was based on the British Guidelines on Asthma Management24 and defined as revers-ible airflow obstruction with a post-bronchodilator FEV1/ FVC $0.7, with one or more of the following findings: a
post-bronchodilator increase in FEV1 of $12%, a broncho-dilator response of $15% or diurnal variation of $20% in peak expiratory flow recording, moderate-to-severe bronchial hyperreactivity, or a decrease in FEV1 of $15% in the exer-cise test. COPD was diagnosed according to the American Thoracic Society/European Respiratory Society Task Force recommendations23,25,26 and defined by incompletely reversible airflow obstruction with a post-bronchodilator FEV1/ FVC ,0.7.1 ACOS was identified by the features that it shares with both asthma and COPD according to the Global Initiative for Asthma guidelines2 and Global Initiative for Obstructive Lung Diseases strategy.1 In the ACOS group, the age of onset was .40 years and all the patients had history of smoking. The patients with ACOS had increased airflow variability and incompletely reversible airflow obstruction. Patients with COPD and ACOS had no history of alpha-1- antitrypsin deficiency in their family. All patients had respiratory symptoms and were current or former smokers (.10 pack-years) when developed their lung disease. None of the patients received oral glucocorticoid treatment or experienced an exacerbation during the study period. Signs of atopy were not included in the diagnostic criteria.
The Japanese replication cohort (n=135) consisted of NSs (n=22), HSs (n=40), and patients with asthma (n=21), COPD (n=35), and ACOS (n=17). The diagnosis of asthma was assessed by specialists in respiratory medicine using the Global Initiative for Asthma guidelines.2 COPD diagnosis was based on long-term smoking (.10 pack-years) and a pre-bronchodilator FEV1/FVC ,0.7.1,27,28 The individuals in the ACOS group consisted of patients who had been diagnosed with both asthma and COPD. All the patients with asthma, COPD, and ACOS were in stable condition and were using regular inhaled medications. For healthy control subjects, only prebronchodilator spirometries were performed, and their prebronchodilator FEV1/FVC values were .0.7.
This study was approved by the Ethics Committees of Helsinki University Central Hospital and Hiroshima University and conducted in accordance with the ethical standards established in the 1975 Declaration of Helsinki. All participants provided written informed consent.
sampling of sputum
Sputum was induced by inhalation of hypertonic saline and treated with dithioerythritol (Sigma-Aldrich Co., St Louis, MO, USA) as recommended by the European Respiratory Society Task Force and described earlier in detail.9,29,30 The supernatant was frozen at −80°C for biochemical analyses. Cell viability was studied with Trypan blue in a Burker
International Journal of Chronic Obstructive Pulmonary Disease downloaded from https://www.dovepress.com/ by 118.70.13.36 on 22-Aug-2020
Dovepress sputum biomarkers for aCOs
chamber.31 Cytocentrifuge preparations were made by Cytospin (Shandon Cytospin 3) and centrifuged at 450 rpm for 6 minutes. The slides were stained with May–Grunwald– Giemsa solution (EMD Millipore, Billerica, MA, USA) for cell differential counts. Detailed cell profiles were assessed based on 400 cells counted from each slide. Only the repre-sentative samples with ,70% of squamous epithelial cells were accepted for the assessments.9,31 The slides were frozen at −20°C. Induction of the sputum samples in the Japanese cohort has been described earlier.32
enzyme-linked immunosorbent assay
and luminex assays
YKL-40 was measured by Quantikine ELISA (R&D Systems, Inc., Minneapolis, MN, USA), IL-6 by Magnetic Human High Sensitivity Luminex assay (R&D Systems, Inc.), IL-13 by enzyme-linked immunosorbent assay (ELISA; USCN Life Science Inc., Wuhan, People’s Republic of China), MPO by ELISA (Abnova Inc., Walnut, CA, USA), and NGAL by ELISA (USCN Life Science Inc.) according to the manufacturers’ instructions. The minimal detectable dose for YKL-40, IL-6, IL-13, MPO, and NGAL were 3.55 pg/mL, 0.14 pg/mL, 5.7 pg/mL, 0.78 ng/mL, and 17 pg/mL, respectively. The analysis of MPO and NGAL in the discovery cohort has been performed earlier but added in the present analysis to identify the most informative panel of biomarkers.9
statistical analysis
The demographics are expressed as mean ± standard devia-tion, and the biomarker concentrations as medians with interquartile range. All statistical analyses were performed with the SPSS 20.0 software program (IBM Corporation, Armonk, NY, USA). Comparisons between groups were evaluated by the Kruskal–Wallis test followed by the Mann– Whitney U test, when appropriate. Sputum biomarkers were further analyzed by the area under the curve (AUC) statistics for their predictive capability to distinguish ACOS from asthma, and ACOS and asthma from COPD or NSs. Spear-man’s correlations of the induced sputum marker levels with age, lung function, and sputum cell counts were calculated. Multivariate stepwise regression analysis was performed to obtain the variables to model ACOS. Due to the differences in sputum processing, such as a single versus three times inhalation of hypertonic saline in the discovery and repli-cation cohort, respectively, the concentrations of sputum biomarkers were not directly comparable between the two cohorts. To make the comparison feasible, raw data was
used in the comparisons within each cohort and standardized data (Z-scores) in the comparisons between the two cohorts.
P-values of ,0.05 were considered statistically significant.
Results
subject characteristics
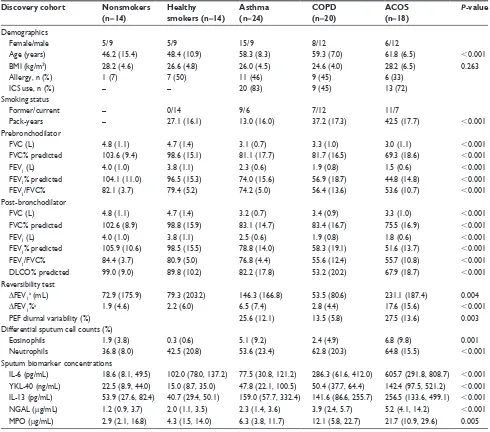
The characteristics of the study subjects in the discovery cohort are shown in Table 1. Healthy controls were ∼10 years younger than the patients. Patients with COPD and ACOS had more pack-years and significantly lower FEV1, FEV1/FVC ratio, and diffusing capacity of the lung for car-bon monoxide compared with those in the NS and asthma groups (Table 1). The patients with ACOS had significant reversibility in the bronchodilation test and diurnal variation of peak expiratory flow compared with those among the COPD patients. None of the participants had experienced an exacerbation or a respiratory tract infection within a month prior the study.
Successfully induced sputum samples were obtained from 90 individuals. The representativeness of samples was confirmed by cytospincentrifugation cell profiles. As expected, patients in the asthma (n=24) and ACOS (n=18) groups had a higher percentage of sputum eosinophil com-pared with that in the HS group (n=14). In addition, COPD (n=20) and ACOS groups had a higher percentage of sputum neutrophils compared with that in the NS (n=14) and HS groups (Table 1).
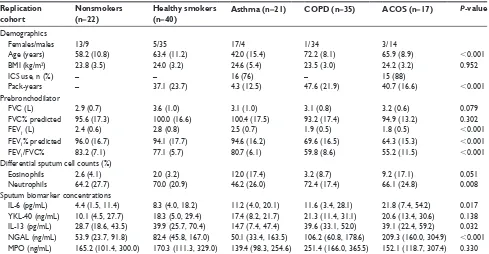
The characteristics of the study subjects in the replication cohort are shown in Table 2. There were no differences in pre-FEV1/FVC, pack-years, neutrophil%, and eosinophil% between the patients with ACOS in the replication and in the discovery cohorts. However, patients with ACOS had greater pre-FEV1% and pre-FVC% values in the replication cohort than in the discovery cohort (P=0.001 and P,0.001, respectively).
sputum MPO and Il-13 were elevated
in aCOs when compared with healthy
controls
The sputum levels of MPO and IL-13 were significantly increased in the ACOS groups when compared with the levels in the NS (P=0.012 and P,0.001, respectively) and HS groups (P=0.008 and P,0.001, respectively; Table 1). There was also a significant difference in sputum MPO levels between the ACOS and asthma groups (P=0.004). However, the sputum MPO and IL-13 levels could not distinguish ACOS from COPD (P=0.128 and P=0.088, respectively).
International Journal of Chronic Obstructive Pulmonary Disease downloaded from https://www.dovepress.com/ by 118.70.13.36 on 22-Aug-2020
Dovepress gao et al
sputum YKl-40, Il-6, and ngal were
elevated in aCOs when compared with
COPD and asthma
The sputum levels of YKL-40, IL-6, and NGAL were significantly increased in ACOS when compared with the NS (P,0.001, P,0.001, P,0.001, respectively) and HS groups (P,0.001, P=0.001, and P=0.001, respectively; Table 1). In addition, the sputum levels of YKL-40, IL-6, and NGAL were significantly increased in ACOS when com-pared with the asthma (P=0.001, P,0.001, and P,0.001, respectively) and COPD groups (P=0.002, P=0.006, and
P=0.026, respectively). Sputum IL-6 and NGAL were also
significantly increased in the COPD group when compared with the asthma group (P=0.034 and P=0.025, respectively), while sputum YKL-40 levels were not significantly different between the COPD and asthma groups (P.0.05).
sputum YKl-40, Il-6, and ngal
could differentiate aCOs from COPD
and asthma
A receiver operating characteristic curve analysis was car-ried out to evaluate the sensitivity, specificity, and diagnostic accuracy of the classical variables and the novel biomarkers (Table 3). All tested sputum biomarkers (MPO, NGAL, Table 1 Clinical characteristics and biomarker concentrations of the study subjects across the discovery cohort (n=90)
Discovery cohort Nonsmokers
(n=14)
Healthy
smokers (n=14)
Asthma (n=24)
COPD (n=20)
ACOS (n=18)
P-value
Demographics
Female/male 5/9 5/9 15/9 8/12 6/12
age (years) 46.2 (15.4) 48.4 (10.9) 58.3 (8.3) 59.3 (7.0) 61.8 (6.5) ,0.001
BMI (kg/m2) 28.2 (4.6) 26.6 (4.8) 26.0 (4.5) 24.6 (4.0) 28.2 (6.5) 0.263
allergy, n (%) 1 (7) 7 (50) 11 (46) 9 (45) 6 (33)
ICs use, n (%) – – 20 (83) 9 (45) 13 (72)
smoking status
Former/current – 0/14 9/6 7/12 11/7
Pack-years – 27.1 (16.1) 13.0 (16.0) 37.2 (17.3) 42.5 (17.7) ,0.001
Prebronchodilator
FVC (l) 4.8 (1.1) 4.7 (1.4) 3.1 (0.7) 3.3 (1.0) 3.0 (1.1) ,0.001
FVC% predicted 103.6 (9.4) 98.6 (15.1) 81.1 (17.7) 81.7 (16.5) 69.3 (18.6) ,0.001
FeV1 (l) 4.0 (1.0) 3.8 (1.1) 2.3 (0.6) 1.9 (0.8) 1.5 (0.6) ,0.001
FeV1% predicted 104.1 (11.0) 96.5 (15.3) 74.0 (15.6) 56.9 (18.7) 44.8 (14.8) ,0.001
FeV1/FVC% 82.1 (3.7) 79.4 (5.2) 74.2 (5.0) 56.4 (13.6) 53.6 (10.7) ,0.001
Post-bronchodilator
FVC (l) 4.8 (1.1) 4.7 (1.4) 3.2 (0.7) 3.4 (0.9) 3.3 (1.0) ,0.001
FVC% predicted 102.6 (8.9) 98.8 (15.9) 83.1 (14.7) 83.4 (16.7) 75.5 (16.9) ,0.001
FeV1 (l) 4.0 (1.0) 3.8 (1.1) 2.5 (0.6) 1.9 (0.8) 1.8 (0.6) ,0.001
FeV1% predicted 105.9 (10.6) 98.5 (15.5) 78.8 (14.0) 58.3 (19.1) 51.6 (13.7) ,0.001
FeV1/FVC% 84.4 (3.7) 80.9 (5.0) 76.8 (4.4) 55.6 (12.4) 55.7 (10.8) ,0.001
DlCO% predicted 99.0 (9.0) 89.8 (10.2) 82.2 (17.8) 53.2 (20.2) 67.9 (18.7) ,0.001
reversibility test
ΔFeV1a (ml) 72.9 (175.9) 79.3 (203.2) 146.3 (166.8) 53.5 (80.6) 231.1 (187.4) 0.004
ΔFeV1%a 1.9 (4.6) 2.2 (6.0) 6.5 (7.4) 2.8 (4.4) 17.6 (15.6) ,0.001
PeF diurnal variability (%) 25.6 (12.1) 13.5 (5.8) 27.5 (13.6) 0.003
Differential sputum cell counts (%)
eosinophils 1.9 (3.8) 0.3 (0.6) 5.1 (9.2) 2.4 (4.9) 6.8 (9.8) 0.001
neutrophils 36.8 (8.0) 42.5 (20.8) 53.6 (23.4) 62.8 (20.3) 64.8 (15.5) ,0.001
sputum biomarker concentrations
Il-6 (pg/ml) 18.6 (8.1, 49.5) 102.0 (78.0, 137.2) 77.5 (30.8, 121.2) 286.3 (61.6, 412.0) 605.7 (291.8, 808.7) ,0.001 YKl-40 (ng/ml) 22.5 (8.9, 44.0) 15.0 (8.7, 35.0) 47.8 (22.1, 100.5) 50.4 (37.7, 64.4) 142.4 (97.5, 521.2) ,0.001 Il-13 (pg/ml) 53.9 (27.6, 82.4) 40.7 (29.4, 50.1) 159.0 (57.7, 332.4) 141.6 (86.6, 255.7) 256.5 (133.6, 499.1) ,0.001 ngal (µg/ml) 1.2 (0.9, 3.7) 2.0 (1.1, 3.5) 2.3 (1.4, 3.6) 3.9 (2.4, 5.7) 5.2 (4.1, 14.2) ,0.001 MPO (µg/ml) 2.9 (2.1, 16.8) 4.3 (1.5, 14.0) 6.3 (3.8, 11.7) 12.1 (5.8, 22.7) 21.7 (10.9, 29.6) 0.005
Notes: The demographics are presented as mean (sD) unless otherwise stated. The biomarker concentrations are presented as medians (IQr). P-value for the differences was analyzed by Kruskal–Wallis H test. Δ, change in. aImprovement in FeV
1 after 400 µg of salbutamol.
Abbreviations: aCOs, asthma–COPD overlap syndrome; BMI, body mass index; DlCO, diffusing capacity of the lung for carbon monoxide; FeV1, forced expiratory volume
in 1 second; FVC, forced vital capacity; ICs, inhaled corticosteroids; Il, interleukin; IQr, interquartile range; MPO, myeloperoxidase; ngal, neutrophil gelatinase-associated
lipocalin; PEF, peak expiratory flow; SD, standard deviation; YKL-40, chitinase-3-like protein 1.
International Journal of Chronic Obstructive Pulmonary Disease downloaded from https://www.dovepress.com/ by 118.70.13.36 on 22-Aug-2020
Dovepress sputum biomarkers for aCOs
YKL-40, IL-6, and IL-13) could distinguish ACOS sig-nificantly from the other non-ACOS groups (AUC .0.7). Importantly, sputum biomarkers YKL-40, IL-6, and NGAL could distinguish ACOS significantly from both asthma and COPD (AUC .0.7). In addition, sputum MPO levels could differentiate ACOS from asthma, but not ACOS from COPD. Sputum IL-13 levels did not significantly separate ACOS from asthma or ACOS from COPD.
relationships between the sputum
biomarkers and clinical characteristics
The study subjects in the asthma, COPD, and ACOS groups were pooled to analyze the correlations between biomarker concentrations as the dependent factor and clinical variables. Multivariate analysis revealed pack-years and age to be the independent predictors for sputum MPO, whereas age and pre-FEV1% were independent predictors for YKL-40 Table 2 Clinical characteristics and biomarker concentrations of the study subjects across the replication cohort (n=135)
Replication cohort
Nonsmokers (n=22)
Healthy smokers (n=40)
Asthma (n=21) COPD (n=35) ACOS (n=17) P-value
Demographics
Females/males 13/9 5/35 17/4 1/34 3/14
age (years) 58.2 (10.8) 63.4 (11.2) 42.0 (15.4) 72.2 (8.1) 65.9 (8.9) ,0.001
BMI (kg/m2) 23.8 (3.5) 24.0 (3.2) 24.6 (5.4) 23.5 (3.0) 24.2 (3.2) 0.952
ICs use, n (%) – – 16 (76) – 15 (88)
Pack-years – 37.1 (23.7) 4.3 (12.5) 47.6 (21.9) 40.7 (16.6) ,0.001
Prebronchodilator
FVC (l) 2.9 (0.7) 3.6 (1.0) 3.1 (1.0) 3.1 (0.8) 3.2 (0.6) 0.079
FVC% predicted 95.6 (17.3) 100.0 (16.6) 100.4 (17.5) 93.2 (17.4) 94.9 (13.2) 0.302
FeV1 (l) 2.4 (0.6) 2.8 (0.8) 2.5 (0.7) 1.9 (0.5) 1.8 (0.5) ,0.001
FeV1% predicted 96.0 (16.7) 94.1 (17.7) 94.6 (16.2) 69.6 (16.5) 64.3 (15.3) ,0.001
FeV1/FVC% 83.2 (7.1) 77.1 (5.7) 80.7 (6.1) 59.8 (8.6) 55.2 (11.5) ,0.001
Differential sputum cell counts (%)
eosinophils 2.6 (4.1) 2.0 (3.2) 12.0 (17.4) 3.2 (8.7) 9.2 (17.1) 0.051
neutrophils 64.2 (27.7) 70.0 (20.9) 46.2 (26.0) 72.4 (17.4) 66.1 (24.8) 0.008
sputum biomarker concentrations
Il-6 (pg/ml) 4.4 (1.5, 11.4) 8.3 (4.0, 18.2) 11.2 (4.0, 20.1) 11.6 (3.4, 28.1) 21.8 (7.4, 54.2) 0.017 YKl-40 (ng/ml) 10.1 (4.5, 27.7) 18.3 (5.0, 29.4) 17.4 (8.2, 21.7) 21.3 (11.4, 31.1) 20.6 (13.4, 30.6) 0.138 Il-13 (pg/ml) 28.7 (18.6, 43.5) 39.9 (25.7, 70.4) 14.7 (7.4, 47.4) 39.6 (33.1, 52.0) 39.1 (22.4, 59.2) 0.032 ngal (ng/ml) 53.9 (23.7, 91.8) 82.4 (45.8, 167.0) 50.1 (33.4, 163.5) 106.2 (60.8, 178.6) 209.3 (160.0, 304.9) ,0.001 MPO (ng/ml) 165.2 (101.4, 300.0) 170.3 (111.3, 329.0) 139.4 (98.3, 254.6) 251.4 (166.0, 365.5) 152.1 (118.7, 307.4) 0.330
Notes: The demographics are presented as mean (sD) unless otherwise stated. The biomarker concentrations are presented as medians (IQr). P-value for the differences was analyzed by Kruskal–Wallis H test. Comparisons between groups were evaluated by the Kruskal–Wallis test followed by the Mann–Whitney U test.
Abbreviations: aCOs, asthma–COPD overlap syndrome; BMI, body mass index; FeV1, forced expiratory volume in 1 second; FVC, forced vital capacity; ICs, inhaled
corticosteroids; Il, interleukin; IQr, interquartile range; MPO, myeloperoxidase; ngal, neutrophil gelatinase-associated lipocalin; sD, standard deviation; YKl-40, chitinase-3-like protein 1.
Table 3 rOC analysis for sputum biomarkers in the discovery cohort
Discovery cohort IL-6 (pg/mL) YKL-40 (ng/mL) IL-13 (pg/mL) NGAL (µg/mL) MPO (µg/mL)
aCOs versus non-aCOs
aUC (95% CI) 0.887 (0.813–0.962) 0.854 (0.749–0.959) 0.753 (0.636–0.870) 0.814 (0.697–0.932) 0.737 (0.590–0.883)
Optimal threshold .200.5 .90.4 .99.7 .4.0 .14.5
Sensitivity/specificity 0.938/0.757 0.833/0.845 0.882/0.515 0.833/0.750 0.706/0.789
P-value ,0.001 ,0.001 0.001 ,0.001 0.003
aCOs versus COPD
aUC (95% CI) 0.772 (0.617–0.926) 0.794 (0.638–0.951) 0.665 (0.486–0.844) 0.711 (0.541–0.881) 0.647 (0.460–0.834)
Optimal threshold .479.8 .78.9 .175.2 .4.0 .14.3
Sensitivity/specificity 0.625/0.850 0.833/0.800 0.647/0.700 0.833/0.600 0.706/0.650
P-value 0.006 0.002 0.088 0.026 0.128
aCOs versus asthma
aUC (95% CI) 0.930 (0.853–1.000) 0.814 (0.681–0.947) 0.638 (0.463–0.812) 0.833 (0.704–0.963) 0.767 (0.598–0.937)
Optimal threshold .199.5 .90.4 .377.8 .3.8 .14.2
Sensitivity/specificity 0.938/0.875 0.833/0.750 0.412/0.864 0.833/0.792 0.706/0.917
P-value ,0.001 0.001 0.145 ,0.001 0.004
Abbreviations: ACOS, asthma–COPD overlap syndrome; AUC, area under the curve; CI, confidence interval; IL, interleukin; MPO, myeloperoxidase; NGAL, neutrophil
gelatinase-associated lipocalin; rOC, receiver operating characteristic; YKl-40, chitinase-3-like protein 1.
International Journal of Chronic Obstructive Pulmonary Disease downloaded from https://www.dovepress.com/ by 118.70.13.36 on 22-Aug-2020
Dovepress gao et al
(Table 4). Sputum IL-6 was an independent predictor for pre-FEV1% predicted and pack-years, and sputum NGAL was independently associated with pre-FEV1% predicted (Table 4 and Figure 1A and B).
Validation of the findings in an
independent replication data set
The clinical data and the levels of sputum biomarkers (MPO, NGAL, YKL-40, IL-6, and IL-13) in the replication
cohort are shown in Table 2. Sputum neutrophil% count was significantly different between the groups (P=0.008), and eosinophil% count showed a tendency of differences between the groups (P=0.051).
In the replication cohort, sputum IL-6, NGAL, and IL-13 levels had statistically significant differences between the study groups (Table 2). The sputum levels of IL-6 and NGAL were significantly increased in ACOS when compared with the NS (P=0.001 and P,0.001, respectively) and the HS groups (P=0.018 and P,0.001, respectively) (Table 2). Importantly, only sputum NGAL levels were elevated in ACOS when compared with the COPD (P=0.002) and asthma (P,0.001) groups (Figure 2) and had an increasing trend in COPD when compared with those in the asthma group (P=0.068). Other sputum biomarkers did not differ significantly between ACOS and asthma or between ACOS and COPD in the replication cohort, but there was a significant difference in sputum IL-13 levels between asthma and COPD (P=0.025).
NGAL levels could differentiate ACOS from the other study participants (non-ACOS) with an AUC value of 0.827 (95% CI: 0.727–0.926, P,0.001) in the replication cohort. In addition, sputum NGAL could differentiate ACOS from the COPD and asthma groups with AUC values of 0.794 (95% CI: 0.629–0.924, P=0.002) and 0.840 (95% CI: 0.717–0.964,
P,0.001), respectively.
The asthma, COPD, and ACOS groups in the replication cohort were pooled to analyze the correlations in the univariate Table 4 Multivariate stepwise analysis of all subjects with sputum
biomarker as the dependent variable in patients with asthma, COPD, and aCOsa
Discovery cohort β t P-value
sputum Il-6
Pre-FeV1% predicted −0.309 −2.381 0.021
Pack-years 0.262 2.018 0.049
sputum ngal
Pre-FeV1% predicted −0.420 3.498 0.001
sputum YKl-40
age (years) 0.283 2.257 0.028
Pre-FeV1% predicted −0.273 2.183 0.033
sputum MPO
Pack-years 0.390 3.304 0.002
age (years) 0.282 2.388 0.020
Notes:aMultivariate analysis was adjusted for age, body mass index, pack-years, and
all the significant variables in the univariate analysis.
Abbreviations: aCOs, asthma–COPD overlap syndrome; FeV1, forced expiratory
volume in 1 second; Il, interleukin; MPO, myeloperoxidase; ngal, neutrophil gelatinase-associated lipocalin; YKl-40, chitinase-3-like protein 1.
$VWKPD &23' $&26
5OLQHDU
3UH)(9SUHGLFWHG
6SXWXP1*$/
QJP/
5OLQHDU
3UH)(9SUHGLFWHG
6SXWXP1*$/
JP/
$
%
Figure 1 Correlation of sputum ngal with pre-FeV1% predicted in patients with asthma, COPD, and aCOs in the discovery (A) and in the replication cohorts (B). Abbreviations: aCOs, asthma–COPD overlap syndrome; FeV1, forced expiratory volume in 1 second; ngal, neutrophil gelatinase-associated lipocalin.
International Journal of Chronic Obstructive Pulmonary Disease downloaded from https://www.dovepress.com/ by 118.70.13.36 on 22-Aug-2020
Dovepress sputum biomarkers for aCOs
and multivariate analyses. Sputum YKL-40 and sputum IL-6 did not correlate with any clinical parameters. Multivariate analysis revealed that sputum IL-13 correlated with pack-years and sputum MPO correlated with neutrophil% count. In agreement with the results from the discovery cohort, NGAL levels independently correlated with pre-FEV1% predicted in the replication cohort (P=0.002, Figure 1B).
Discussion
This study analyzed the biomarkers related to asthma or COPD or implicated in both diseases to discover inflamma-tory profiles typical for ACOS in two independent cohorts. The levels of sputum IL-13 and MPO were higher in the ACOS patients than in the healthy controls in the discovery cohort, but this was not apparent in the replication cohort. In both cohorts, the sputum levels of NGAL, IL-6, and YKL-40 were elevated in ACOS when compared with those of NSs. However, only sputum NGAL could differentiate ACOS from COPD and asthma in both cohorts.
The most recent treatment guidelines present features that characterize ACOS rather than provide a formal definition of ACOS.33 Four distinct pathways have been proposed for ACOS.34 Airflow limitation in early life can persist through adolescence into adulthood and ACOS is more likely than severe asthma if other risk factors, such as smoking, are present. A second pathway is represented in COPD patients with substantial smoking histories or other exposures and late-onset features of asthma. A third asthma-dominant pathway is represented by asymptomatic adults with air-way hyperresponsiveness who progress to chronic airflow limitation compatible with a diagnosis of COPD. Finally, a fourth pathway recognizes the link between early-life risk
factors and small lungs, with an increased risk of develop-ment of fixed airflow limitation and asthma. Thus, from the molecular genetic point of view, ACOS can represent a very heterogeneous group of patients. All patients with ACOS in the discovery cohort were either current or former smokers. There were eleven patients who mostly represent the second COPD-dominant pathway in the discovery cohort, and seven patients who developed fixed airway limitation after asthma diagnosis. There was more variation in the biomarker levels in the replication cohort than in the discovery cohort suggest-ing that there may be more etiological variability between the patients. The final goal would be to identify a panel of markers with the optimal capability to dissect the endotypes valid for prognosis and in treatment choices.
Elevated IL-6 and YKL-40 levels were observed in patients with ACOS in both cohorts although the differences between patients with ACOS, asthma, and COPD were not statistically significant in the replication cohort. This could be explained by the higher etiological variability between the patients or by the milder airway limitation. In a recent study, elevated serum IL-6 levels were detected in patients with ACOS, although systemic IL-6 levels did not differentiate COPD from ACOS.22 Circulating biomarkers may also not be specific for airway disease unlike sputum samples and there is no direct link between systemic and airway inflam-matory mediators.35
The important finding of this study was that sputum NGAL levels were significantly increased in patients with ACOS in comparison with the levels in the asthma and COPD groups in two independent cohorts. Therefore, although ACOS might be a complex and heterogeneous disease, the results of the current study further support that increased sputum &23' $&26
± 1*$/
3 3
3 3 3
3
3 3
3
=
VFRUH
,/ <./ ,/ 032
3
3 3
=
VFRUH
1*$/ ,/ <./ ,/ 032
±
%
$
$VWKPD
Figure 2 expression levels of sputum biomarkers in patients with asthma, COPD, and aCOs in the discovery (A) and replication cohorts (B).
Notes: The results represent standardized data (Z-scores), and the solid lines show the median value.
Abbreviations: aCOs, asthma–COPD overlap syndrome; Il, interleukin; MPO, myeloperoxidase; ngal, neutrophil gelatinase-associated lipocalin; YKl-40, chitinase-3-like protein 1.
International Journal of Chronic Obstructive Pulmonary Disease downloaded from https://www.dovepress.com/ by 118.70.13.36 on 22-Aug-2020
Dovepress gao et al
NGAL might be a characteristic feature of ACOS. Although MPO and NGAL are both COPD-related biomarkers, MPO is associated with a local activation of neutrophils,9,36,37 whereas NGAL is not only attributed to activated neutrophils but could also be secreted by the respiratory epithelial cells in response to inflammatory stimuli9,38 and by myeloid and epithelial cells in response to toll-like receptor activation during bacterial infections.39,40 Patients with ACOS seem to have more frequent exacerbations,41,42 and microorganisms are one of the main etiologic factor involved in exacerba-tions of COPD. Therefore, the sputum NGAL levels might be related to airway inflammation and low-grade microbial colonization, which predispose patients with ACOS to acute viral infections and exacerbations.
In addition, earlier reports have shown that NGAL expres-sion in lung can be induced by reactive oxygen species.43,44 Because the pathophysiology of both asthma and COPD is associated with oxidative processes induced by environmen-tal exposures and airway inflammation,45 ACOS might have augmented oxidative stress that could result in airway reactiv-ity, injury, and remodeling and might also relate to increased sputum NGAL levels. Finally, it is important that increased sputum NGAL was independently correlated with degree of airflow limitation in both the discovery and replication cohorts. This finding indicates that sputum NGAL may be a candidate marker for airway remodeling, but the clinical utility of this finding should be tested in a future prospective study.
Although many biomarkers examined in this study are likely to be associated with other morbidities, the use of sputum may improve their specificity for airway disease. The changes in sputum biomarker levels are likely to reflect the changes of cell composition and lung function during the development of chronic airway disease. Therefore, this study results suggest that ACOS could be characterized by media-tors related to airway inflammation and airway remodeling. Future studies with high-throughput design are required to fully reveal the transcriptomic or proteomic differences in chronic airway disease.
The strength of this study design was that the control subjects did not have any other exposures, and the diagno-sis criteria for asthma, COPD, and ACOS were based on international guidelines, sputum cell counts, and clinical characteristics of the disease. The sample size was limited, but the obtained results were replicated in another indepen-dent cohort.
Conclusion
The results from the current study indicate that ACOS is associated with sputum biomarkers that drive both airway
inflammation and tissue remodeling, and these biomarkers could have diagnostic value in differentiation of ACOS from asthma and COPD.
Acknowledgments
The authors would like to thank Professor Vuokko Kinnula for her contribution prior to her death on November 17, 2012. Ms Tinja Kanerva, Tiina Lapinkari, Kerstin Alhskog, Kirsi Elorinne, Sari Tillander, Yukari Iyanaga, Kakuhiro Yamaguchi, Naoko Higaki, and Shuai Ni are acknowledged for their help and excellent technical assistance. The authors also thank Doctor Päivi Piirilä for her help at accessing lung function tests. This work was financially supported by the EVO funding of the Helsinki University Central Hospital, Research Funds of the University of Helsinki, Sigrid Jusé-lius Foundation, Finnish Anti-Tuberculosis Association Foundation, the Jalmari and Rauha Ahokas Foundation, the Finnish Cultural Foundation, and the SalWe Research Program for IMO (Tekes – the Finnish Funding Agency for Technology and Innovation grant 648/10). Jing Gao was further supported by the China Scholarship Council, CIMO, the Research Foundation of the Pulmonary Dis-eases, Ida Montin Foundation, and Väinö and Laina Kivi Foundation.
Disclosure
The authors report no conflicts of interest in this work.
References
1. Vestbo J, Hurd SS, Agusti AG, et al. Global strategy for the diagnosis, management, and prevention of chronic obstructive pulmonary disease: GOLD executive summary. Am J Respir Crit Care Med. 2013;187(4): 347–365.
2. Reddel HK, Bateman ED, Becker A, et al. A summary of the new GINA strategy: a roadmap to asthma control. Eur Respir J. 2015;46(3): 622–639.
3. Postma DS, Rabe KF. The asthma-COPD overlap syndrome. N Engl J Med. 2015;373(13):1241–1249.
4. Gibson PG, McDonald VM. Asthma-COPD overlap 2015: now we are six. Thorax. 2015;70(7):683–691.
5. Gibson PG, Simpson JL. The overlap syndrome of asthma and COPD: what are its features and how important is it? Thorax. 2009;64(8): 728–735.
6. Kauppi P, Kupiainen H, Lindqvist A, et al. Overlap syndrome of asthma and COPD predicts low quality of life. J Asthma. 2011;48(3): 279–285.
7. Marsh SE, Travers J, Weatherall M, et al. Proportional classifications of COPD phenotypes. Thorax. 2008;63(9):761–767.
8. Andersen H, Lampela P, Nevanlinna A, Saynajakangas O, Keistinen T. High hospital burden in overlap syndrome of asthma and COPD. Clin Respir J. 2013;7(4):342–346.
9. Iwamoto H, Gao J, Koskela J, et al. Differences in plasma and sputum biomarkers between COPD and COPD-asthma overlap. Eur Respir J. 2014;43(2):421–429.
10. Hardin M, Silverman EK, Barr RG, et al; COPDGene Investigators. The clinical features of the overlap between COPD and asthma. Respir Res. 2011;12:127.
International Journal of Chronic Obstructive Pulmonary Disease downloaded from https://www.dovepress.com/ by 118.70.13.36 on 22-Aug-2020
International Journal of COPD
Publish your work in this journal
Submit your manuscript here: http://www.dovepress.com/international-journal-of-chronic-obstructive-pulmonary-disease-journal The International Journal of COPD is an international, peer-reviewed
journal of therapeutics and pharmacology focusing on concise rapid reporting of clinical studies and reviews in COPD. Special focus is given to the pathophysiological processes underlying the disease, intervention programs, patient focused education, and self management protocols.
This journal is indexed on PubMed Central, MedLine and CAS. The manuscript management system is completely online and includes a very quick and fair peer-review system, which is all easy to use. Visit http://www.dovepress.com/testimonials.php to read real quotes from published authors.
Dovepress
Dove
press
sputum biomarkers for aCOs
11. Barnes PJ. The cytokine network in asthma and chronic obstructive pulmonary disease. J Clin Invest. 2008;118(11):3546–3556. 12. Barnes PJ. Immunology of asthma and chronic obstructive pulmonary
disease. Nat Rev Immunol. 2008;8(3):183–192.
13. Barrecheguren M, Esquinas C, Miravitlles M. The asthma – chronic obstructive pulmonary disease overlap syndrome (ACOS): opportunities and challenges. Curr Opin Pulm Med. 2015;21(1):74–79.
14. Tamada T, Sugiura H, Takahashi T, et al. Biomarker-based detection of asthma-COPD overlap syndrome in COPD populations. Int J Chron Obstruct Pulmon Dis. 2015;10:2169–2176.
15. Dente FL, Bacci E, Vagaggini B, Paggiaro P. Cytokines in induced sputum: a role for the ratio of IL-6/IL-13 in the differentiation of asthma and chronic obstructive pulmonary disease? Respiration. 2012; 84(2):98–100.
16. Wills-Karp M, Luyimbazi J, Xu X, et al. Interleukin-13: central mediator of allergic asthma. Science. 1998;282(5397):2258–2261.
17. Tang H, Fang Z, Sun Y, et al. YKL-40 in asthmatic patients, and its correlations with exacerbation, eosinophils and immunoglobulin E. Eur Respir J. 2010;35(4):757–760.
18. Otsuka K, Matsumoto H, Niimi A, et al. Sputum YKL-40 levels and pathophysiology of asthma and chronic obstructive pulmonary disease. Respiration. 2012;83(6):507–519.
19. James AJ, Reinius LE, Verhoek M, et al. Increased YKL-40 and chi-totriosidase in asthma and chronic obstructive pulmonary disease. Am J Respir Crit Care Med. 2016;193(2):131–142.
20. Grubek-Jaworska H, Paplinska M, Hermanowicz-Salamon J, et al. IL-6 and IL-13 in induced sputum of COPD and asthma patients: correlation with respiratory tests. Respiration. 2012;84(2):101–107.
21. Attaran D, Lari SM, Towhidi M, et al. Interleukin-6 and airflow limita-tion in chemical warfare patients with chronic obstructive pulmonary disease. Int J Chron Obstruct Pulmon Dis. 2010;5:335–340. 22. Fu JJ, McDonald VM, Gibson PG, Simpson JL. Systemic inflammation
in older adults with asthma-COPD overlap syndrome. Allergy Asthma Immunol Res. 2014;6(4):316–324.
23. Laitinen T, Hodgson U, Kupiainen H, et al. Real-world clinical data identifies gender-related profiles in chronic obstructive pulmonary disease. COPD J Chronic Obstr Pulmonary Dis. 2009;6(4):256–262. 24. British Thoracic Society Scottish Intercollegiate Guidelines N. British
guideline on the management of asthma. Thorax. 2008;63 Suppl 4: iv1–iv121.
25. Miller MR, Hankinson J, Brusasco V, et al. Standardisation of spirom-etry. Eur Respir J. 2005;26(2):319–338.
26. Enright P, Skloot G, Herbert R. Standardization of spirometry in assessment of responders following man-made disasters: World Trade Center worker and volunteer medical screening program. Mt Sinai J Med. 2008;75(2):109–114.
27. Ishikawa N, Hattori N, Kohno N, Kobayashi A, Hayamizu T, Johnson M. Airway inflammation in Japanese COPD patients compared with smoking and nonsmoking controls. Int J Chron Obstruct Pulmon Dis. 2015;10:185–192.
28. Viljanen AA, Halttunen PK, Kreus KE, Viljanen BC. Spirometric studies in non-smoking, healthy adults. Scand J Clin Lab Invest Suppl. 1982;159:5–20.
29. Djukanovic R, Sterk PJ, Fahy JV, Hargreave FE. Standardised method-ology of sputum induction and processing. Eur Respir J Suppl. 2002; 37:1s–2s.
30. Kelly MM, Keatings V, Leigh R, et al. Analysis of fluid-phase mediators. Eur Respir J Suppl. 2002;37:24s–39s.
31. Louhelainen N, Stark H, Mazur W, Rytila P, Djukanovic R, Kinnula VL. Elevation of sputum matrix metalloproteinase-9 persists up to 6 months after smoking cessation: a research study. BMC Pulm Med. 2010;10:13.
32. Shiota N, Yokoyama A, Haruta Y, Hattori N, Kohno N. Association of airway inflammation with asthma control level evaluated by the asthma control test. J Asthma. 2011;48(9):907–913.
33. Boulet LP, FitzGerald JM, Reddel HK. The revised 2014 GINA strategy report: opportunities for change. Curr Opin Pulm Med. 2015; 21(1):1–7.
34. Bateman ED, Reddel HK, van Zyl-Smit RN, Agusti A. The asthma-COPD overlap syndrome: towards a revised taxonomy of chronic airways diseases? Lancet Respir Med. 2015;3(9):719–728.
35. Donaldson GC, Seemungal TAR, Patel IS, et al. Airway and systemic inflammation and decline in lung function in patients with COPD. Chest. 2005;128(4):1995–2004.
36. Keatings VM, Barnes PJ. Granulocyte activation markers in induced sputum: comparison between chronic obstructive pulmonary disease, asthma, and normal subjects. Am J Respir Crit Care Med. 1997;155(2): 449–453.
37. Aaron SD, Angel JB, Lunau M, et al. Granulocyte inflammatory markers and airway infection during acute exacerbation of chronic obstructive pulmonary disease. Am J Respir Crit Care Med. 2001; 163(2):349–355.
38. Cowland JB, Sorensen OE, Sehested M, Borregaard N. Neutrophil gelatinase-associated lipocalin is up-regulated in human epithelial cells by IL-1 beta, but not by TNF-alpha. J Immunol. 2003;171(12): 6630–6639.
39. Flo TH, Smith KD, Sato S, et al. Lipocalin 2 mediates an innate immune response to bacterial infection by sequestrating iron. Nature. 2004; 432(7019):917–921.
40. Chan YR, Liu JS, Pociask DA, et al. Lipocalin 2 is required for pulmo-nary host defense against Klebsiella infection. J Immunol. 2009;182(8): 4947–4956.
41. Nielsen M, Barnes CB, Ulrik CS. Clinical characteristics of the asthma-COPD overlap syndrome – a systematic review. Int J Chron Obstruct Pulmon Dis. 2015;10:1443–1454.
42. Menezes AM, Montes de Oca M, Perez-Padilla R, et al. Increased risk of exacerbation and hospitalization in subjects with an overlap phenotype: COPD-asthma. Chest. 2014;145(2):297–304.
43. Roudkenar MH, Kuwahara Y, Baba T, et al. Oxidative stress induced lipocalin 2 gene expression: addressing its expression under the harmful conditions. J Radiat Res. 2007;48(1):39–44.
44. Sunil VR, Patel KJ, Mainelis G, et al. Pulmonary effects of inhaled diesel exhaust in aged mice. Toxicol Appl Pharmacol. 2009;241(3): 283–293.
45. Erzurum SC. New insights in oxidant biology in asthma. Ann Am Thorac Soc. 2016;13(suppl 1):S35–S39.
International Journal of Chronic Obstructive Pulmonary Disease downloaded from https://www.dovepress.com/ by 118.70.13.36 on 22-Aug-2020