Diffraction and Forward Physics in ATLAS: results and perspectives
M. Bruschi1,aon behalf of the ATLAS collaboration
1I.N.F.N. Sezione di Bologna (ITALY)
Abstract.The present and future potential of ATLAS for diffraction and forward physics is presented. As recent
results the rapidity gap cross section and elastic and totalppcross sections are reported. The upgrade project AFP is presented and it is shown how it will complement the ALFA acceptance for diffractive physics in mea-surements taken withβ∗=90 m LHC beam optics. Moreover, the AFP detector will guarantee good acceptance on diffractive events also during normal running conditions allowing to improve the ATLAS detector perfor-mances. If in addition, a high luminosity program will be feasible, AFP might be fundamental for potential discoveries with extra dimensions being one example.
1 Introduction
Starting at the interaction point(IP) and proceeding along the beam line, there are the following forward detectors (FWD) in ATLAS :
• LUCID (LUminosity Cerenkov Integrating Detector), placed symmetrically at 17 mfrom the IP for the mea-surement of relative and absolute luminosity;
• ZDC (Zero Degree Calorimeter), placed symmetrically in the neutral absorber at about 140 mfrom the IP, for measurement of neutrons or other neutral particles pro-duced inppor heavy ions (HI) interactions;
• ALFA (Absolute Luminosity For ATLAS), formed by two vertical RP stations per side, placed at about 240m from the IP whose main goal is the measurement of the total cross section and luminosity.
The description of ATLAS and its FWD can be found in [1]. Besides these detectors, which are already installed and taking data, ATLAS foresees an additional upgrade project [2] named AFP (ATLAS Forward Proton) formed by 2 horizontal RP stations per side placed at 210mwith respect to the IP. The purpose of the FWD is to comple-ment the ATLAS program by detecting particles that are produced at high rapidity and can not be studied with the central detectors.
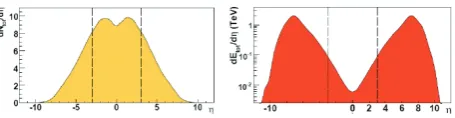
The importance to instrument the forward part of AT-LAS can be understood by inspecting the two plots re-ported in Fig. 1. The plot on the left shows the flow of the particles produced as a function of rapidity. The verti-cal dotted lines indicate the limit for reconstruction in the central detector set by the ATLAS tracker (±2.5 rapidity units). It can be appreciated that about 40% of the tracks are produced out of the central detector acceptance. The
ae-mail: [email protected]
Figure 1.Particle flow (left) and energy flow (right) as a function
of rapidity as obtained by DPMJET generator forppinteractions at √s=14T eV
right plots in Fig. 1 shows instead the energy flow distri-bution as a function of the pseudo-rapidity ,η. In this case it can be estimated that the energy released in the central detector is actually a very small fraction of the total energy produced. As a consequence, it is worth to instrument with detectors the forward part of ATLAS in order to better de-fine the characteristics of theppinteractions.
The outline of the document is the following. In Sec-tion 2 a measurement of the differential inelastic cross sec-tion as a funcsec-tion of the size of the rapidity gap will be de-scribed. This is an example of a measurement sensitive to diffractive physics using only the central detector. In Sec-tion 3 some details will be given about a study performed with the ALFA detector i.e. measurements at √s=7T eV of the elastic differential cross section and the total cross section. In Section 4 the future perspectives using ALFA and AFP will be dicussed. Section 5 will finally present the future plans of measurements at low and medium num-ber of interactions per bunch crossing (μ), respectively.
2 Diffractive processes at ATLAS
In Fig. 2 the typical classification of diffractive events in single diffractive (SD), double diffractive (DD), cen-tral diffractive (CD) and elastic is reported. An indica-tive evaluation of the cross section for each topology at C
Owned by the authors, published by EDP Sciences, 2015
Figure 2.Classification of minimum bias processes. Their topol-ogy in the central and forward detectors is reported in the lower part of each class (azimuthal angleφvs. rapidityη). In the pic-torial view of the event, the pink dots represent the diffractively scattered proton(s), while the blue dots are the products of the diffractiveppinteraction.
√
s=14T eVis also reported. The diffractive and elastic events are about 40% of the LHC ppcollisions. Theo-retically diffraction is referred to as a process where the quantum numbers of the vacuum are exchanged, or in the Regge theory, as a process with at-channel exchange of a Pomeron. Experimentally, the presence of large gaps is a signature for diffraction, a common feature of all the event topology reported in Fig. 2. It has to be noted that ATLAS, with the forward calorimeter has anη <4.9 rapidity cov-erage which doesn’t make it possible to access diffractive system mass less than 10GeV. The indirect measurement ofξ(which is the fractional longitudinal momentum loss of the protons) via the energy detected in the calorimeter is not very precise due to invisible energy and it works only in a limited region ofξ. Moreover no measurement of the Mandelstam variablet of the proton is possible with the central detector. As a consequence,proton tagging is the only way for a more detailed probing of diffraction.
As an example to show the importance to tag protons in order to select diffractive events, the cross section as a function of the size of the rapidity gap as measured by the ATLAS central detector is considered [3]. In this analysis, the forward rapidity gaps (ΔF
η) are defined as the larger for-ward rapidity gap region on detector edge devoid of parti-cles having transverse momentumPT >200 MeV. In the
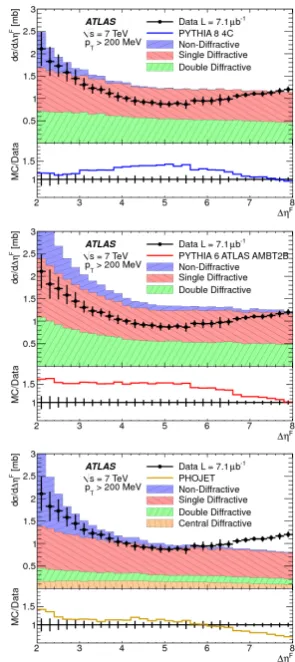
left plot of Fig. 3 the inelastic cross section ddση is reported as a function of the gap size. The black dots are the mea-sured data and the no diffractive (ND), SD and DD con-tribution of the Monte Carlo (MC) generator Pythia 8 [4] is reported superimposed. The other two plots (center and right of Fig. 3) report the same quantities for other MC generators, Pythia 6 and Phojet [5] respectively. A tagging of the proton would allow to better separate the different diffractive contributions.
The measured cross section is about 1 mbper unit of gap size for a forward rapidity gap greater than 3 units. From all the plots it can be observed that the default Pho-jet and Pythia do not describe the rise of the cross sec-tion observed forΔF
η >5. As shown in the plot reported in Fig. 4, the data are compared with a modified version
Figure 3. The black dots represent the measured inelastic cross section differential in forward gap size ΔηF for particles with
Pt >200 MeV andΔηF >2. The error bars indicate the total
uncertainties. The colored areas report the MC predictions of the generators Pythia 8 (left), Pythia 6 (center) and Phojet (right) for ND, SD and DD (also CD for Phojet) contributions [3].
of the Pythia 8 model with the Donnachie-Landshoff[6] Pomeron flux, in which the Pomeron interceptαP(0) is
de-termined from fits to the data in the region 6 <ΔFη < 8. The observed rise can be interpreted from a triple Pomeron contribution with a Pomeron intercept αP(0) > 1. The
slope is very sensitive to the precise value ofαP(0).
3 Elastic and Total Cross Section
Measurement
In the following the result of the total cross section mea-surement at √s=7T eV using the ATLAS-ALFA detec-tor will be described [7]. The ALFA detecdetec-tor consists of 4+4 vertical pots detectors symmetrically placed at about 240 mfrom the ATLAS IP. In Fig. 5 the topology of an elastic event is reported i.e.two back to back protons which traverse the ALFA stations. The elastic scattering is mea-sured in a dedicated run of the LHC with a special high
β∗ =90moptics. The differential elastic cross section is
used to estimate the total cross section as prescribed by the optical theorem:
Figure 4.Inelastic cross section differential in forward gap size
ΔηF for particles with Pt > 200 MeV. The data are
com-pared with a modified version of the Pythia 8 model with the Donnachie-LandshoffPomeron flux, in which the Pomeron in-terceptαP(0) is determined from fits to the data in the region 6<ΔF
η <8 [3].
Figure 5.Pictorial view of a typical elastic event as detected by ALFA.
whereσtotis the total cross section, felis the elastic
scat-tering amplitude andtis the Mandelstam variable. There-fore, from a measurement of the elastic cross section dif-ferential in thet-variable and an extrapolation tot=0, the total cross section can be determined. Fig. 6 reports the differential cross sectiondσ
dt as a function of thet
parame-ter. The details of the theoretical assumptions used for the fit of the elastic data can be found in [7]. The fit results gives a total cross section value of 95.4±1.3 mb and a nuclear slope parameterBof 19.73±0.24GeV−2with the errors being the combination in quadrature of the exper-imental plus statistical errors. The lower part of the plot reports the percentage deviation of the fit with respect to the data showing superimposed the total error of the mea-surement and the statistical ones. The fit includes experi-mental systematic uncertainties in theχ2. The fit quality is good with the normalizedχ2
N ∼0.46. The fit range is set
for 0.01<t<0.1GeV−2, where possible deviations from exponential form are small. Further uncertainty arise from the extrapolation oftto zero, probed by a variation of the fit range upper limit from 0.1 GeV−2 to 0.15GeV−2 and lower limit from 0.01GeV−2to 0.058GeV−2. The extrap-olation error onσtotis 0.4mband on the nuclear slopeBis
0.17GeV−2. The main sources of systematic experimental uncertainty forσtotare luminosity,∼2.3%, and the
uncer-tainty on the beam energy which is∼ 0.65%. In Table 1 the breakdown of the total error forσtotandBare reported
in the statistical, experimental and extrapolation parts. The next step for the ALFA detector will be to mea-sure the differential elastic cross section andσtotat √s=
]
2
[mb/GeV
t
d/
el
σ
d
1 10
2
10
3
10
2011 data Elastic fit
ATLAS
-1 b
μ
=7 TeV, 80 s
]
2
[GeV -t 0 0.05 0.1 0.15 0.2 0.25 0.3 0.35
(Fit-data)/data
-0.15-0.1
-0.050
0.05 0.1 0.15
Total error Statistical
Figure 6. A fit of the theoretical prediction withσtot and the nuclear slopeBas free parameters to the differential elastic cross section. In the lower panel the points represent the normalized difference between fit and data, the yellow area represents the total experimental uncertainty and the hatched area the statistical component. The red line indicates the fit range, the fit result is extrapolated in the lower panel outside the fit range [7].
Table 1.Breakdown of the total error forσtotandB.
Figure 7.Sketch of the AFP detector.
13 T eV. At a later stage the aim is to run with aβ∗ ∼ 2.5kmbeam optics which will allow to reach the Coulomb nuclear interaction region (CNI), thus reducing the uncer-tainty of extrapolation tot=0 and providing a total cross section measurement not needing the luminosity as exter-nal parameter.
4 Future perspectives: ALFA and AFP
proton trajectory. For events with two opposite protons in the final state, AFP will provide, independently from ATLAS central detector, the mass of the central event via the relation M2
X = sξ1ξ2 where MX is the mass of the
central object produced, s is the centre of mass energy squared, ξ1 the fractional momentum loss of one proton andξ2the fractional momentum loss of the other proton, respectively. This information can be used in a powerful exclusivity cut that will help to reduce the background in many measurements of central exclusive production (CEP) and will be decisive for some of them like theγγfinal state (described in Section 5).
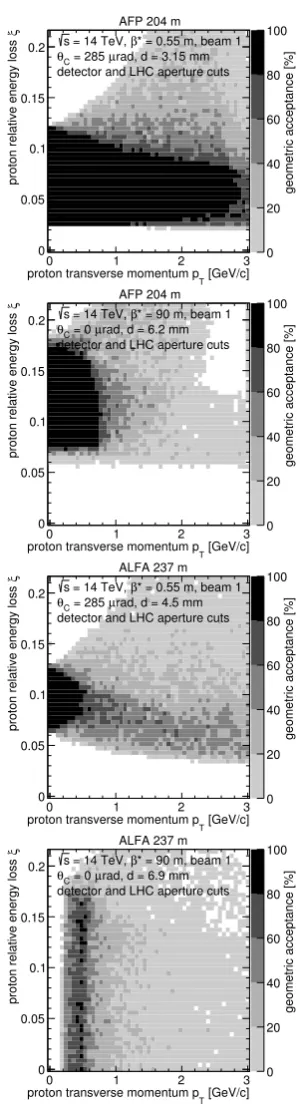
The first station at 204 mwill host tracking detectors composed of the same 3D silicon sensors used in a part of the ATLAS insertable B layer [8], readout by FE I4 chips. The angular resolution will be at the level ofμradfor pro-ton tracks reconstruction. The second station at 212 m will contain both tracking detectors and a timing detec-tor. The timing system should perform at 10 psor better time resolution (corresponding to about 2.1mmprecision on the reconstructed vertex inz) for proton pile-up back-ground rejection. The baseline technology for timing con-sists in L-shaped quartz bars readout by fast micro channel plate photomultipliers, fast amplifiers, constant fraction discriminator and an HPTDC [9] based readout card. In parallel to this, there is an intense R&D for Silicon based or Diamonds detectors readout by the SAMPIC [10] chip. In Fig. 8 the results of beam optics simulation using the simulation code MAD-X [11] and MC generator level for theξvspT acceptance plots for AFP (upper plots) and
ALFA (lower plots) is reported. The acceptance is evalu-ated for aβ∗ =0.5 m(left plots) and aβ∗ =90 m(right plots) beam optics. Lowβ∗is associated with high lumi-nosity while a highβ∗means low luminosity. The plots show that AFP has∼ 100% acceptance at smalltwhile the ξrange depends on the beam optics. ALFA has in-stead limited acceptance in t, broad acceptance in ξand good acceptance for elastics. Moreover, the ALFA detec-tor can only be operated at very low luminosity and thus ALFA and AFP can play a complementary role for diff rac-tive physics in ATLAS.
The whole forward region inclusive of the AFP de-tectors has been implemented in the ATLAS official MC code ATHENA [12]. Therefore performances of the de-tectors are available using the full simulation and also some physics channels have been studied, like the dou-ble Pomeron exchange (DPE) dijets. These studies have shown that acceptance of AFP is typically in the range 0.015< ξ <0.15.
5 Program of measurements at low and
low/medium luminosity
At the beginning of year 2014, ATLAS approved a physics program to be performed with AFP in special beam con-ditions at very low and low/medium intensity. The very low luminosity program (μ < 0.05, μ being the average number of interactions per bunch crossing) will study typ-ical aspects of soft QCD like rapidity gap cross section,
[GeV/c] T proton transverse momentum p0 1 2 3
ξ proton re lat ive energy loss 0 0.05 0.1 0.15 0.2
geometric acceptance [%]
0 20 40 60 80 100 * = 0.55 m, beam 1
β
= 14 TeV, s
detector and LHC aperture cuts AFP 204 m
rad, d = 3.15 mm
μ = 285 C θ [GeV/c] T proton transverse momentum p0 1 2 3
ξ proton re lat ive energy loss 0 0.05 0.1 0.15 0.2
geometric acceptance [%]
0 20 40 60 80 100 * = 90 m, beam 1
β
= 14 TeV, s
detector and LHC aperture cuts AFP 204 m
rad, d = 6.2 mm
μ = 0 C θ [GeV/c] T proton transverse momentum p
0 1 2 3
ξ proton re lat ive energy loss 0 0.05 0.1 0.15 0.2
geometric acceptance [%]
0 20 40 60 80 100 * = 0.55 m, beam 1
β
= 14 TeV, s
detector and LHC aperture cuts ALFA 237 m
rad, d = 4.5 mm
μ = 285 C θ [GeV/c] T proton transverse momentum p0 1 2 3
ξ proton re lat ive energy loss 0 0.05 0.1 0.15 0.2
geometric acceptance [%]
0 20 40 60 80 100 * = 90 m, beam 1
β
= 14 TeV, s
detector and LHC aperture cuts ALFA 237 m
rad, d = 6.9 mm
μ
= 0 C
θ
Figure 8. ξvs pT acceptance plots for AFP (upper plots) and ALFA (lower plots). The acceptance is evaluated atβ∗=0.5m (left plots) andβ∗=90m(right plots) LHC beam optics.
underlying event and multi-parton interactions. With its ability to tag diffractively scattered protons, AFP will be decisive in improving the selection of SD and DD events and shed light on the interpretation of the data in terms of the diffractive processes .
Figure 9.Typical hard diffractive processes to be studied at LHC and their cross sectionsσvisat
√
s=13T eV.
0.5 < μ < 3. In 100 hours (∼1 week) of data taking this would allow to collect ∼ 40÷200 pb−1 and study hard diffractive processes (see Fig. 9).
One of the processes that can be studied is SD vector boson or jet production. With this set of data it will be pos-sible for example to study the rapidity gap survival proba-bilityS2[13]. In the case of the single diffractiveW pro-duction, the charge asymmetry will allow constraining the flavor composition of the Pomeron. Running for the order of 100 hours atμ∼1 will allow to get a significance (de-fined as √S
S+B,S being the signal andBthe background of
the measurement) above 20. Another case of interest is the DPE jets production. In this case the two protons exchange two colorless objects (Pomerons) and leave the IP intact. The two Pomerons produce centrally a dijet and also other remnants (see rightmost diagram of Fig. 9). With this class of events it will be possible to study the gluon contents of the Pomeron and theβdependence of the Pomeron struc-ture,βbeing the momentum fraction of the Pomeron car-ried by the interacting parton inside the Pomeron. In this case, running atμ∼1 for∼100 hours will allow to get a significance above 1000 for a jetpT >20GeVand
signif-icance of about 50 for a jetpT >100GeV.
Another important diagram is the CEP in which there is the exchange of two gluons with a third gluon contribut-ing to produce a colorless object. The two protons are in-tact, and the central object is produced without remnants. In this case the mass reconstructed in AFP is equal to the mass reconstructed in the central detector, and this can be used as a powerful cut to reject background events. The exclusive jets production will allow to study the uninte-grated gluon distributions.
The diffractive production of gamma+jet, at the LHC energy scale, will allow to distinguish between diffrac-tion mechanisms as it can be appreciated in the simula-tion reported in Fig. 10 [14]. In the plot the ratio of the gamma+jet cross section to the dijet cross section is re-ported as a function of the measured mass of the central object. It can be seen that the soft color interaction (SCI) model predicts a constant ratio all over the mass range, while the DPE model has a different trend. Moreover, the ratio in this case depends on the quark u/d ratio in the
M(GeV)
60 80 100 120 140 160 180 200 220 240
/dM
dijet
σ
/dM/d
jet
γσ
d
-3 10
d/u = 0.25
d/u = 0.5
d/u = 1
d/u = 2
d/u = 4 d = s, u + d + s = const.
< 0.02
ξ
0.0015 <
SCI model
Figure 10.Simulation results of the ratio of the gamma+jet cross section to the dijet cross section as a function of the central mass. The ratio is evaluated for different Pomerond/uvalues and for the SCI model predictions [14].
Pomeron. One day at low luminosity (about 10pb−1) will be enough to perform this measurement. The measure-ment of the dijet cross section will also allow to check if the Pomeron is indeed the same at epor ppcolliders, which is a fundamental theoretical question.
Finally, SD or DPE events of the type jet-gap-jet will probe the Balitsky-Fadin-Kuraev-Lipatov (BFKL) [15] dynamics of the Pomeron. This can be studied by calculat-ing the ratio of the DPE jet-gap-jet to the DPE dijets cross sections (suitably corrected for leading order and next to leading order effects) as a function of the leading jetpT. It
is important to note that the chosen ratio minimize system-atics uncertainties since, for instance, the factorsS2 can-cel. The needed luminosity to perform this measurement is 300 pb−1. The theory predicts an almost constant ratio of 0.25 over all the leading jetpT range. Deviations from
this trend will reveal aspects of the Pomeron dynamics. Besides the lowμprogram approved by ATLAS for the run starting in year 2015, AFP might be a powerful tool also for discovery physics. This requires that the beam re-lated background at normal optics condition (lowβ∗, high luminosity) is tolerable. Here photon exchange processes withWW, ZZ andγγ final states can be accessed using the exclusivity cut from the AFP measured mass. Such measurements will allow to test quartic gauge couplings (QGC) and get insight in Beyond Standard Model (BSM) theories. Standalone simulations, in the WW final state case, reported for instance in [2], have shown that the pres-ence of AFP will allow to improve of about 4 order of mag-nitude the sensitivity reached by OPAL and one-two order of magnitudes the sensitivity reachable using only the AT-LAS central detector collecting a statistics of∼200 f b−1. This will allow to reach coupling values expected in extra-dimension models.
mea-surements of the the other possible vector boson cou-plings, which require a time resolution of 10 psor better, theγγfinal state will require only moderate timing resolu-tion, due to the powerful exclusivity cut on the centralγγ mass provided by AFP.
At moderately high or high luminosity it will also be possible to study exclusive jet production to verify QCD production models .
The moderately high or high luminosity program sketched above is still not approved by ATLAS and it will be reviewed when real data on background in normal run-ning conditions will be available.
6 Conclusions
The ATLAS experiment produced and is producing im-portant results for diffractive physics. Those results are ex-pected to provide a valuable input for modeling and tuning of MC generators, to study mechanism of diffractive pro-cesses, mechanism of hadronization and confinement and for search for new QCD dynamics.
The quality of these studies will improve when the de-tector will be upgraded with AFP adding the capability to provide proton tagging. ALFA will continue its program of total cross section measurements at the new LHC en-ergy and at higherβ∗(about 2.5km), thus reaching inside the CNI region. ALFA will also contribute to complement the AFP acceptance in the highβ∗- low luminosity physics program.
The hard diffractive program of AFP at lowβ∗- high
luminosity is indeed very interesting, but it will only be approved when data on the beam background in normal running conditions are available.
Acknowledgement
Warm thanks to Per Grafstrom and Christophe Royon for many useful discussions.
References
[1] ATLAS Collaboration, JINST3, S08003 (2008) [2] ATLAS Collaboration, CERN-LHCC-2011-012 [3] ATLAS Collaboration, Eur. Phys. j.C72(2012) 1926 [4] T. Sjöstrand et al, CERN-LCGAPP-2007-04
[5] F.W. Bopp et al, http://arxiv.org/abs/hep-ph/9803437 [6] A. Donnachie, P. Landshoff, Nucl. Phys. B244(1984)
322
[7] ATLAS Collaboration, Nucl. Phys.Section B(2014) 486-548
[8] ATLAS Collaboration, CERN-LHCC-2010-013 [9] J. Pinfold, Act. Phys. Polon.B, Proc. Suppl.,4(2011)
71
[10] E. Delagneset al., Act. Phys. Polon., Proc. Suppl.,7 (2014) 685
[11] E. Forest, F.Schmidt and E. McIntosh, CERN-SL-2002-044 (AP) KEK-report 2002-3
[12] ATLAS Collaboration, CERN-LHCC-2005-022 [13] CDF Collaboration, Phys. Rev. Lett.84(2000) 504 [14] C. Marquet, C. Royon, M. Saimpert, and D. Werder,
arXiv:1306.4901 [hep-ph]
![Figure 4. Inelastic cross section diΔ6pared with a modified version of the Pythia 8 model with theDonnachie-Landshofferential in forward gap sizeηF for particles with Pt > 200 MeV.The data are com-ff Pomeron flux, in which the Pomeron in-tercept αP(0) is determined from fits to the data in the region < ΔFη < 8 [3].](https://thumb-us.123doks.com/thumbv2/123dok_us/8181536.1366378/3.595.324.515.518.568/inelastic-modied-thedonnachie-landshoerential-particles-pomeron-pomeron-determined.webp)
![Figure 10. Simulation results of the ratio of the gammasection to the dijet cross section as a function of the central mass.The ratio is evaluated for di+jet crossfferent Pomeron d/u values and forthe SCI model predictions [14].](https://thumb-us.123doks.com/thumbv2/123dok_us/8181536.1366378/5.595.89.262.72.194/simulation-gammasection-function-central-evaluated-crosserent-pomeron-predictions.webp)
