c
Owned by the authors, published by EDP Sciences, 2015
Flow and failure of an aluminium alloy from low to high temperature and
strain rate
Rafael Sancho, David Cend´on, and Francisco G´alveza
Technical University of Madrid, Department of Materials Science, c/ Profesor Aranguren, 28040 Madrid, Spain
Abstract. The mechanical behaviour of an aluminium alloy is presented in this paper. The study has been carried out to analyse the flow and failure of the aluminium alloy 7075-T73. An experimental study has been planned performing tests of un-notched and notched tensile specimens at low strain rates using a servo-hydraulic machine. High strain rate tests have been carried out using the same geometry in a Hopkinson Split Tensile Bar. The dynamic experiments at low temperature were performed using a cryogenic chamber, and the high temperature ones with a furnace, both incorporated to the Hopkinson bar. Testing temperatures ranged from−50◦C to 100◦C and the strain rates from 10−4s−1 to 600 s−1. The material behaviour was modelled using the Modified Johnson-Cook model and simulated using LS-DYNA. The results show that the Voce type of strain hardening is the most accurate for this material, while the traditional Johnson-Cook is not enough accurate to reproduce the necking of un-notched specimens. The failure criterion was obtained by means of the numerical simulations using the analysis of the stress triaxiality versus the strain to failure. The diameters at the failure time were measured using the images taken with an image camera, and the strain to failure was computed for un-notched and notched specimens. The numerical simulations show that the analysis of the evolution of the stress triaxiality is crucial to achieve accurate results. A material model using the Modified Johnson-Cook for flow and failure is proposed.
1. Introduction
As a consequence of the structural integrity degradation caused by impact loads, coupled with cost savings, impact simulations are becoming more common during design process.
Simulating the impact behaviour of a material involves the need to reproduce the flow and fracture behaviour of such material accurately, taking into account large strains, strain rate effects and thermal softening. Usually, the constitutive equations used for that purpose define the equivalent stress as a function of the equivalent plastic strain, equivalent plastic strain rate and temperature (Johnson-Cook constitutive equation, 1983 [1] or Zerilli-Armstrong, 1987 [2]). Furthermore, experimental tests have demonstrated that fracture behaviour of ductile materials strongly depends on stress triaxiality (Johnson-Cook, 1985 [3]; Børvik et al., 2003 [4], Xue-Wierzbicki, 2004 [5]); being smaller the equivalent fracture strain for high stress triaxiality values.
In the present work, authors study the flow and failure of the alloy AA 7075-T73 at different temperatures and strain rates, trying to describe its mechanical behaviour using the modified Johnson-Cook model proposed by Børvik et al. [6] and implemented in the LS-DYNA numerical code.
Numerical simulations, using LS-DYNA finite element code, were carried out to determine a more suitable fracture envelope [7,8] than that using Bridgman’s stress triaxiality formulation [9].
aCorresponding author:fgalvez@mater.upm.es
2. Material model
Due to the wide spread of the Johnson-Cook model for describing the flow and fracture behaviour of ductile metals under impact loads, a Johnson-Cook type model was chosen.
2.1. Constitutive model
Based on the hypothesis of strain equivalence (Lemaitre, 1992 [10]), Børvik et al. [6] reformulated the Johnson-Cook model [1,3] in order to take into account damage evolution in the constitutive equation, replacing the Cauchy stress tensorσby an effective stress tensor ˜σ:
˜
σ = σ
1−βD (1)
where D is the damage parameter andβis a flag to control the coupling of the model. Note that β can only take the values 0 and 1, switching the modified Johnson-Cook model from the uncoupled to the coupled material model.
The constitutive relation, using Voce type hardening [12,13], reads:
˜¯
σ =
A+B¯rn =2
i=1Qi
1−exp (−Ci¯r)
(2) ×1+˙¯r∗c1−T∗m
A,B,n,Q1,Q2,C1,C2, c and m are material constants,
˙¯r∗=˙¯r/˙r0 is a dimensionless strain rate, being ˙r0 a
user-defined strain rate and T∗ =(T −Tr)/(Tm−Tr)
the homologous temperature. Tr is the reference
tem-perature (usually the room temtem-perature), Tm the melting
temperature and T the current temperature.
Assuming adiabatic conditions, the rate of temperature increase is defined as:
˙
T = χ
ρCpσ
: ˙εp (3)
whereρ is the density, Cp is the specific heat at constant
pressure andχis the Taylor-Quinney coefficient, which is often assigned the value 0.9 for the majority of metals [14]. 2.2. Failure criterion
Failure criterion is based on damage evolution; but unlike the Johnson-Cook model (1985) [3], damage does not start to accumulate until a threshold equivalent plastic strain ¯
εd
p is reached. The material fails when damage gets to a
critical value Dc. The damage evolution law is then defined
as:
˙
D=0 for ¯εp ≤ε¯dp (4)
˙ D=Dc
˙¯
εp
¯
εf p−ε¯dp
for ¯εp>ε¯dp. (5)
The equivalent plastic strain to failure ¯εpf is homologous to
the modified strain hardening function: ¯
εf
p =
D1 +D2exp
D3σ∗ 1+ε¯∗p
D4
1+D5T∗
(6) where D1, D2, D3, D4and D5 are material constants and
σ∗=σ
H/σ¯ is the stress triaxiality.
3. Material description
The material studied was the wrought high-strength aerospace aluminium alloy AA 7075 T73. Its principal alloying elements are Zn, Mg and Cu, being Zn and Mg elements which improve the mechanical properties of aluminium significantly. Cu alloying element improves the coupling mechanical behaviour-stress corrosion cracking resistance. The T73 temper was applied to achieve the best stress corrosion resistance.
4. Experimental procedure
In order to calibrate the modified Johnson-Cook model, three groups of experiments (quasi-static, dynamic and dynamic at high and low temperature tensile tests) were carried out.
Different initial stress triaxialities were obtained by means of testing axysimmetric specimens with different notch radii (un-notched, R=4 mm, R=2 mm and R=1 mm) [7]:
σ∗= 1
3 +ln
1+ r
2R (7)
being r and R the initial cross section and notch radii.
Figure 1. Dimensions [mm] and geometry of the axisymmetric smooth (upper) and notched (lower) specimens used for the experimental procedure.
Geometry and dimensions of the tested specimens are shown in Fig.1.
4.1. Quasi-static tensile tests
Quasi-static tensile tests were carried out at room temperature and under a strain rate of 2.6×10⁻⁴s−1. The tests were filmed (see Fig.2) and the initial d0and fracture
df diameters of the samples were determined and utilized
for the calculation of the equivalent plastic strain to failure (see Table1) using the equation:
¯ff p =2 ln
d0
df
· (8)
The axisymmetric smooth specimens were instrumented with an optical extensometer in order to obtain the axial strain. Assuming volume conservation, nominal true stress
σN and nominal true strain εN from the corresponding
engineering values were obtained applying the expression:
εN =ln (1+e); σN=s(1+e) (9)
where s and e are the engineering stress and strain respec-tively. Taking into account the additive decomposition of the strains, the true nominal plastic strain is calculated as:
εP N =εN−εe=εN−σ N
E (10)
whereεeis the elastic strain and E is the Young’s modulus.
4.2. Dynamic tensile tests
Dynamic tensile tests at room temperature were carried out with a Split Hopkinson Tension Bar (SHTB). The tests were conducted at an approximate strain rate of 600 s−1. Considering one-dimensional wave propagation inside the input and output bars [14,17], the specimen engineering stress is given by:
s= F
A0
= EbAb
A0
εt (11)
where F is the force applied over the specimen by the SHTB, Eb is the elastic modulus of the input and output
Figure 2. Video frames for axysimmetric smooth and notched specimens. Figure shows one representative specimen for each one of the different geometry tested under quasi-static conditions. From left to right, the initial, just-before-fracture and just-after-fracture frames.
andεt is the strain of the transmitted wave. The specimen
engineering strain e and strain rate ˙e are:
e=−2c0 ls
t
0
εtdt (12)
˙e=−2c0 ls
εr (13)
where c0=
√
Eb/ρb is the elastic wave propagation
velocity inside the input and output bars,ρb is the mass
density of the bars and lsis the specimen initial length.
The diameters of the fractured specimens were measured and the equivalent plastic strain to failure values were calculated (see Table1).
It should be stressed that dynamic tensile tests, unlike quasi-static tensile tests, are under adiabatic conditions due to its short duration (about 1 ms), causing an increase of temperature in the material.
4.3. Dynamic tensile tests at various temperatures
Dynamic tensile tests (strain rate ∼600 s−1) were also
carried out at−50◦C,−10◦C and 100◦C with the SHTB. The specimens at 100◦C were tested inside a furnace and the specimens at −10◦C and −50◦C were tested inside a cryogenic chamber using dry ice.
Table 1. Equivalent plastic strain to failure data from the experimental tests.
Specimen σ* ¯fPf T [◦C]
Quasi-static regime (2.6×10⁻⁴s−1)
Smooth 0.333 0.407 25
Notched R4 0.505 0.231 25 Notched R2 0.652 0.165 25 Notched R1 0.893 0.129 25
Dynamic regime (600 s−1)
Smooth 0.333 0.469 25
Notched R4 0.505 0.281 25 Notched R2 0.652 0.212 25 Notched R1 0.893 0.176 25
Smooth 0.333 0.472 100
Notched R4 0.505 0.284 100 Notched R2 0.652 0.212 100 Notched R1 0.893 0.172 100
Smooth 0.333 0.460 −10
Notched R4 0.505 0.279 −10 Notched R2 0.653 0.213 −10 Notched R1 0.893 0.169 −10
Smooth 0.333 0.416 −50
Notched R4 0.505 0.250 −50 Notched R2 0.652 0.209 −50 Notched R1 0.893 0.163 −50
The equivalent plastic strain to failure values were also calculated and are recorded in Table1.
5. Calibration of the modified
Johnson-Cook model
Calibrating the modified Johnson-Cook model means obtaining the material constants that better fit the flow and fracture behaviour of the material. Concerning the fracture behaviour (see Eq. (6)), some authors [7,8,18] have demonstrated that stress triaxiality in the centre of axysimmetric specimens is not constant during tensile test, so numerical simulations were used for studying the stress triaxiality histories.
Numerical simulations of the experimental tests were performed using LS-DYNA finite element code with explicit time integration. The used material model was the modified Johnson-Cook model implemented in LS-DYNA [19]. It is important to point that the material model was considered an uncoupled model setting
β =0 (see Eq. (1)). Moreover, the threshold equivalent plastic strain ¯εdp and the critical damage value Dc took
values of 0 and 1, respectively. 5.1. Mesh size study
Figure 3. Stress triaxiality evolution of the critical elements for specimens with different mesh densities.
with notch radii R=4 mm, R=2 mm and R=1 mm, were modelled with 7, 15, 21, 30 elements across the minimum cross section radius.
Once the simulations were performed, stress triaxiality evolution vs the equivalent plastic strain of the critical elements were plotted (see Fig. 3), concluding that 15 element mesh and 21 element mesh are the critical mesh density for smooth and notched specimens.
5.2. Calibration of quasi-static constants
The first group of constants were calibrated using the quasi-static tensile tests of axisymmetric smooth and notched specimens. The specimens were modelled by using four-node 2D axisymmetric elements with reduced integration and a stiffness-based hourglass control. The quasi-static tensile tests were simulated prescribing a displacement to the nodes corresponding to one end of the specimen and fixing the nodes corresponding to the opposite end. Quasi-static loading conditions were controlled [19].
The values of the material constants A,B,n,Q1,Q2,
C1,C2 were determined with the experimental nominal
true stress-plastic strain curves. Figure 4 shows that Voce hardening constitutive relation fits quite well with the experimental values. Moreover, numerical simulations for the axisymmetric smooth specimen showed good agreement with the experimental force-displacement curve (Fig.5).
To determine the fracture parameters D1,D2and D3,
numerical simulations of the quasi-static tensile tests using no failure criterion were performed in order to check which are the most critical elements in the specimens and collect the triaxiality and the equivalent plastic strain histories of such elements until the time step in which the equivalent plastic strain to failure of the simulated specimens were equal to the experimental one. Figure 6 shows clearly that critical elements are those situated in the centre of specimens (axis of symmetry). The stress triaxiality and equivalent plastic strain histories of the critical elements were used to determine, using the Eq. (6), the fracture parameters D1, D2and D3(see Fig.7).
Figure 4. Nominal true stress vs. nominal true plastic strain curves, fitting the material behaviour with the modified Johnson-Cook hardening law with Voce expression.
Figure 5. Load-displacement curve of smooth axisymmetric specimen under quasi-static loading condition compared with the numerical simulation.
5.3. Calibration of c, m, D4and D5
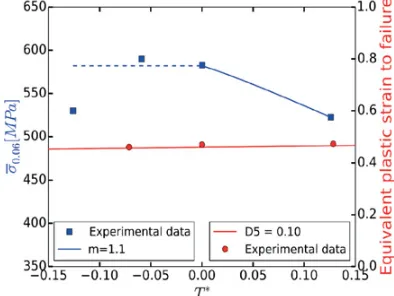
The constant c was obtained analysing the quasi-static and dynamic tensile tests of smooth axisymmetric specimens performed at 25◦C, being c the slope of a line that relates the natural logarithm of the flow stress at a certain equivalent plastic strain with the natural logarithm of the dimensionless plastic strain rate. The thermal softening exponent m was calibrated using the dynamic tensile tests of smooth specimens performed at −50◦C,−10◦C, 25◦C and 100◦C (Fig. 8). Since the flow stress at 0.6% equivalent plastic strain of the smooth specimen tested at −50◦C was lower than that at−10◦C and 25◦C, the material constitutive response at that temperature could not be modelled.
Calibration of D4was similar to that carried out during
the adjustment of D1, D2 and D3, running simulations
of the dynamic tensile tests at room temperature without failure criterion. Stress triaxiality and equivalent plastic strain histories from critical elements were collected and used for adjusting D4parameter. Figure9, showed a good
Figure 6. Variation of the equivalent plastic strain (a) and stress triaxiality (b) along the elements of the minimum cross section for the specimens simulated under quasi-static loading conditions. The values from−1 to 0 of normalized diameter were plotted assuming stress triaxiality and equivalent plastic strain symmetry.
Figure 7. Fracture locus in the equivalent plastic strain to failure vs. triaxiality for the quasi-static regime.
Figure 8. Flow stress at an equivalent plastic strain of 0.6% and equivalent plastic strain to failure against the homologous temperature.
The equivalent plastic strain to failure of the dynamic tensile tests of smooth axysimmetric specimens tested at temperatures of −10◦C, 25◦C, and 100◦C were used for the calibration of the thermal softening constant D5.
Since the constitutive behaviour of the aluminium alloy at −50◦C could not be modelled, its fracture behaviour was
not taken into account. Equivalent plastic strain to failure vs homologous temperature space, which was calculated
Table 2. Modified Johnson-Cook material constants for AA 7075 T3.
Constitutive relation
A[GPa] Q1[GPa] Q2[GPa] C1 C2 c m
0.45 0.13 0 31 0 0.0026 1.1
Failure criterion
D1 D2 D3 D4 D5 −0.14 1.25 −1.37 0.02 0.1
Figure 9. Fracture locus in the equivalent plastic strain to failure vs. triaxiality for dynamic tensile tests at room temperature.
taking into account rising temperature in critical elements, was plotted (Fig.8) to determine the value of D5 with a
linear regression.
Finally, Fig.10shows the good agreement between the experimental nominal true stress-strain curves and those obtained from the simulation.
To conclude, all the constants of the model are showed in Table2.
6. Concluding remarks
Figure 10. Nominal true stress-strain curves for the experimental and simulated dynamic tensile tests at various temperatures. The curves correspond to the smooth specimens.
To reproduce the constitutive behaviour of the material, Voce hardening law was necessary. Experimental results showed a weakening of the material at −50◦C that prevented material modelling at that temperature.
Numerical simulations were needed in order to calibrate the failure criterion since stress triaxiality changes during the loading process. Damage in the material is driven by the accumulated plastic strain and amplified by the stress triaxiality, so the competition between them determines where fracture initiation will occur. In our case, fracture initiates at the centre of the specimen where the stress triaxiality is higher.
Finally, numerical study showed good agreement between the experimental and numerical data; so, a successful calibration was achieved.
They would also like to thank the Spanish Ministry of Science and Innovation for financial support through project BIA2011-24445, and ITP (Industria de Turbopropulsores) for the funding through CENIT-Openaer project.
References
[1] G.R. Johnson, W.H. Cook, in: Proc 7th Int Sympo.
Ballistics, 541–547 (1983)
[2] F.J. Zerilli, R.W. Armstrong, J. Appl. Phys. 61, 1816– 1825 (1987)
[3] G.R. Johnson, W.H. Cook, Eng. Fract. Mech 21, 31– 48 (1985)
[4] T. Børvik, O.S. Hopperstad, M. Langseth, K. Labibes, C. Albertini, Eur. J. Mech. A/Solids 22, 1–13 (2003)
[5] T. Wierzbicki, Y. Bao, Y-W. Lee, Y. Bai, Int. J. Appl. Mech 47, 719–743 (2009)
[6] T. Børvik, O.S. Hopperstad, T. Berstad, M. Langeseth, Eur. J. Mech. A/Solids 20, 685–712 (2001)
[7] B. Erice, F. G´alvez, D.A. Cend´on, V. S´anchez-G´alvez, Eng. Fract. Mech 79, 1–17 (2012)
[8] T. Børvik, O.S. Hopperstad, T. Berstad, Eur. J. Mech. A/Solids 22, 15–32 (2003)
[9] P.W. Bridgman, Studies in large plastic flow and fracture (McGraw-Hill, 1952)
[10] J. Lemaitre, A course on Damage Mechanics (Springer-Verlag, 1996)
[11] G.T. Camacho, M. Ortiz, Int. J. Comp. Meth. Appl. Mech. Eng. 142, 269–301 (1997)
[12] E. Voce, J. Int. Met. 74, 537 (1948) [13] E. Voce, Metallurgia 51, 219 (1955)
[14] M.A. Meyers, Dynamic Behavior of Materials (John Wiley & Sons, INC, 1994)
[15] F.A. McClintock, J. Appl. Mech. 35, 363–371 (1968)
[16] J.R. Rice, D.M. Tracey, J. Mech. Phys. Solids. 17, 201–217 (1969)
[17] H. Kolsy, Stress Waves in Solids (Dover, 1963) [18] S. Dey, T. Børvik, O.S. Hopperstad, M. Langseth,
Comput. Mater. Sci. 38, 176–191 (2006)
![Figure 1. Dimensions [mm] and geometry of the axisymmetricsmooth (upper) and notched (lower) specimens used for theexperimental procedure.](https://thumb-us.123doks.com/thumbv2/123dok_us/8177345.1365704/2.595.321.522.70.188/figure-dimensions-geometry-axisymmetricsmooth-notched-specimens-theexperimental-procedure.webp)