a
Corresponding author: [email protected]
The influence of flow parameters on the transition to turbulence in pulsatile
flow
M. Schmirler1,a, J. Matěcha1, H. Netřebská1, J. Ježek1, J. Adamec1
1CTU in Prague, Faculty of Mechanical Engineering, Department of Fluid Mechanics and Thermodynamics
Abstract. The paper is focused on the experimental investigation of the flow parameters influence (stationary component of flow, frequency, amplitude) on the transition to turbulence in pulsatile flow in a straight square channel. The measurements were performed in water. The wall shear stress (WSS) was measured with the help of Constant Temperature Anemometry (CTA) method using a hot-film flush mounted probe. At the same time the pressure drop was measured using the pressure sensors. The pulsatile flow was generated by superposition of the stationary and oscillatory flow components.
1 Introduction
The onset of turbulence in a purely steady pipe flow has been studied extensively since the pioneering work of Osborne Reynolds 1883 [1]. The issue of transition of laminar flow to turbulent flow in the last-years devoted relatively great attention. While purely laminar and turbulent regions are today, thanks to the rapid development of computers, fairly well mapped, transient flow hides many unknowns. Terms transition to turbulence in unsteady flow is now engaged in many research institutions, both theoretically and experimentally. The research is not only the transition to turbulence, but also its effect on the friction coefficient [2]. In many cases, the pulsatile flow is taken as a superposition of the stationary and oscillatory components.
Typically, transition in a pipe occurs when the Reynolds number Re c d/ (where c \cross-sectional average velocity, d \pipe diameter, and \kinematic viscosity) exceeds 2000. Wygnanski and Champagne in 1973 [3] point out that transition can be delayed to 4
Re 5 10 if the pipe is perfectly smooth so that no disturbances are introduced into the inlet. Transition can also be found at Reynolds numbers below 2000, if large disturbances are induced at the inlet by a grid or orifice plate [3], [4]. Previous authors have also studied the onset of turbulence in purely oscillatory flow with no mean component [5], [6], [7], [8]. These studies have shown that transition occurs when the oscillatory Reynolds number
Reoscu dosc / (where uosc is the maximum cross-sectional
average velocity) exceeds the critical value shown below:
Reosc const, (1)
where r
/ 0,5 (r \pipe radius and \longitudinal velocity of liquid) is also called the Womersley parameter, because it was first used by Womersley in 1955 [9] to determine oscillatory velocity profiles theoretically. For laminar oscillatory flows, the Womersley solution accurately predicts the wall shear stress and the velocity at any radial position as a function of time [5], [6]. Transition in pulsatile pipe flow, consisting of a mean flow with a superimposed oscillatory component, has also been investigated by several authors (Sarpkaya in 1966 [10], Gerrard in 1971 [11], Nerem et al. in 1971 [12], Nerem and Seed in 1972 [13], Clamen and Minton in 1977 [14], Ramaprian and Tu in 1980 [15], Stettler and Hussain in 1986 [16], Tozzi and von Kerczek in 1986 [17] and Iguchi and Ohmi in 1984 [18]). Flow in channels of non-circular cross-sections have dealt with for example Kerczek in 1982 [19] or Liberto in 2011 [20]. The research described in this article follows the previous measurements using the LDA (Laser Doppler Anemometry) method in the pipeline in 2001 [21].2 Materials and methods
The paper focuses on the experimental investigation of the influence of selected current parameters ( Restac, Reosc, ) on the position of the start and end of the transition to turbulence in a channel with a square cross-section. Schema of used device is shown in Figure 1. Pulsatile flow in the channel was generated by composition of a stationary and oscillatory flow. Stationary flow was generated by the pressure in the reservoir and regulated by the regulation valve.
C
The oscillatory part of the flow was generated by a pulsator with a crank mechanism (Figure 2). The ratio between a piston rod and the radius of the crankshaft was in all cases greater than 100.
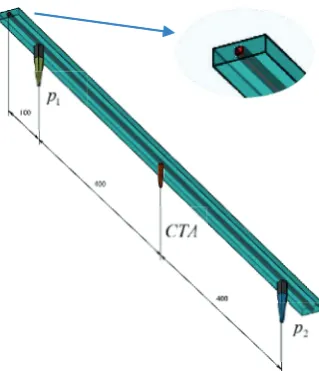
A narrow channel with a square cross-section was used as an experimental model (Figure 3) and clear water was used as a working fluid.
A value of the output voltage on the CTA bridge in the middle of the tested channel was recorded during the experiment. By the help of the CTA the laminar and turbulent flow was recognized. Next the pressure at the beginning and at the end of the tested section was measured to evaluate the friction losses. Last the exact location of a piston was measured to the identification of the transition area position.
The hot-film probe type flush-mounted was used for CTA measurement. DISA 55M10 was used as the CTA bridge, the voltage signal was recorded by measuring card NI SCC-68. The method of PIV (Particle Image Velocimetry) can be also use for the identification of the point of transition to turbulence [22]. In that case, it is very important to set the PIV system parameters correctly, as well as to use a correct size of a seeding particles [23].
The piston position was measured by a linear potentiometer with a subsequent recording of the output voltage.
3. Results
The first stationary measurement was performed to verify the correct functioning of the experimental setup. The Reynolds number have been defined as follows:
Re c a,
(2)
where the characteristic dimension a means a side length of a square channel, c is a relevant velocity and is a kinematic viskosity.
Fig. 1. Scheme of an experimental setup. Legend: 1- pulsator, 2- reservoir 200ltr., 3- detention tank, 4- flowmeter, 5- tested channel, 6- pump, 7- compressor, 8- regulation pressure valve, 9- shut-of valve.
Fig. 2. Scheme of a crank mechanism and a flow superposition.
Fig. 4. The results from the stationary CTA measurement. A typical values of were selected.
Fig. 3. Tested channel; total length 1000mm, cross section 5x5mm.
It was gradually increased Reynolds number from 0 to Re 10 000 during this measurement.The value of WSS have been recorded. The results are shown in Figure 4.
There is very evident transition from laminar to turbulent flow in the picture. The value of Restac for the transition to the full turbulent flow corresponds with the well-known value 2300.
The subsequent measurements were focused on pulsatile flow generated by the composition of a stationary and oscillatory flow. The aim of the measurements was to evaluate the influence of the stationary componentRestac, oscillatory component Reosc and the frequency parameter to shift the time of transition to turbulence. The influence of Restac is shown in Figure 5:
The point of transition was recognized visually. These points are shown in the Figure 6.
The results of the dependence of the transition point on the stationary part of the flow, represented by Restac , for all tested regimes are shown in the Figure 7.
The graph in Figure 7 shows that the stationary part of the flow shifts the transition point closer to the top of the wave. Next it can be seen that the critical Reynolds numbers are, due to the pulsations, moved above the limit for the laminar stationary flow.
Fig. 7. The dependence of the on the stationary part of the flow.
Fig. 5. The influence of the on the transition to turbulent flow.
Fig. 6. The identified points of transition to turbulence displayed in
one period for different ( ).
Next the influence of oscillatory part of the flow on the position of the point of transition was tested. The CTA record for selected value of Restac and is shown in the Figure 8.
The points of transition to turbulent flow were visually recognized for all tested flow conditions. The selected results for one regime of the flow is shown in the Figure 9 and all tested results in the Figure 10.
Finally the all tested flow conditions are shown in the Figure 11.
Fig. 9. The identified points of transition to turbulent flow for and
Fig. 11. All tested regimes in the plane ( ).
Lam
Tr
Turb
Fig. 8. The CTA record for and
As could be observed, the pulsations in the flow shift the point of transition to higher values of Re.
4. Conclusion
The experiments showed the effect of various parameters of pulsating flow (Restac, Reosc, ) to shift the point of transition to turbulence. As shown, increased the value of the stationary component shifts the transition point backwards, while a higher value of the shifts the transition point forward, that means the transition point has been delayed. Changing the oscillatory component does not shift the transition point. In all cases, it was confirmed, that the pulsations in the flow help to stabilize the laminar flow, even at relatively high values of Re corresponding to a fully turbulent stationary flow.
5. Acknowledgement
This research has been supported by MSM6840770035 - The Development of Environmental - Friendly Decentralized Power Engineering (2007-2013, MSM) and EU Regional Development Fund in OP R&D for Innovations (OP VaVpI) and Ministry for Education, Czech Republic, project # CZ.1.05/2.1.00/03.0125 Acquisition of Technology for Vehicle Center of Sustainable Mobility.
6. References
[1] O. Reynolds, Phil Trans, 174-935 (1883)
[2] T.S. Zhao, P. Cheng, Int. Journal Heat and Fluid Flow,
17, 356-362 (1996)
[3] I.J. Wygananski, F.H. Champagne, J. Fluid Mech, 59, 281-335 (1973)
[4] D. Coles, Proc. Indian Acad. Sci. 4, 111 (1981)
[5] R. Akhavan, R.D. Kamm, A.H. Shapiro, J. Fluid Mech,
225, 423-444 (1991)
[6] D.M. Eckmann, J.B. Grotberg, J Fluid Mech, 222, 329-350 (1991)
[7] M. Hino, M. Sawamoto, S. Takasu, J Fluid Mech, 75, 193-207 (1976)
[8] P. Merkli, H. Thomann, J Fluid Mech, 68, 567-575 (1975)
[9] J.R. Womersley, J Physiol., 127, 553 –563 (1955)
[10] T. Sarpkaya, Trans ASME D, J Basic Eng, 88, 589-598 (1966)
[11] J.H. Gerrard, J Fluid Mech, 46, 43-64 (1971)
[12] R.M. Nerem, W.A. Seed, N.B. Wood, J Fluid Mech, 137–160 (1971)
[13] R.M. Nerem, W.A. Seed, Cardiovascular Res, 6, 1-14 (1972)
[14] M. Clamen, P. Minton, J Fluid Mech, 81, 421-431 (1977)
[15] B.R. Ramaprian, S. Tu, J Fluid Mech, 100, 513-544 (1980)
[16] J.C. Stettler, A.K.M. Hussain, J Fluid Mech, 170, 169-197 (1986)
[17] J.T. Tozzi, Ch. von Kerczek, J Appl Mech, 53, 187-192 (1986)
[18] M. Iguchi, M. Ohmi, Part III, Bull JSME, 27, 1873–1880 (1984)
[19] Ch. von Kerczek, J Fluid Mech, 116, 91-114 (1982)
[20] M. Liberto, M. Ciofalo, Computers & Fluids, 49, Elsevier, 258-275 (2011)
[21] J. Adamec, J. Nožička, D. Hanus, J. Kořenář, J. of Propulsion and Power,17, 1133-1136, AIAA (2001)
[22] R. Trip, D.J. Kuik, J. Westerweel, C. Poelma, Phys.Fluids, 24, 014103 (2012)