IJEDR1503003
International Journal of Engineering Development and Research (www.ijedr.org)1
Reliability Enhancement of Radial Distribution
System Using Network Reconfiguration
1Umesh Agarwal, 2Monika Vardia
1 PG student, 2 Asst. Professor, 1 electrical engineering department,
1 Geetanjali institute of technical studies, Udaipur, India
________________________________________________________________________________________________________
Abstract - Reliability analysis of distribution system ensures the availability of supply at the end of customer terminals.
Distribution system is one of the most important part of power system as distribution system is the only link between utility and consumers. During the last few years this area has received great interest. A considerable number of papers have been published describing the development and modelling of distribution system and different techniques to evaluate the reliability indices. This paper describes the network reconfiguration technique to evaluate the reliability indices and to improve them. It also consists the best optimal network configuration that suits for best reliable system. To explain this technique RBTS-6 BUS system is considered from which BUS-2 is chosen for analysis purpose.
Index terms - radial distribution system, reliability, network reconfiguration
________________________________________________________________________________________________________
I.INTRODUCTION
The distribution system is one of the most important part of power system as it connects the utility with consumers. Most of the distribution systems in practice have a radial configuration so these distribution systems are considered for analysis purpose because of less complexity and easy accessibility. In radial distribution system all components must be operative between load and supply for successful operation of power system. If there is any fault then there will unavailability of supply for the consumers till fault cleared. The reliability of distribution system can be improved by network reconfiguration which can be done by closing normally opened switch (NO) and opening normally closed switches (NC) [1]. Two types of switches are normally used in distribution system that are sectionalizing switch and tie switch. First one is used to disconnect the faulty section from rest of the system and second one is used to restore the system downstream the faulted section from auxiliary supply. This will reduce the fault duration for load points downstream the faulted section [2].
A number of methods have been proposed to solve network reconfiguration to minimize losses, such as integer programming [3] and artificial neural network [4] and simulated annealing [5]. Other constraints may be taken into account, for example load balancing [5], introduction of distributed generation [6].
Tsai, L. H. presented a model for improving the reliability of electric distribution systems through network reconfiguration. Two main reliability indices are targeted to be minimized: system average interruption frequency (SAIFI) and the system average interruption duration (SAIDI). The mathematical formulations for calculating the change of SAIDI and SAIFI as a result of reconfiguration were developed to identify beneficial load transfers. However, his method did not take into account reliability worth, which can be described in terms of customer interruption costs.
Ye Bin et. al proposed network reconfiguration to increase reliability worth by an improved genetic algorithm. The mathematical model is formulated in which its objective function is to minimize customer interruption costs. The procedure was illustrated by the distribution system connected at bus 2 of the 6-bus Roy Billitton Test System (RBTS). It is shown from their studies that their developed methodology permits flexible use of sectionalizing and tie switches without introducing additional costs while being able to achieve large possible economic benefit
The emphasis in this paper is given on SAIFI, SAIDI, ASUI, ASAI and CAIDI. All these are reliability indices for distribution system. All these parameters are calculated for different configurations of BUS-2. Five cases are created and the best optimal solution of network configuration is obtained. The purpose of this paper is to extend the RBTS to include distribution systems that contain the main elements found in practical systems but which are sufficiently small that they can be easily analyzed using hand calculations. The paper contains all the basic data needed to perform continuity analyses together with limited load flow data so that some design studies containing load flow solutions are also possible. The paper also contains basic results of continuity studies for a range of sensitivity studies and alternative design/operating configurations.
II.DESCRIPTIONOFTHEDISTRIBUTIONNETWORK
The RBTS has 5 bus bars (BUS2- BUS6) from which BUS2 is selected for analysis purpose. BUS2 have generation associated with it so effect of generation and transmission on all load points can also be seen. All details of customer type and load is given in table
TABLE 1. PEAK LOAD IN THE RBTS BUS 2
Customer type Peak load, MW
RESIDENTIAL 7.25
SMALL USERS 3.50
IJEDR1503003
International Journal of Engineering Development and Research (www.ijedr.org)2
COMMERCIAL 3.70
TOTAL 20
TABLE 2.FEEDER TYPE AND LENGTHS (BUS 2)
Feeder type Length(KM) Feeder section numbers
1 0.60 2 6 10 14 17 21 25 28 30 34
2 0.75 1 4 7 9 12 16 19 22 24 27 29 32 35 3 0.80 3 5 8 11 13 15 18 20 23 26 31 33 36
TABLE 3. CUSTOMER DATA
S1
F1
LP1 LP2
S2
S3
S4
LP3 LP4
LP5 LP6
LP7
F2
F3
F4
LP8
LP9
LP10
LP11 LP12
LP13 LP14
LP15
LP16
LP17
LP18
LP19
LP20
LP21 LP22
S5
S6
S7
S8
S9
S10
S11
S12
S13
S14
NO
NO
FIGURE 1. DISTRIBUTION SYSTEM FOR RBTS BUS 2 These assumptions are made for the above distribution system.
a) Residential, commercial and government/institution loads are metered on the low voltage side and the transformer is utility property and included in the analysis. The small user loads are metered on the high voltage side and the transformer is customer property and not included.
Number of load points Load points Customer type Load level per load point, MW Number of customers
average peak
BUS 2
5 1-3, 10, 11 Residential 0.535 0.8668 210
4 12, 17-19 Residential 0.450 0.7291 210
1 8 Small users 1.00 1.6279 1
1 9 Small users 1.15 1.8721 1
6 4,5,13,14,20,21 Govt./Inst. 0.566 0.9167 1
IJEDR1503003
International Journal of Engineering Development and Research (www.ijedr.org)3
b) The feeders are operated as radial feeders but connected as a mesh through normally open sectionalizing points. Followinga fault on a feeder, the ring main units permit the sectionalizing point to be moved and customers to be supplied from alternative supply points.
c) The loading level of BUS2 (2OMW)only justifies a single supply point. d) All breakers in the system are identified and considered as 100% reliable. e) All the 11kv and laterals are considered as overhead lines.
In table 3 all details about the customer type, average load, peak load and number of customers connected with each load point is given. With the help of this customer data, we can obtain all feeder data and can obtain the reliability of the system and this loading data is shown in table 4.
TABLE 4. LOADING DATA OF FEEDER
Feeder number Load points Feeder load, MW Number of customers average peak
BUS 2
F1 1-7 3.645 5.934 652
F2 8-9 2.15 3.500 2
F3 10-15 3.106 5.057 632
F4 16-22 3.390 5.509 622
BUS 2 total 12.291 20 1908
III.NETWORKRECONFIGURATIONTECHNIQUE
As shown in above figure, the distribution network consists of 4 feeder with 22 total load points and 2 tie switches that are normally open switch and 14 sectionalizing switch. In this network various configurations of network can be designed by changing the opening and closing sequence of different switches.
IJEDR1503003
International Journal of Engineering Development and Research (www.ijedr.org)4
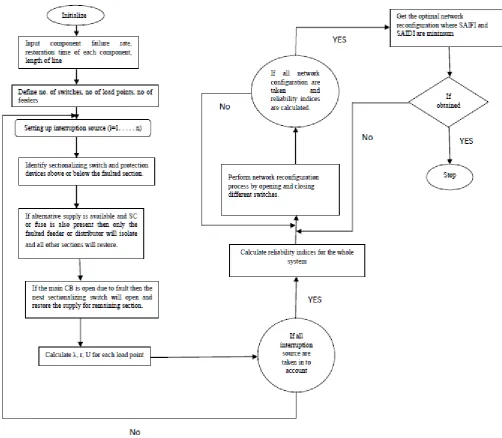
FLOW CHART FOR NETWORK RECONFIGURATION TECHNIQUE
In this paper 5 cases are examined and reliability parameters named SAIFI, SAIDI, CAIDI, ASAI and ASUI are calculated for all these 5 cases. To calculate all these parameters we need some basic load point indices and these are failure/ year (λ), repair hours (r) and hours/ year (U). All these parameters for all cases all shown in this paper and finally comparison between all cases is given.
Basic system and reliability data that uses in this paper is given below.
TABLE 5. SYSTEM AND RELIABILITY DATA
Component λ (failure/year) r (hrs) S (hrs) rp (hrs)
Line (11kv) 0.065 5 1 -
Transformer (11/0.415 KV)
0.015 200 1 5
S= switching time (hrs) rP= replacement time (hrs) r = repair time (hrs)
IV.RESULTANALYSISFORRBTSBUS2USINGNETWORKRECONFIGURATION
All the data given in above tables, can be utilizes to calculate the reliability indices for each feeder. In this analysis firstly the base case is considered in which system have disconnects- fuse- alternate supply- replacement of transformer. All results for base case are shown in table 6. For all other cases results are shown in table 7.
Assumptions:
IJEDR1503003
International Journal of Engineering Development and Research (www.ijedr.org)5
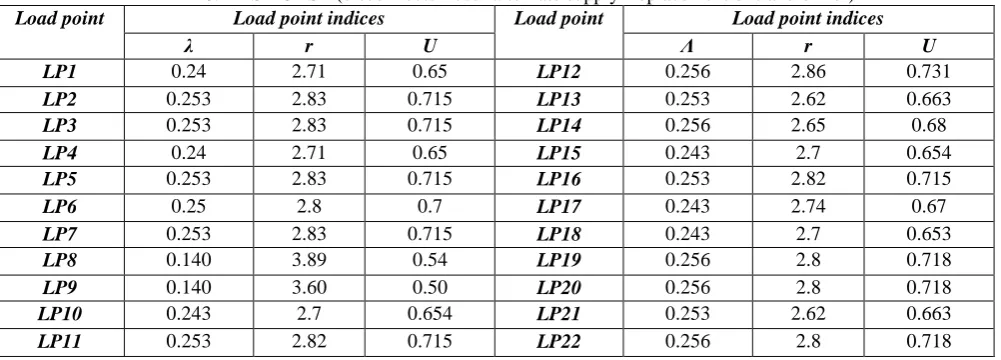
TABLE 6. BASE CASE (disconnects- fuse- alternate supply- replacement of transformer)Load point Load point indices Load point Load point indices
λ r U Λ r U
LP1 0.24 2.71 0.65 LP12 0.256 2.86 0.731
LP2 0.253 2.83 0.715 LP13 0.253 2.62 0.663
LP3 0.253 2.83 0.715 LP14 0.256 2.65 0.68
LP4 0.24 2.71 0.65 LP15 0.243 2.7 0.654
LP5 0.253 2.83 0.715 LP16 0.253 2.82 0.715
LP6 0.25 2.8 0.7 LP17 0.243 2.74 0.67
LP7 0.253 2.83 0.715 LP18 0.243 2.7 0.653
LP8 0.140 3.89 0.54 LP19 0.256 2.8 0.718
LP9 0.140 3.60 0.50 LP20 0.256 2.8 0.718
LP10 0.243 2.7 0.654 LP21 0.253 2.62 0.663
LP11 0.253 2.82 0.715 LP22 0.256 2.8 0.718
SAIFI = Σ (λi * Ni) / Nt (system average interruption frequency index) SAIDI= Σ (Ui * Ni) / Nt (system average interruption duration index) CAIDI = SAIDI
SAIFI (customer average interruption duration index) ASAI= 1- SAIDI
8760 (average service availability index) ASUI = 1- ASAI (average service unavailability index)
These are some of the reliability that are calculated in this paper. These parameters are calculated for all 5 cases and the final result is shown in the following table.
TABLE 7. EFFECT OF RECONFIGURATION OF RBTS 2 BUS SYSTEM ON SAIFI, SAIDI AND CAIDI
CASE (System parameters) SAIFI SAIDI CAIDI ASAI ASUI
Base case as per RBTS 0.248 0.6916 2.788 0.999921 0.000079
When LP7 is shifted to feeder 2 and NO switch is closed and sectionalizing switch S4 is opened. F3 and F4 remains unchanged.
0.234 0.678 2.89 0.999922 0.000078 When both NO open switch are closed and LP7 is shifted in feeder 2 and
LP15 in feeder 4
0.2347 0.670 2.855 0.999923 0.000077 When LP5, LP6 and LP7 are shifted to feeder 2 by closing the NO switch
and feeder 3 and feeder 4 are same as base case
0.219 0.663 3.02 0.999924 0.000076 When both NO switch are closed.
LP5, LP6 and LP7 are shifted to feeder 2 and LP15 to feeder 4.
0.219 0.655 3.0 0.999925 0.000075
V.CONCLUSION
This paper has presented a meaningful analysis of RBTS BUS2 system using network reconfiguration technique and from the results obtained, we can see that the CASE 5 ( when both NO switch are closed and LP5,LP6,LP7 are shifted to feeder 2 and LP15 is shifted to feeder 4) is the best optimal network reconfiguration among the all other cases.
According to this paper we can analyze that an improvement of 11.6% is obtained in SAIFI and an improvement of 5.29% is obtained in SAIDI because of this network reconfiguration technique. This technique can also be used in cost worth analysis of distribution system where EENS and ECOST are calculated for network for each configuration to justify that each dollar is used at proper place to improve the reliability of system, but this is not the scope of this paper. Finally the conclusion of this paper is that by network reconfiguration technique, reliability indices of the radial distribution system can be improved.
VI.REFERENCES
[1] Brown, R. E. (2001). Distribution Reliability Assessment and Reconfiguration Optimization, IEEE Transmission and Distribution Conference and Exposition, Vol. 2, pp. 994-999, ISBN 0780372859, USA, October 2001, Atlanta.
[2] Chowdhury, A. A. & Koval, D. O. (2001). Application of Customer Interruption Costs in Transmission Network Reliability Planning, IEEE Transactions on Industry Application (November/December 2001), Vol. 37, No. 6, pp. 1590-1596. [3] Sarma, N. D. R. & Prakasa Rao, K. S. (1995). A New 0-1 Integer Programming Method of Feeder Reconfiguration for Loss
Minimization in Distribution Systems, Electric Power Systems Research, (May 1995), Vo. 33, No. 2, pp. 125-131. [4] Kashem, M. A.; Jlasmon G. B.; Mohamed A. & Moghavvemi M. Artificial Neural Network Approach to Network
Reconfiguration for Loss Minimization in Distribution Networks, Electrical Power and Energy Systems, (May 1998), Vol. 20, No. 4, pp. 247- 258.
[5] Chang, H. & Kuo, C. (1994). Network Reconfiguration in Distribution Systems Using Simulated Annealing, Electric Power Systems Research, (May 1994), Vo. 29, No. 3, pp. 227-238.
[6] Zhou, Q.; Shirmohammadi, D., & Liu, E. (1997). Distribution Feeder Reconfiguration for Service Restoration and Load Balancing, IEEE Transactions on Power Systems, (May 1997), Vol. 12, No. 2, pp. 724-729.
IJEDR1503003
International Journal of Engineering Development and Research (www.ijedr.org)6
[8] Billinton R., Kumar S., Chowdhury N., Chu K., Goel L. , Khan E., Kos P., Nourbakhsh G. and Oteng-Adjei J., "A ReliabilityTest System for Educational Purposes - Basic Results", IEEE Summer Power Meeting, 1989, paper 89 SM 645-3 PWRS. [9] Billinton R. and Allan R.N., "Reliability Evaluation of Power Systems", Plenum Publishing (New York), 1984.
[10] Billinton R. and Allan R.N., "Reliability Evaluation of engineering Systems", Plenum Publishing (New York), 1983.
APPANDIX:-
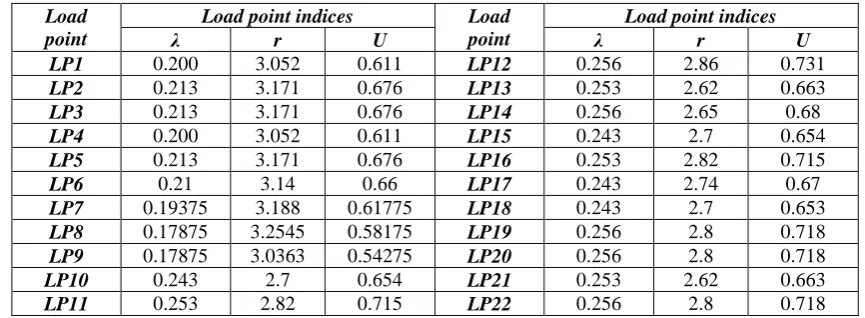
TABLE 8. WHEN LOAD POINT 7 IS SHIFTED TO FEEDER 2 AND FEEDER 3 AND FEEDER 4 REMAINS SAME AS BASE CASE.
Load point
Load point indices Load
point
Load point indices
λ r U λ r U
LP1 0.200 3.052 0.611 LP12 0.256 2.86 0.731
LP2 0.213 3.171 0.676 LP13 0.253 2.62 0.663
LP3 0.213 3.171 0.676 LP14 0.256 2.65 0.68
LP4 0.200 3.052 0.611 LP15 0.243 2.7 0.654
LP5 0.213 3.171 0.676 LP16 0.253 2.82 0.715
LP6 0.21 3.14 0.66 LP17 0.243 2.74 0.67
LP7 0.19375 3.188 0.61775 LP18 0.243 2.7 0.653
LP8 0.17875 3.2545 0.58175 LP19 0.256 2.8 0.718
LP9 0.17875 3.0363 0.54275 LP20 0.256 2.8 0.718
LP10 0.243 2.7 0.654 LP21 0.253 2.62 0.663
LP11 0.253 2.82 0.715 LP22 0.256 2.8 0.718
TABLE 9.WHEN BOTH NO OPEN SWITCH ARE CLOSED AND LOAD POINT 15 IS CONNECTED WITH FEEDER 4 AND LOAD POINT 7 IS CONNCEVTED WITH FEEDER 2
Load point
Load point indices Load
point
Load point indices
λ r U λ r U
LP1 0.200 3.052 0.611 LP12 0.20675 2.972 0.6145
LP2 0.213 3.171 0.676 LP13 0.2035 3.02 0.6145
LP3 0.213 3.171 0.676 LP14 0.208 3.04 0.631
LP4 0.200 3.052 0.611 LP15 0.291 3.101 0.702
LP5 0.213 3.171 0.676 LP16 0.301 2.538 0.764
LP6 0.21 3.14 0.66 LP17 0.291 2.458 0.715
LP7 0.19375 3.188 0.61775 LP18 0.291 2.41 0.702
LP8 0.17875 3.2545 0.58175 LP19 0.304 2.524 0.767
LP9 0.17875 3.0363 0.54275 LP20 3.04 2.524 0.76725
LP10 0.19375 3.12 0.60475 LP21 0.301 2.365 0.712
LP11 0.2035 3.275 0.667 LP22 0.304 2.395 0.728
TABLE 10 WHEN SWITCH 3 -4 ARE OPEN AND LOAD POINT 5,6,7ARE SHIFTED TO FEEDER 2 AND FEEDER 3 AND FEEDER 4 REMAINS SAME AS BASE CASE
Load point
Load point indices Load
point
Load point indices
λ r U λ r U
LP1 0.1515 3.71 0.5625 LP12 0.256 2.86 0.731
LP2 0.1645 3.81 0.6275 LP13 0.253 2.62 0.663
LP3 0.1645 3.81 0.6275 LP14 0.256 2.65 0.68
LP4 0.1515 3.71 0.5625 LP15 0.243 2.7 0.654
LP5 0.2425 2.91 0.7055 LP16 0.253 2.82 0.715
LP6 0.24 2.87 0.689 LP17 0.243 2.74 0.67
LP7 0.2425 2.75 0.6665 LP18 0.243 2.7 0.653
LP8 0.2425 2.91 0.7055 LP19 0.256 2.8 0.718
LP9 0.2425 2.75 0.6665 LP20 0.256 2.8 0.718
LP10 0.243 2.7 0.654 LP21 0.253 2.62 0.663
IJEDR1503003
International Journal of Engineering Development and Research (www.ijedr.org)7
CASE 5 WHEN SWITCH 3 IS ALSO OPENED AND ALL 3 LOAD POINT (5, 6, and 7) ARE CONNECTED WITH FEEDER2 AND LOAD POINT 15 IS CONNECTED WITH FEEDER 4. Load
point
Load point indices Load
point
Load point indices
λ r U λ r U
LP1 0.1515 3.71 0.5625 LP12 0.20675 2.972 0.6145
LP2 0.1645 3.81 0.6275 LP13 0.2035 3.02 0.6145
LP3 0.1645 3.81 0.6275 LP14 0.208 3.04 0.631
LP4 0.1515 3.71 0.5625 LP15 0.291 3.101 0.702
LP5 0.2425 2.91 0.7055 LP16 0.301 2.538 0.764
LP6 0.24 2.87 0.689 LP17 0.291 2.458 0.715
LP7 0.2425 2.75 0.6665 LP18 0.291 2.41 0.702
LP8 0.2425 2.91 0.7055 LP19 0.304 2.524 0.767
LP9 0.2425 2.75 0.6665 LP20 3.04 2.524 0.76725
LP10 0.19375 3.12 0.60475 LP21 0.301 2.365 0.712