THE DEVELOPMENT OF SMART HOUSE MODEL IN GARUT; THE
ADVANCEMENT OF NON-FORMAL EDUCATION PROGRAM
Bambang Sudaryana1
1Sekolah TinggiIlmuEkonomi (STIE) CipasungTasikmalaya West Java
Indonesia
ABSTRACT
Article History
Received: 12 June 2018 Revised: 17 July 2018 Accepted: 1 August 2018 Published: 7 August 2018
Keyword
s
Smart home Innovation
Non-formal education.
Smart House is a means to involve citizens in inclusive education; an additional education outside of school. In Smart House, especially school-aged children can explore their own potential as well as motivate themselves to achieve a higher intelligence level. In Smart House, there are five centers of education, including the library space with 6000 copies of books collection, and centers of educational facilities. The objective of this study is to identify communication strategies, the role of Smart House as non-formal education, and to know the factor supporting and inhibiting it. The method used is a descriptive quantitative method to describe data objectively; data collection is conducted through observation, interview, and documentation. The number of respondents in this study was 50. Based on this study, it was found that many people do not take advantage of Smart House due to factors come from Smart House, and factors come from the community. The study concludes that the role of Smart House affects the access of services of non-formal education programs, as well as the function, the purpose, and the benefits of Smart House as a place of learning from children to the elderly with activities that meet the needs of the poor people. The impact of Smart House is the increasing power of intellectual for rural children at the age of learning and as an accommodation of creativity for the population, and it is helpful to increase family income.
1. INTRODUCTION
Law of the Republic of Indonesia Number 20 of 2003 on National Education System, article 1, paragraph (10), Education Unit is a group of educational services that provide education in formal, non-formal and informal at all levels and types of education; Paragraph (12) Non-formal education is the path of education outside formal education that can be structured and tired. Many difficulties face by non-formal education, which often involves a failure or lack of success of an education program outside of school, and finally, there are also new problems before us, namely weakness in diagnosing the program planning. It comes at less clever planner in identifying problems and needs of what is actually desired by the community, as well as less ability to dig, set and tapped potential sources exist, unconceptualized program, less understanding, less awareness and responsibility towards programs carried out, either from the executor, officials and the public, the heterogeneity of educational background and experience of the officers, on the one hand, may cause a sharp distinction, in this case, the value of the skill and
Asian Journal of Contemporary Education
ISSN(e): 2617-1252DOI: 10.18488/journal.137.2018.22.84.89 Vol. 2, No. 2, 84-89
ability he had. Curriculum developed to meet these needs often grow with poor detail, weakness in the methods or ways of approaching formal, so that the distance between the source of learning and learners is far away. It will affect the learning process and results, attitude of the learners who are less seriously , the lack of ability of citizens to learn to self-employment, limited facilities and infrastructure set factors supporting activity, lack of coordination and cooperation with the agency or institution, and methods of supervision, monitoring and evaluation is still not quite right, in the sense of lacking systemic and less methodical process, it is difficult to know whether a program was successful or unsuccessful.
The concept of Smart House in Garut is the sustainability of ideas from First Lady of the Republic of Indonesia, Mrs. Ani Susilo Bambang Yudhoyono and Solidarity of United Indonesia Cabinet Wives. Smart House is a form of idealism from community leaders in providing services to the community in shaping the character and personality of the people in District of Garut The establishment of a Smart House is inseparable from the role of community leaders and the Government of Garut District, which is implemented in real activity that contributes to society. Awareness of community leaders was able to provide the public awareness of the importance of a contented activity that can bridge between the needs of the community with the facilities and the organization.
1.1. Research Question
How the influence of The Model of Non-formal education management and Implementation of innovation management functions of non-formal education to Improving the Welfare of the Poor?
1.2. Hypotheses
The above model shows the relationship between the dimensions of National Economy the following hypotheses will depict the relationships under study:
H1: The Model of Non-formal education management (X1) have a positive influence on Improving the
Welfare of the Poor (Y)
H2: Implementation of innovation management functions of non-formal education (X2) have a positive
influence on Improving the Welfare of the Poor (Y)
H3: The Model of Non-formal education management (X1) and implementation of innovation management
functions of non-formal education (X2) have a positive influence on Improving the Welfare of the Poor (Y)
2. METHODOLOGY
The topics are the research design used for this study, the research instrument used for data collection, population and sample, and data analysis.
2.1. Research Design
This study adopted the quantitative research method to address the research problem as it is the most practical and cost-effective under the circumstances. This approach allows for verifications to be carried out scientifically and statistically. The cross-sectional survey design is cost-effective because data collection is carried out only once
(Sugiyono, 2016).
2.2. Research Instrument
The research instrument used in this study was taken from various sources. Firstly, the National Economy Development were taken from Gross Development Product and Gross National Product literature (Ball, 1993).
measurement for the variables under these constructs was measured on a Likert scales of 1 to 5 with 1 representing strongly disagree and 5 strongly agree.
The amended questionnaire was used for the pilot test on Company owners and managers. One hundred the community members were contacted and 80 responded positively to participate in the pilot test. The questionnaire was administered either face to face or through the email. Factor analysis was conducted on the data to determine the number of factors and their reliability. The results of the pilot test show that the independent variables were grouped into 6 factors. The further test using the reliability test showed that the factors have reasonably high Cronbach alphas.
3.RESULTANDDISCUSSION
3.1. Correlation between The Model of Non-formal education management (X1), the implementation of
innovationmanagementfunctions-function non-formal education (X2), with Improving the Welfare ofthe Poor (Y)
By using SPSS 17 is known that the correlation coefficient multiple between variables The Model of Non-formal education management (X1), the implementation of innovation management functions of non-Non-formal education (X2), with Improving the Welfare of the Poor (Y) are shown in the table as follows
Table-1. Correlations
Quality Implementation Performance
Kendall's tau_b Model Correlation Coefficient 1.000 .817** .938**
Sig. (2-tailed) . .000 .000
N 78 78 78
Innovation Correlation Coefficient .817** 1.000 .874**
Sig. (2-tailed) .000 . .000
N 78 78 78
Welfare Correlation Coefficient .938** .874** 1.000
Sig. (2-tailed) .000 .000 .
N 78 78 78
Spearman's rho Model Correlation Coefficient 1.000 .840** .974**
Sig. (2-tailed) . .000 .000
N 78 78 78
Innovation Correlation Coefficient .840** 1.000 .913**
Sig. (2-tailed) .000 . .000
N 78 78 78
Welfare Correlation Coefficient .974** .913** 1.000
Sig. (2-tailed) .000 .000 .
N 78 78 78
**. Correlation is significant at the 0.01 level (2-tailed).
Based on Table 1 the results of correlation Kendall's tau b is known that variable The Model of Non-formal education management (X1) has a very close relationship with the variable Improving the Welfare of the Poor (Y) of 0.938, or by 93.80% and variable the Implementation of innovation management functions of non-formal education (X2) also has close links with the variable Improving the Welfare of the Poor (Y) of 0.874 or 87.40% and the Model of Non-formal education management (X1) has a close relationship with the variable the Implementation of innovation management functions of non-formal education (X2) of 0.817 or 81.70%
Improving the Welfare of the Poor by 98.90% due to changes in the model of non-formal education management (X1) and The Implementation of innovation management functions of non-formal education (X2).
3.2. The Model of Non-formaleducation management ( X1) significant influence onImproving the Welfare of
the Poor (Y)
Based on the correlation data that the influence of variables The Model of Non-formal education management (X1) to Improving the Welfare of the Poor (Y) which is calculated with a correlation coefficient of 0, 989 or (rx1y) = 0, 989. This suggests the effect is very closely, when compared with the coefficient as follows:
1. 0,00 - 0,20 the relationship is very small and can be ignored 2. 0,20 - 0,40 small relationship (not tight)
3. 0,40 - 0,70 the relationship is moderate (close enough) 4. 0,70 - 0,90 tight relationship
5. 0,90 - 1,00 a very close relationship
Meanwhile, to declare the size of the contribution of variable X1 to Y variable or determinant coefficient = r2 X 100% or (0, 989) 2 x 100% = 97.81% while the remaining 2.19% is determined by other variables. Then to find significant levels of correlation coefficients X1 on Y with methods one side (one tailed) of ouput Measured probability) yields 0.00 figure. Because the probability is much below 0.05, then the influence of The Model of Non-formal education management to Improving the Welfare of the Poor is significant.
Table-2. Model Summaryb
Model R R Square Adjusted R Square Std. Error of the Estimate Durbin-Watson
1 .989a .978 .977 1.44654 .563
a. Predictors: (Constant), Model, Innovation b. Dependent Variable: Welfare
Table-3. Coefficientsa
Model
Unstandardized
Coefficients Standardized Coefficients
t Sig.
Collinearity Statistics
B Std. Error Beta Tolerance VIF
1 (Constant) 1564 1.496 .377 .707
Model .712 .026 .733 27.462 .000 .412 2.430
Innovation .281 .024 .618 11.528 .000 .412 2.430
a. Dependent Variable: Welfare
From the coefficient table illustrates that simple regression equation as follows: Ý = a + b2x2 = 16,44 + 0, 618 X2
Is:
X2 = The Implementation of innovation management functions non-formal education
Y = Improving the Welfare of the Poor
Constants of 15.64 states that there is no increase in the value of the variable The Implementation of innovation management functions of non-formal education (X2), then the value of Improving the Welfare of the Poor (Y) is 15.64. The regression coefficient of 0, 618 states that any additions (for the sign +) of the scores or grades Quality of care would give rise to a score of 0, 870 T test to test the significance of constant and variable Y (Improving the Welfare of the Poor). Koedisien test criteria of the Performance of the following variables:
Ha: The Implementation of innovation management functions of non-formal education significantly affect Improving the Welfare of the Poor
The hypothesis in statistical form: Ha : rx2y ≠ 0
Ho : rx2y = 0
Basis for decision making: by comparing the value of t arithmetic with t table as follows: If the t count > t table, then Ho is rejected it means a significant regression coefficient
If the value of t < t table, then Ho accepted means of regression coefficients were not significant Value = 11,52 (taken at coefficient value for the variable (X2)
* The level of significance (α) = 0.05
* Df (degrees of freedom) amount n - 2 = 78-2 = 76 * Test done one side, so that the value t table = 1.671 Decision:
Because the value of t count> t table, or 11,52 > 1.671, then Ho is rejected seen in the column sig (significant) coefficient sig 0.000 or less than the probability value 0.05 or 0.05 value > 0,000, then Ho is rejected and Ha accepted meaning that the regression coefficient is significant. Thus The Implementation of innovation management functions of non-formal education significantly affect Improving the Welfare of the Poor.
Thus the regression equation is:
Ý = a + b1x1 + b2x2 = 15,64 + 0, 989 X1 + 0, 618X2
is :
X1 = The Model of Non-formal education management
X2 = The Implementation of innovation management functions non-formal education
Y = Improving the Welfare of the Poor
Constants of 16.44 states that if there is no increase in the value of the variable The Model of Non-formal education management (X1) and The Implementation of innovation management functions of non-formal education (X2), then the value of Improving the Welfare of the Poor (Y ) is 15.64. The regression coefficient of 0, 989 and 0, 618 states. That any additions (for the sign +) of the scores or grades The Model of Non-formal education management and The Implementation of innovation management functions of non-formal education will give rise to a score of 0, 989 and 0, 618
3.3. The Model of Non-formal education management (X1) and The Implementation of innovation
management functions of non-formal education (X2) together - equally significant influence on Improving the Welfareof the Poor(Y)
F test in the ANOVA table to test the significance of the constants and the dependent variable (Improving the Welfare of the Poor). Test criteria regression coefficient of The Model of Non-formal education management and The Implementation of innovation management functions to non-formal education improving the Welfare of the Poor is as follows:
Hypothesis to three proposed is
Ha : The Model of Non-formal education management(X1 ) and The Implementation of innovation management
functions non-formal education ( X2) together - equally significant influence onImproving the Welfare of
the Poor (Y)
Ho : The Model of Non-formal education management(X1 ) and The Implementation of innovation management
functions non-formal education ( X2) together - equally not significant influence on Improving the
Welfare of the Poor (Y) The hypothesis in statistical form: Ha : r x1x2y ≠ 0
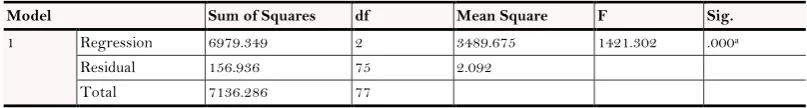
Table-4. ANOVAb
Model Sum of Squares df Mean Square F Sig.
1 Regression 6979.349 2 3489.675 1421.302 .000a
Residual 156.936 75 2.092
Total 7136.286 77
a. Predictors: (Constant), Innovation, Model b. Dependent Variable: Welfare
Taken from the table anovab F count = 14.21 Basic decision-making: by comparing the value of F arithmetic
with F table value, as follows:
If F count > F table, then Ho is rejected it means a significant regression coefficient If the value of F count < F table, then Ho accepted means of regression coefficients were not significant. Finding
the value of F calculated using the F table with the formula:
Significance level (α) = 0.05 significance level ( α ) = 0,05 F tabel = F (1 – α)(dk=k), (dk = n-k-1)
= F (1 – α)(dk = 3), ( dk = 78 – 2 – 1) = F (1- 0,05) (3, 75)
How to find F table = 3, as the numerator and the denominator 75 F table = 4.08 (interpolation)
Decision :
It turned out that F count> F table, or 14,21> 4.08 then Ho is rejected and Ha accepted that The Model of Non-formal education management (X1) and The Implementation of innovation management functions of non-formal education (X2) together - equally significant influence on Improving the Welfare of the Poor (Y). It appears that at column Sig (a significant) in the table Anovab the Sig. 0,000 or smaller than the probability value 0.05 or
0.05 value > 0.000, then Ho is rejected and Ha accepted, meaning that multiple regression coefficient is significant. So The Model of Non-formal education management (X1) and The Implementation of innovation management functions of non-formal education (X2) together - equally significant influence on Improving the Welfare of the Poor (Y)
4. CONCLUSION
Discussion of research findings indicate various findings related to: there is a significant influence of variables
The Model of Non-formal education management (X1) and The Implementation of innovation management
functions of non-formal education (X2), together toward Improving the Welfare of the Poor (Y)
Funding: This research was funded by Tasikmalawa College of Economics, West Java, Indonesia
Competing Interests: The authors declare that competing interests were in the social and educational fields, and contributors were the Garut Regency Government of West Java Indonesia
Contributors/Acknowledgement: We are gratefully acknowledged to Local Government of Garut West Java. Special thanks to the Regent of the respective Public Administration Institution, The Management of Smart House Garut District; Local Government of Garut and all subjects who participated in the study are gratefully acknowledged.
REFERENCES
Ball, C., 1993. Lifelong learningand the school curriculum. Paris: OECD/CERI.
Sugiy0no, 2016. Metodologi kuantitatif, quantitative methodology. PT. Alphabet, Bnadung, Indonesia W Kreitlon (Ed). Examining Controversies in Continuing Education. San Francisco: Jossey-Bass.