A Multiobjective Genetic Algorithm for
Feature Selection in Data Mining
Venkatadri.M , Srinivasa Rao.K
Dept of CSE &IT, Jawaharlal Nehru Institute of Technology, Hyderabad -5001510
Abstract -The rapid advance of computer based high-throughput technique have provided unparalleled opportunities for humans to expand capabilities in production, services, communications, and research. Meanwhile, immense quantities of high-dimensional data are accumulated challenging state-of-the-art data mining techniques .The intelligent analysis of Databases may be affected by the presence of unimportant features, which motivates the application of Feature Selection. By treating this task as a search and optimization process, it is possible to use the synergy between Genetic Algorithms and Multi-objective Optimization to carry out the search for (quasi) optimal subsets of features considering possible conflicting importance criteria. This work presents an application of Multi-objective Genetic Algorithms to the Feature Selection problem, combining different criteria measuring the importance of the subsets of features.
Keywords -Feature importance measures, Filter feature selection, Multi-objective Genetic Algorithm.
I INTRODUCTION
Data mining is a multidisciplinary effort to extract nuggets of knowledge from data. The proliferation of large data sets within many domains poses unprecedented challenges to Data Mining (DM) [1]. Not only are data sets getting larger, but new types of data have also evolved, such as data stream on the Web, microarrays in genomics and proteomics, and networks in social computing and system biology. Technological advances have allowed the acquisition and storage of a growing volume of information. The intelligent analysis of these data by processes like data mining is extremely useful, as they make possible to construct computational models (hypothesis) that give support to specialists during decision making [1].
Feature Selection (FS) is one of the tasks usually performed during DM with the goal of identifying important features subsets in a Database (DB) [2]. Among other motivations, FS allows the obtainment of less complex models and that potentially have also equal or higher quality when compared to the models constructed using all features. In addition, it allows a better understanding of the data domain, by means of the identification of the features that, apparently, better describe the embedded patterns. In
high-dimensional domains, another benefit is the reduction of the effects of the curse of dimensionality [1], [3]. Search for important features subsets is, in general, combinatorial, as the search space contains all the possible combinations of the investigated features. This fact motivates the use of heuristic search methods such as Genetic Algorithms (GA) [4].
Based on the Darwinian Theory of Evolution and on genetics, GA conducts genetic operations between a set of possible solutions to the search and optimization problem. Following these principles, solutions that optimize a given fitness function, which reflects the goal to be optimized, tend to proliferate, while solutions of low quality tend to vanish.
A formulation of FS as a search and optimization process can be obtained by defining important features subsets as optimal solutions from an optimization problem that maximizes or minimizes a function referent to a criterion of importance of the features as their correlation to the data classes. The simultaneous optimization of multiple criteria allows to define important features subsets considering distinct aspects, although this may become complex when these goals are conflicting. Herewith, Multi-objective Optimization (MO) strategies become necessary [5]. MO is constituted by mathematical and/or algorithmic mechanisms that define one or more equivalently optimal solutions that attend to distinct tradeoffs among the considered goals. The combined use of GA and MO define the Multi- Objective Genetic Algorithms (MOGA), which are capable of performing the search of a group of solutions guided by the simultaneous optimization of multiple criteria or goals. MOGA have been applied to different domains and tasks, among which is FS [6], [7], [8], [9]. Differently from previous related work, in this work we apply MOGA in FS considering distinct combinations of criteria measuring the importance of subsets of features. All criteria employed use information extracted from data only.
involving the proposed framework; conclusions of this work are presented in Section VI.
II . FEATURE SELECTION
The importance of features in a DB may be defined in terms of different criteria, which usually take in account the relevance and/or non redundancy of the investigated features [10], [11], [3]. In the context of supervised learning, i. e., sets of examples that have a class attribute, a feature may be defined as relevant if it is important for the discrimination of the classes. Considering classification problems, in which the interest is to extract a model that describes the relation between the features and their classes, a feature is relevant when a worse predictive performance is obtained when this feature is not used. On the other hand, two features are considered non redundant if their values are not significantly correlated [2].
Generally, the choice of the features is carried out through the evaluation of their individual importance or considering subsets of features. Techniques for individual evaluation usually are not able to remove redundant features, as they tend to present the same importance for discriminating the classes [10]. Thereby, in this work FS is performed considering two aspects: (1) application of importance measures considering feature
subsets and (2) application of individual evaluation measures which are then combined into a unique resultant value, representing at the end a subset of features as a whole.
The existent FS methods may be mainly characterized according to their interaction with the pattern extraction algorithm [2]. Wrapper FS algorithms evaluate the importance of features subsets based on the models generated by pattern extraction algorithms, while filter FS algorithms consider general properties extracted from the data set, such as statistical measures. The algorithm developed in this work belongs to the filter approach and includes measures of consistency, dependency, distance and information, which are described next.
III. IMPORTANCE MEASURES
Distinct measures for quantifying the importance of features are found in the literature. Usually, it is possible to characterize them as measures of consistency, dependency, distance, information or precision [3]. In supervised data, the concept of consistency corresponds to the non occurrence of one or more pairs of examples of different classes with identical values for the same feature [12]. Therefore, measures of consistency search for features which enable the construction of logical consistent hypothesis. The Inconsistent Example
Pairs (IP) measure proposes the identification of the inconsistency ratio given by the Equation 1 [12].
IP
(1)
Criteria based on dependency measure the capability of predicting the value of one feature from the value of another feature. Thereby, these measures enable the analysis of the redundancy present in data. Equation 3 [9] presents the dependency measure Attribute Class Correlation (AC) [13], in which xj (i) is the value of feature i in the example j, n corresponds to the number of examples, m is the number of features, where i = {1….,m} and j = {1,…. n}. The weight i assumes value 1 or 0, respectively, if i is or is not selected and φ(..,..)=1 if j1 and j2 belong to different classes or φ (...,) = 0.05 otherwise, while ║║denotes the module function.
AC= ﴾∑ iC(i) ﴿/﴾∑ i ﴿ ( 2)
Where C(i) = ∑ ║ ║ ﴾ , ﴿ /
Distance measures allow investigating aspects like proximity between examples that have some relation and separation between examples without relation. The Intra-Class Distance (IA) and the Inter-Class Distance (IE) [9] exemplifies this category estimating, respectively, the density of examples from a specific class and the separability between the classes when the data set is described only by the subset of features being investigated. These measures are formulated according to Equations 3 and 4 [9], in which denotes the j-th example from class r, p corresponds to the central example of the data set, d(.,.) denotes the Euclidean distance, and pr e nr represent, respectively, the central example and the number of examples in class r.
IA = ∑ ∑ , (3)
IE = ∑ ,p) (4)
defined as D = diag (S1), in which diag() extracts the diagonal of a matrix, and L = D-S, considering S as the weight matrix of the edges that connect nearest neighbors.
LS (i) = (5)
Where
Information measures, such as Representation Entropy (RE) [15], enable to investigate the distribution of information between the features and, consequently, to estimate the involved redundancy [16]. RE may be defined from the covariance matrix of order m as formulated in Equation 7 [16], where the Eigen value associated with feature i is denoted by . Although the analysis performed by this measure has relation with the dependency analysis, it is worth emphasizing that in RE the information is the main concept estimated for each feature. The aim is reduce the uncertainty of the problem under investigation. This justifies the classification of RE as a measure of information.
RE= - ∑ (6)
Where = ∑
Measures of the precision category may consider information such as the accuracy rate of a model in the classification of the examples described by the subset of features investigated and other performance estimates, being commonly used by FS techniques of the wrapper category.
IV. MOGA IN FEATURE SELECTION
Genetic Algorithms (GA) can be employed quite directly to FS [17], [18], [9]. Each individual in this case is represented by a binary chromosome containing m genes, where each gene represents one of the m features. A value 1 at a specific position i implies the selection of feature i, while the value 0 indicates that it was not selected. From an initial population containing several random individuals representing different subsets of features, the GA searches for a subset that optimizes some importance measure of these features according to some of the criteria discussed in the previous section.
However, it may be interesting to combine different criteria of importance in the evaluation of subsets of features, as a way to exploit complementarities in their definitions and also to employ different properties in the selection of
features. Herewith, we have different objectives to be optimized, which are often conflicting. In this scenario, the use of MOGA is fully justified.
In this work we used the Non-dominated Sorting Genetic Algorithm (NSGA-II) MOGA in the FS problem, which is based on the theory of Pareto for multi-objective optimization and was also used in related work [17], [18], [9]. This theory allows the optimization of multiple goals in order to obtain a frontier of diverse possible solutions [5]. We considered the simultaneous optimization of different combinations of importance criteria of the subsets of features we chose at least one measure to represent each category of importance measures, which were discussed in the previous section, except from the accuracy category, more related to wrapper approaches.
Each measure was calculated on data sets represented only by the features selected by the MOGA in a particular individual. Therefore, we obtain the evaluation of the subset of features s represented in this individual. While most of the measures meets the aspect (1) reported in Section II, LS is the only measure that addresses the aspect (2). We chose to apply LS to each feature that makes up s and use the average value obtained as the final value for this measure in the given subset.
Although the simultaneous optimization of all six measures is possible, MOGA based on the Pareto theory generally scale poorly in optimization problems with four or more objectives, among other problems [19]. The complementarities between the six measures can be analyzed by the optimization of pairs of objectives. The computational cost for optimizing pairs of importance measures is lower than the cost associated with the optimization of more goals. These facts motivated to optimize only two measurements per experiment in this work. Considering all possible pairs of six measures, we obtain 15 different multi objective configurations.
The investigation of many configurations, considering combinations between different types of importance measures, distinguishes this work from others as [17], [18], [9]. Unlike all the recent work discussed in [20], which implement measures belonging to the wrapper approach, the measures used in this work all belong to the filter approach. Overall, the filter approach tends to have a lower computational cost than the wrapper approach [2].
solutions representing different tradeoffs between the objectives considered. To select a single solution in this work, we used the Compromise Programming (CP) technique, as described in [21].
V. EXPERIMENTAL EVALUATION
We conducted a series of experiments to evaluate the use of the MOGA described in Section IV on data sets from the UCI benchmark1 [22], chosen from related work. The experiments were performed with the aid of the Platform and Programming Language Independent Interface for Search Algorithms (PISA) [23], which implements NSGA-II, and of the GNU Scientific Library (GSL) [24] for calculating the covariance matrix required by RE. The J48 algorithm, an implementation of C4.5 decision tree [25] available in Weka 3.6.1 [26], was used to generate models for data classification. We opted for this classifier because of its relatively low computational cost and its small number of parameters.
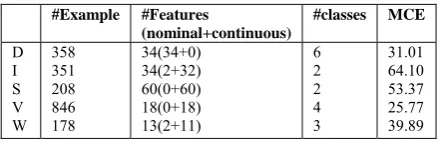
TABLE I DATA SETS INFORMATION
#Example #Features (nominal+continuous)
#classes MCE
D I S V W
358 351 208 846 178
34(34+0) 34(2+32) 60(0+60) 18(0+18) 13(2+11)
6 2 2 4 3
31.01 64.10 53.37 25.77 39.89
The data sets used were: Dermatology (D), Ionosphere (I), Sonar (S), Vehicle (V) and Wine (W). Table I presents their number of examples, features and classes and also their Majority class Error (MCE) rates.
In order to evaluate the subsets of features selected by the MOGA in each case, we generated classification models on projections of the data sets containing the features chosen and compared the results of these models against those obtained using all the features present in each data set. A projection consists in building a new data set with the same set of examples, but containing only the features referenced in the investigated subset.
In all experiments, NSGA-II was applied with the following parameters: alpha = 50, mu = 50, lambda = 50, crossover rate = 0.8, mutation rate = 0.01, stopping criterion = 50 generations, where alpha, mu and lambda correspond, respectively, to the population size and the number of parents and the number of children
after crossover. As already mentioned, we have investigated combinations of different criteria measuring the importance of features: IA, IE, AC, IP, LS and RE pairs, totaling 15 multi objective settings.
In the experiments, each data set was initially divided according to the stratified 10-fold
cross-validation method, resulting in 10 pairs of training and test sets. The MOGA is run three times on each training data set partition, since its results are stochastic. Given a specific partition i of a data set d, we then obtain three subsets of features. For each of the subsets, a projection of the pair training/test i is built. A classification model for each projection is generated using the training set obtained, which is tested in the corresponding test partition. We then have, for each combination of criteria of importance in a data set d, 30 accuracy rates from three runs of 10 fold cross-validation. The outcome of the MOGA using a specific combination is then given by the average of these 30 runs. Classification models using the data sets with all the features were generated as baselines, using the same cross-validation partitions. In this case, the average reported refers then to the 10 runs of cross-validation.
A.Results
Table II depicts the average accuracy rate obtained by the classification models induced, their standard deviation and also the average percentage of reduction in the original amount of features in the data sets (third column from TableI) and standard deviation associated (in parentheses) for each combination of importance criteria. Each line represents a distinct classifier, while the columns correspond to the datasets. It is worth noting that the FS performed internally by J48 was not investigated in this work, so the number of features presented refers to the size of the subsets identified by the MOGA.
We also made experiments involving the use of the IA measure. Nevertheless, there were very sharp reductions in the numbers of features and the classifiers built thereafter
showed a deteriorated predictive performance. Therefore, the results related to this particular measure are not presented in Table II.
We applied the statistical test of Friedman [27], separately by data set, to identify if there was, with 95% of confidence, a significant difference in accuracy among the classifiers resulting from the use of MOGA and the baseline Ca. The cells marked in bold indicate cases that showed significantly better predictive performance compared to the baseline classifier, while cells in italics and underlined indicate cases where the baseline accuracy was significantly better.
B. Discussion
combinations IE + AC and IE + LS also present, in most cases, similar accuracy to the baseline, but using less features. An exception occurred in the Sonar data set, where we have a better predictive performance when compared to the baseline, which was statistically significant with p - value < 0.001. Other combinations, such as AC + IP, AC + RE and IP + RE, also stand out in some of the data sets.
This shows the importance of considering the distance between examples of different classes for FS. Features that allow higher separability of data can contribute for a better predictive performance of the induced classifiers. Combining the analysis of other types of measures, such as dependence inherent in the data set investigated, it becomes possible to select important features in terms of other aspects, reducing the complexity of the models, while obtaining equal or higher accuracy in data classification. For instance, while two or more features may be equivalent regarding one measure of importance, the consideration of another measure
may provide further information for selecting among them.
Regarding the number of selected features, there were generally greater reductions in the combinations involving the AC and LS measures. In some cases these reductions have been very aggressive and led to a deterioration of the predictive performance of the subsequent models generated. On the other hand, combinations with IE (especially IE + IP and IE + RE) were more conservative, reducing less the numbers of features. It is interesting therefore to note the synergy of the combination of IE with AC and LS, where it was possible to obtain good reductions in the numbers of features, while the accuracy rates obtained were maintained and even improved in some situations.
It is worth noting that in many cases it was possible to obtain models with equivalent predictive performance to the baseline classifier, while using a lower number of features, representing the obtainment of models of lower complexity. Table II highlights with the symbol “*” cases where there was a significant reduction in the number of features, above 50%, while the models had accuracy rates similar or even better than those obtained when using all features.
All measures employed in this work belong to the filter approach, which tends ensure a lower computational cost when compared to wrapper approaches [2]. As observed in Table II,
despite not using any precision importance measure, it was possible to obtain classifiers with predictive performance similar or superior to the baseline, which uses all features.
We conclude that the MOGA is a useful method for FS when combining multiple criteria of importance of the subsets of features, due to the benefits of GA and MO. While the GA has enabled the simultaneous optimization of a set of solutions, MO allowed the combined investigation of measures that reflect different aspects of the data sets to select important features.
VI. CONCLUSION
This work presented an implementation of a MOGA for FS in classification problems. Different multiobjective configurations were tested, in which the goals correspond to different measures of importance of the features. Experimentally, in several cases it was possible to build models with reduced numbers of features and good predictive performance, especially in combinations IE + AC, IE + LS and IP + LS.
The combinations involving the Inter-Class Distance measure resulted in relatively higher accuracy rates in all data sets. Thus, it becomes interesting to investigate further this criterion in later experiments that combine up to three objectives simultaneously and with more data sets. The cardinality of subsets of features handled by the MOGA can also be included as an additional objective to be minimized. It is also proposed as future work the use of other classifiers to minimize any influences of a specific classifier in the evaluation of the MOGA. An additional study also includes the comparison of the proposed MOGA with other techniques for FS described in the literature and also with single objective GA involving each of the importance measures separately. We can also consider in future the fact that the measures LS and RE do not use the class attribute to perform FS and can be directly employed to unlabeled data.
ACKNOWLEDGEMENT
TABLE II CLASSIFICATION RESULTS
D I S V W
IE + AC 91.03 ± 4.71 (23.14±1.17)
90.32 ± 5.48 (32.16±1.2 )
81.91 ± 8.65
(57.33± 2.36)* 72.43 ± 4.21 (6.85±0.43) (37.69± 0.96) 93.24 ± 4.98
IE + IP 93.28 ± 5.02 (0±0) 90.89 ± 5.15 (1.37±0.51) 69.56 ± 8.89 (4.78± 1.5) 74 ± 5.11 (0± 0) 92.12 ± 6.32 (0± 0)
IE + RE 94.11 ± 4.97 (1.76±0.62) 90.6 ± 5.35(7.06±0.62) 73.08 ± 10.47(10.22± 1.11) (0.19± 0.18) 73.96 ± 5.1 92.12 ± 6.32(0± 0)
IE + LS 90.67 ± 5.75 (33.53±0.93) (67.84±1.6 )* 90.68 ± 6.28 (63.72± 1.96)* 80.93 ± 11.5 (14.07± 0.68) 72.74 ± 3.62 (64.62± 1.22)* 89.35 ± 13.94
AC + IP (85.39±0.56) 62.75 ± 7.5 (87.94± 0.55)* 90.3 ± 6.4 (90.44± 0.94)* 72.67 ± 7.79 (62.59± 0.45) 69.99 ± 4.09 (78.46± 0.41)* 89.93 ± 5.55
AC + RE 93.46 ± 4.81 (40.59±1.35) (29.71± 1.24 90.6 ± 5.14 (22.39± 2.76) 73.41 ± 8.48 63.84 ± 4.78 (88.89± 0) (69.74± 0.25)* 90.02 ± 7.03
AC + LS 65.38 ± 2.35 (94.12±0) (96.47± 0.41) 81.46 ± 7.41 (96.22± 0.83)* 72.02 ± 8.44 52.49 ± 5.62 (94.44± 0) (88.46± 0.51) 83.1 ± 7.37
IP + RE (52.35±0.48)* 96.08 ± 4.47 (21.08± 0.79) 91.27 ± 5.18 (27.61± 1.19) 73.88 ± 8.5 67.62 ± 4.01 (76.3± 0.64) 77.48 ± 9.9 (69.23± 0)
IP + LS 80.73 ± 2.74 (71.67±1.03) (89.61± 0.51)* 90.02 ± 4.38 (92.72± 0.85)* 72.67 ± 9.06 (63.33± 0.93) 68.44 ± 3.36 (83.85± 0.31)* 89.31 ± 3.98
RE + LS (43.73±1.41) 88.99± 6.14 (35.98± 1.17) 90.98 ± 5.08 74.04 ± 10.01 (30.94± 2.11) 52.49 ± 5.62 (94.44± 0) 87.61 ± 9.52 (69.23± 0)*
Ca 93.28 ± 5.2 90.89 ± 5.34 70.21 ± 9.81 74 ± 5.3 92.12 ± 6.55
REFERENCES
[1]. J. Han and M. Kamber,” Data mining: concepts and techniques”. Morgan Kaufmann, 2006.
[2]. H. Liu and H. Motoda, “Computational Methods of Feature Selection”. Chapman & Hall/CRC, 2008.
[3]. ——, Feature Selection for Knowledge Discovery and Data Mining. Kluwer Acad. Publish., 1998.
[4]. M. Mitchell, “An introduction to genetic algorithms”, MIT Press, 1998.
[5]. L. T. Bui and S. Alam, “Multi-Objective Optimization in Computational Intelligence: Theory and Practice”. Inf. Science Ref., 2008.
[6]. Z. Zhu, Y.-S. Ong, and J.-L. Kuo, “Feature selection using single / multi-objective memetic frameworks”, in Multi-Objective Memetic Algorithms. Springer-Verlag, pp. 111–131, 2009.
[7]. N. Dess`ı and B. Pes, “An evolutionary method for combining different feature selection criteria in microarray data classification,”, J. Artif. Evol. and Applic., pp. 1–10, 2009.
[8]. J. Handl, D. B. Kell, and J. Knowles, “Multiobjective optimization in bioinformatics and computational biology”, IEEE/ACM Trans. Comp. Biol. and Bioinf., pp. 279–292, 2007.
[9]. D. Zaharie, S. Holban, D. Lungeanu, and D. Navolan, “A computational intelligence approach for ranking risk factors in preterm birth”, in Int. Symp. on Applied Comp. Intel. And Inf., , pp. 135–140, 2007M. A. Hall, “Correlation-based feature selection for discrete and numeric class machine learning”, in Int. Conf. on Machine Learning, pp. 359–366,2000.
[10]. H. D. Lee, M. C. Monard, and F. C. Wu, “A fractal dimension based filter algorithm to select features for supervised learning”, in Adv. in Artif. Intel., pp. 278– 288,2006,
[11]. A. Arauzo-Azofra, J. M. Benitez, and J. L. Castro, “Consistency measures for feature selection”, Intel. Inf. Sys., vol. 30, no. 3, pp. 273–292, 2008.
[12]. L. Wang and X. Fu, Data Mining With Computational Intelligence. Springer, 205.
[13]. X. He, D. Cai, and P. Niyogi, “Laplacian score for feature selection”, in Adv. in Neural Inf. Proc. Syst., , pp. 507– 514,2005
[14]. P. Mitra, C. A. Murthy, and S. K. Pal, “Unsupervised feature selection using feature similarity,” IEEE Trans. on Patt. Anal. and Machine Intel., vol. 24, no. 3, 2002.
[15]. W. Yan, “Fusion in multi-criterion feature ranking,” in Int. Conf. on Inf. Fusion, pp. 01–06,2007.
[16]. L. Bruzzone and C. Persello, “A novel approach to the selection of spatially invariant features for the classification of hyperspectral images with improved generalization capability”, GeoRS, vol. 47, no. 9, pp. 3180–3191, 2009.
[17]. C.-M. Wang and Y.-F. Huang, “Evolutionary-based feature selection approaches with new criteria for data mining: A case study of credit approval data”, Expert Syst. Appl., vol. 36, no. 3, pp. 5900–5908, 2009.
[18]. A. L. Jaimes, C. A. Coello, and J. E. U. Barrientos, “Online objective reduction to deal with many-
objective problems”, in Int. Conf. on Evol. Multi-Crit. Opt., , pp. 423–437,2009.
[19]. N. Spolaˆor, A. C. Lorena, and H. D. Lee, “Um estudo sobre a aplicac¸ ˜aode algoritmos gen´eticos multiobjetivo para a selec¸ ˜ao de atributos (in portuguese)”, in Congresso da Academia Trinacional de Ciencias,pp. 1–10,2009.
[20]. M. Zeleny, “An introduction to multiobjetive optimization”, in Multiple criteria decision making. University of South Carolina Press, pp. 262–301, 1973 [21]. A. Asuncion and D. Newman, “UCI machine
learning repository”, [Online]. Available:
http://www.ics.uci.edu/_mlearn/MLRepository.html,2007. [22]. S. Bleuler, M. Laumanns, L. Thiele, and E. Zitzler,
“PISA — a platform and programming language independent interface for search algorithms,” in Evolutionary Multi-Criterion Optimization (EMO 2003), ser. Lecture Notes in Computer Science, C. M. Fonseca, P. J. Fleming, E. Zitzler, K. Deb, and L. Thiele, Eds. Berlin: Springer, pp. 494 – 508 , 2003.
[23].M. Galassi, J. Davies, J. Theiler, B. Gough, G. Jungman, P. Alken, M. Booth, and F. Rossi, GNU Scientific Library Reference Manual. Network Theory, 2009.
[24].J. QuinLan, C4.5: Programs for Machine Learning. Morgan Kaufmann, 1993.
[25]. I. H. Witten and E. Frank, Data Mining: Practical Machine Learning Tools and Techniques. Morgan Kaufmann, 2005.