A Comparison of the Physicochemical
Characterisation of Powders using a
selection of current methods
Submitted June 1998
The School of Pharmacy
University of London
ProQuest Number: U117983
All rights reserved
INFORMATION TO ALL USERS
The quality of this reproduction is dependent upon the quality of the copy submitted. In the unlikely event that the author did not send a complete manuscript and there are missing pages, these will be noted. Also, if material had to be removed,
a note will indicate the deletion.
uest.
ProQuest U117983
Published by ProQuest LLC(2016). Copyright of the Dissertation is held by the Author.
All rights reserved.
This work is protected against unauthorized copying under Title 17, United States Code. Microform Edition © ProQuest LLC.
ProQuest LLC
789 East Eisenhower Parkway P.O. Box 1346
Acknowledgements 2
I would like to thank my supervisor, Dr, Graham Buckton, for his assistance and
encouragement throughout my period as a postgraduate.
Roche Products for their financial support, especially Dr. Chris Doherty for his
guidance and advice in the continual development o f my Ph.D.
The technical staff, especially Brian who were always able to find the correct and fully
functioning apparatus when required.
My friends and colleagues, who have all made my time spent at the School o f
Pharmacy an enjoyable one, in particular Jon and Sam, without whose help I would
not he able to accredit my abysmal golf handicap.
Alka for much needed thesis writing advice, as well as being a great friend and
companion.
A bstract 3
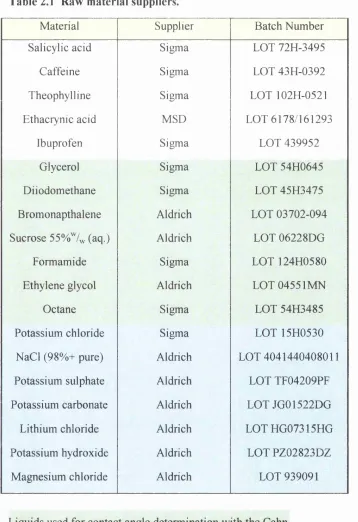
The surface characterisation of six powders (Caffeine, Ethaeiynic acid, Ibuprofen,
Salicylic acid. Saquinavir and Theophylline) was compared using a selection of
traditional and novel methods; one liquid penetration and two Wilhelmy plate methods
utilising contact angles, inverse gas chromatography (IGC), isothermal
microcalorimeti-y (IM) and dynamic vapour soiption (DVS).
All the techniques distinguished between the chemically different powders, although
only IGC, IM and DVS were sensitive enough to detect batch to batch variation o f the
Saquinavir after it had been wetted and dried under different conditions.
Of the three methods using contact angle analysis, the powder coated Wilhelmy plate
method was the most versatile and accurate, as reproducible contact angles were
consistently obtained with all powder and probe liquid combinations. Surface energy
data were calculated using two theories, one producing a more complete analysis, with
non-polar, polar, and acid-base values.
IGC, DVS and IM discovered small variations with Saquinavir between batches, IM
being the most sensitive. IGC produced non-polar surface energies that were directly
comparable to the contact angle analysis, whilst it only gave a qualitative indication of
acid-base nature. DVS and IM measured water vapour adsoiption, useful in their own
right, which were combined to achieve a detailed thermodynamic analysis o f the
adsoiption process with changing relative humidity.
In conclusion, the ideal surface characterisation method depends on many factors, for
example, sensitivity required, powder quantity available and whether the surface energy
is being evaluated or compared for batch to batch variation. It is evident that batch to
batch variation is not readily detectable with contact angle techniques, which should
therefore be reserved for a quick indication of the magnitude of a powder’s surface
energy. Whereas DVS, IM and IGC provide straightforward and highly sensitive
methods of analysing surface properties and the degree o f variation between batches of
Table o f Contents 4
Acknowledgements...2
Abstract...3
Table of Contents... 4
List of T ab les...12
List of Figures...15
List of Sym bols... 21
1 INTRODUCTION
241.1 Surface Energy...
261.2 Wetting process...
291.2.1 Adhesion... 30
1.2.2 Immersion...31
1.2.3 Spreading... 31
1.3 Critical Surface Tension (yc)...
321.4 Deriving contact angles experimentally...
331.4.1 Liquid with unknown surface energy... 33
1.4.2 Solid with unknown surface energy... 33
1.4.2.1 Liquid penetration...33
1.4.2.2 Powder com pacts...34
1.5 Surface energy determination using contact angle d a ta ...
341.5.1 Van Oss theory... 34
Table o f Contents 5
1.5.1.2 Lewis Acid-Base interactions ( y s ^ ) ... 35
1.5.1.3 Possible interactions...36
1.5.1.4 Van Oss equation derivation...37
1.5.1.5 Polarity ratio s...37
1.5.1.6 Two possible methods using the Van Oss theory...39
1.5.2 Wu’s theory...40
1.6 Potential use of surface energy data...41
1.7
Alternative methods of surface analysis
... 421.7.1 Adsorption... 42
1.7.2 Inverse gas chromatography... 43
1.7.2.1 History o f IGC development... 43
1.7.2.2 Theory... 44
1.7.3 Isothermal microcalorimetry... 45
1.7.3.1 Introduction... 45
1.7.3.2 Enthalpy o f adsorption... 46
1.7.4 Dynamic vapour sorption... 47
1.7.4.1 Theory... 47
1.7.4.2 Gibb’s function...48
1.7.5 Combining dynamic vapour sorption and microcalorimetry data...49
1.7.5.1 Entropy o f adsorption...49
2 M ATERIALS...
522.1 Model powders...
522.2 Test powder...
552.2.1 Preparation of batches of Saquinavir... 55
Table o f Contents 6
3 WILHELMY PLATE
59
3.1 Introduction... 59
3.1.1 Compressed powder plate...59
3.1.2 Powder covered glass slide...60
3.2
M ethod
... 603.2.1 Powder compact manufacture... 60
3.2.2 Powder covered glass slide...61
3.2.2.1 The influence of coverage of the shde by the powder on the measured contact angle... 62
3.2.3 Cahn Dynamic Contact Angle Analyser (312)... 63
3.2.3.1 Calibration of Cahn... 64
3.2.4 Choice of test liquids... 64
3.2.5 Analysis... 65
3.2.6 Errors associated with quoting contact angles...67
3.3
Results and discussion
... 693.3.1 Wilhelmy plate analysis of test powders using a powder com pact...69
3.3.1.1 Van Oss theory...69
3.3.1.2 Wu theory... 70
3.3.2 Wilhelmy plate analysis of test powders using a powder covered glass slide...75
3.3.3 Wilhelmy plate analysis of Saquinavir batches using a powder compact
81
3.3.4 Wilhelmy plate analysis of Saquinavir batches using a powder covered glass slid e...873.3.4.1 Summary of results...93
3.3.5 Negative polarity values...94
3.3.6 Test liquid choice... 95
Table o f Contents 7
3.3.8 Compression effect...102
3.4 Conclusions...
1034 LIQUID PENETRATION
1054.1 Introduction...
1054.2 M ethod...
1064.3 Contact angle calculation...
1084.4 Results and discussion...
1084.4.1 Comparison between liquid penetration and glass slide Wilhelmy plate methods... 111
4.4 Conclusions... 112
5 INVERSE GAS CHROMATOGRAPHY
1155.1 Introduction...
1155.1.1 Possible probe interactions...116
5.1.2 Calculation... 117
5.1.3 Acid and base behaviour... 122
5.2 M ethod...
1255.2.1 Silanisation method... 125
5.2.2 Packing of glass loop...125
Table o f Contents 8
5.3
Results and discussion
... 1275.3.1 Caffeine, Theophylline, Salicylic acid, Ethacrynic acid and Ibuprofen 127 5.3.1.1 Effect o f temperature...127
5.3.1.2 Analysis using a(yL°)^^...128
5.3.1.3 Using delta Heat o f vaporisation (AHd''^*’) ... 132
5.3.1.4 Using boiling points... 135
5.3.1.5 Summary o f three methods o f analyses... 138
5.3.2 Saquinavir... 139
5.3.2.1 Surface energy analysis using a(yL°)°^... 144
5.3.2.1.1 Non-polar surface energy component using a(yL°)^ ^ ...144
5.3.2.1.2 Acid-base characterisation using a(yL^)^^... 146
5.3.2.2 Acid-base characterisation using enthalpy o f vaporisation... 148
5.3.2.3 Acid-base characterisation using boiling p o in ts... 152
5.3.2.4 Overall conclusions with the batches o f Saquinavir from the IGC results ...154
5.4
Conclusions
... 1555.4.1 High non-polar surface energy values... 155
5.4.2 Acid-base analysis... 156
5.4.3 Accuracy...157
5.4.3.1 Y-axis e rro rs ... 157
5.4.3.2 X-axis e rro rs ... 157
5.4.4 Advantages of IG C ... 158
5.4.5 Disadvantages of IGC... 158
6 ISOTHERMAL MICROCALORIMETRY
1616.1 Introduction...
161Table o f Contents 9
6.2.1 Calibration... 163
6.2.2 Surface area analysis... 165
6.2.2.1 M ethod... 165
6.3 Results and discussion
...1666.3.1 Cumulative adsorption isotherms of the five model powders... 166
6.3.2 Cumulative adsorption isotherms of the Saquinavir batches... 167
6.3.3 Non-cumulative adsorption isotherms of Saquinavir... 169
6.3.4 Summary of isotherm data...172
6.3.5 Alterations in adsorption isotherms of Saquinavir with repeating cycle.... ...174
6.3.5.1 Reproducibility... 177
6.4
Conclusions
... 1787 D Y N A M I C V A P O U R S O R P T I O N 181
7.1 Introduction
... 1817.2 M ethod
... 1837.2.1 Validation of relative humidity... 183
7.2.2 Calibration...183
7.2.3 Cleaning... 184
7.2.4 Static... 184
7.2.5 Loading sample...184
7.3 Results and discussion...
1857.3.1 Humidity validation... 185
7.3.2 Adsorption isotherms of five model powders... 186
7.3.3 Adsorption isotherms of Saquinavir batches... 189
Table o f Contents 10
7.4 Conclusions...
198
7.5 Combining DVS and Microcalorimetry data... 200
7.5.1 Thermodynamic consideration of three model powders... 200
7.5.2 Thermodynamic consideration of the Saquinavir batches...202
7.5.3 The monolayer capacity of the powder samples... 205
7.5.4 Discussion...206
7.5.5 Thermodynamic changes on repeated cycling of Saquinavir batches 210 7.5.6 Conclusions... 216
8 F U R T H E R A N A L Y S I S 218
8.1 Mixer Torque Rheometer
... 2188.1.1 Investigation of the granulation process... 219
8.2 M ethods... 220
8.3 Results... 220
8.4 M icroscopy...222
8.5 Thermogravimetric analysis (TGA) and differential scanning
calorimetry (DSC)
...2248.6 Conclusions
...2249 D I S C U S S I O N ... 227
9.1 Comparison of techniques
... 2279.1.1 Contact Angle methods...227
9.1.1.1 Compressed powder Wilhelmy plate...227
Table o f Contents 11
9.1.1.3 Liquid penetration...228
9.1.1.4 Procedure for contact angle measurement...228
9.1.2 Inverse Gas Chromatography... 229
9.1.3 Flow cell Microcalorimetry... 229
9.1.4 Dynamic Vapour Sorption... 230
9.1.5 Differences between methods... 230
9.1.6 Combining DVS with Microcalorimetry... 230
9.2
Effect of processing Saquinavir
...2319.3
Conclusions
...2329.4
Future Work
...234List o f Tables 12
Table 1.1 Advantages and disadvantages o f contact angle measurement methods. 34
Table 1.2 Selection o f polar probe liquids and their corresponding equation. 39
Table 2.1 Raw material suppliers. 56
Table 2.2 Liquids used as gaseous probes for inverse gas chromatography. 57
Table 3.1 Test probe liquid surface energy component values (mJ.m'^). 65
Table 3.2 Contact angles o f five model powders with a selection o f test liquids. 69
Table 3.3 Surface energy values o f Theophylline using a powder compact. 70
Table 3.4 Surface energy values o f Caffeine using a powder compact. 70
Table 3.5 Surface energy values o f Ethacrynic acid using a powder compact. 71
Table 3.6 Surface energy values o f Salicyclic acid using a powder compact. 71
Table 3.7 Surface energy values o f Ibuprofen using a powder compact. 72
Table 3.8 Contact angles o f five model powders with a selection o f test hquids. 75
Table 3.9 Surface energy values o f Theophylline using a powder covered glass shde.76
Table 3.10 Surface energy values o f Caffeine using a powder covered glass slide. 76
Table 3.11 Surface energy values o f Ethacrynic acid using a powder covered glass
slide. 77
Table 3.12 Surface energy values o f Salicylic acid using a powder covered glass shde.
78
Table 3.13 Surface energy values o f Ibuprofen using a powder covered glass shde. 78
Table 3.14 Contact angles o f Saquinavir batches with a selection o f test hquids. 81
Table 3.15 Surface energy values o f original Saquinavir using a powder c o n ta c t. 82
Table 3.16 Surface energy values o f tray dried Saquinavir (bOOl) using a powder
compact. 82
Table 3.17 Surface energy values o f spin dried Saquinavir (b002) using a powder
compact. 83
Table 3.18 Surface energy values o f tray dried Saquinavir (bOlO) using a powder
c o n ta c t. 84
Table 3.19 Surface energy values o f Vacuum dried Saquinavir (b020) using a powder
compact. 84
Table 3.20 Surface energy values o f heated Saquinavir (b030) using a powder
conpact. 85
List o f Tables 13
Table 3.22 Surface energy values o f original Saquinavir using a powder covered glass
slide. 88
Table 3.23 Surface energy values o f tray dried Saquinavir (bOOl) using a powder
covered glass slide. 89
Table 3.24 Surface energy values o f spin dried Saquinavir (b002) using a powder
covered glass slide. 89
Table 3.25 Surface energy values o f tray dried Saquinavir (bOlO) using a powder
covered glass slide. 90
Table 3.26 Surface energy values o f vacuum dried Saquinavir (b020) using a powder
covered glass slide. 91
Table 3.27 Surface energy values o f heated Saquinavir (b030) using a pow der covered
glass slide. 91
Table 3.28 Process o f error determination. 98
Table 4.1 Contact angles o f model powders. 109
Table 4.2 Surface energetics o f Theophylline. 110
Table 4.3 Surface energetics o f Caffeine. 110
Table 4.4 Surface energetics o f Ethacrynic acid. 110
Table 4.5 Surface energetics o f Ibuprofen. 111
Table 5.1 Probe hquid physical data table required for IGC analysis. 124
Table 5.2 Non-polar surface energy o f Caffeine over a range o f temperatures. 128
Table 5.3 Acid / base character for the model powders using a(yL^)^ \ 129
Table 5.4 Non-polar con^onent o f surface energy for the model powders using
a(YLT\
131
Table 5.5 Statistical differences between the non-polar component o f surface energy
for the model powders. 132
Table 5.6 Acid / base character for the model powders using AHd^'T 134
Table 5.7 Acid / base character for the model powders using boiling point data. 137
Table 5.8 Non-polar component o f surface energy for all Saquinavir batches using
a(YLT\
144
Table 5.9 Statistical differences between the non-polar component o f surface energy
for the Saquinavir batches. 145
List o f Tables 14
Table 5.11 Acid / base character for the Saquinavir batches using 150
Table 5.12 Acid / base character for the Saquinavir batches using boiling point data.
153
Table 5.13 Acid character o f all six powders using three methods o f analysis. 156
Table 5.14 Base character o f all six powders using three methods o f analysis. 156
Table 6.1 Surface areas o f five model powders using BET analysis (Section 6.2.2).
167
Table 6.2 Surface areas o f Saquinavir batches using BET analysis (Section 6.2.2). 168
Table 7.1 Deliquescent relative humidities o f a range o f crystalline salts. 185
Table 7.2 Relative humidities required for monolayer formation in the DVS. 206
Table 7.3 Thermodynamic analysis o f Caffeine, TheophyUine, Ethacrynic Acid and
Saquinavir batches. 207
Table 7.4 Thermodynamic analysis o f Saquinavir batches between 60% and 90% RH.
209
Table 8.1 Tabulated results from DSC and TGA analysis o f Saquinavir batches. 224
Table 9.1 Checkhst for choosing surface characterisation technique. 233
List o f Figures 15
Figure 1.1 Diagrammatic representation o f a surface and a bulk molecule within a
powder solid. 26
Figure 1.2 Surface tension effect. 27
Figure 1.3 Possible interactions of a droplet on a powder surface. 28
Figure 1.4 Inportance o f wetting phenomena. 30
Figure 1.5 Theory behind wetting (steps 1-4). 31
Figure 1.6 Graphs o f water sorption onto a model powder over an increasing relative
humidity range. 46
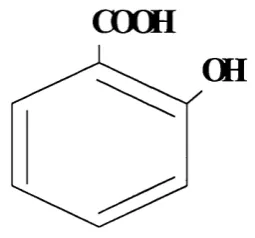
Figure 2.1 Salicylic acid structure. 52
Figure 2.2 Caffeine structure. 53
Figure 2.3 Theophylline structure. 53
Figure 2.4 Ibuprofen structure. 54
Figure 2.5 Ethacrynic acid structure. 54
Figure 2.6 Saquinavir structure. 55
Figure 3.1 Steel die used in compact manufacture. 61
Figure 3.2 Graph showing the change in contact angle with percentage coverage o f
caffeine over a glass slide previously coated with adhesive. 62
Figure 3.3 Cahn apparatus. 63
Figure 3.4 Microbalance apparatus. 64
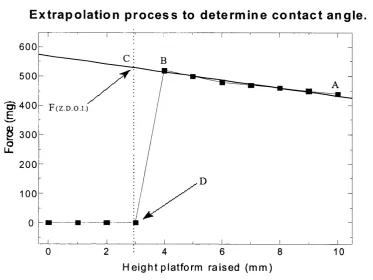
Figure 3.5 Force / depth isotherm used in calculation o f contact angle. 66
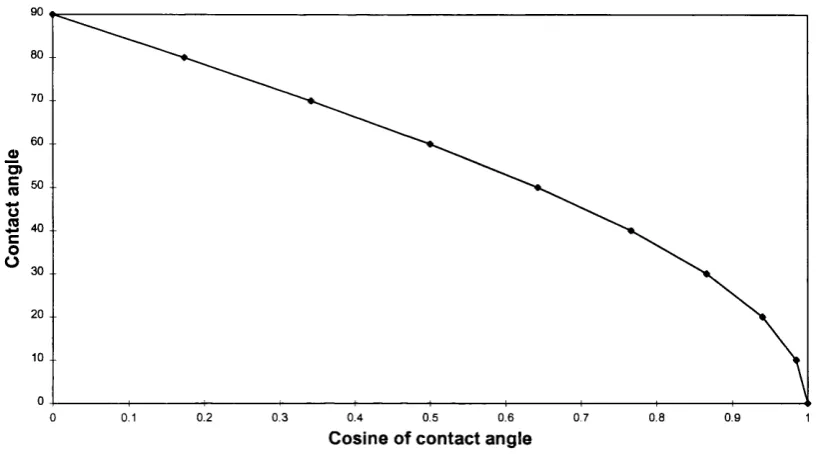
Figure 3.6 Graph showing region used for calculation. 67
Figure 3.7 The cosine curve. 68
Figure 3.8 Assessment o f non-polar surface energies o f the five test powders using the
Van Oss theory (powder compacts used). 73
Figure 3.9 Assessment o f non-polar surface energies o f the five test powders using the
Wu theory (powder compacts used). 74
Figure 3.10 Assessment o f non-polar surface energies o f the five test powders using
the Van Oss theory (powder covered glass slides used). 79
Figure 3.11 Assessment o f non-polar surface energies o f the five test powders using
the Wu theory (powder covered glass slides used). 80
Figure 3.12 Assessment o f non-polar surface energies o f the Saquinavir batches using
the Van Oss theory (powder c o n ta c t used). 86
Figure 3.13 Assessment o f non-polar surface energies o f the Saquinavir batches using
List o f Figures 16
Figure 3.14 Assessment o f non-polar surface energies o f the Saquinavir batches using
the Van Oss theory (powder covered glass slide used). 92
Figure 3.15 Assessment o f non-polar surface energies o f the Saquinavir batches using
the Wu theory (powder covered glass slide used). 93
Figure 3.16 Assessment o f non-polar surface energies o f all powders using
diiodomethane. 99
Figure 3.17 Assessment o f non-polar surface energies o f all powders using polar
hquids with Wu theory. 100
Figure 3.18 Assessment o f non-polar surface energies o f all powders using polar
hquids on powder covered glass slides with Wu theory. 101
Figure 3.19 Assessment o f non-polar surface energies o f ah powders using polar
hquids on powder compacts with Wu theory. 101
Figure 4.1 Typical graph showing straight line gradient. 106
Figure 4.2 Liquid penetration apparatus. 107
Figure 4.3 Liquid penetration o f water into an ibuprofen powder bed. 108
Figure 4.4 Comparison between hquid penetration and a Wilhelmy plate method. 111
Figure 5.1 Schematic diagram o f IGC apparatus:- Model F33 system 115
Figure 5.2 Graph showing calculation of the interaction forces at a powder surface. 121
Figure 5.3 Example o f straight hue plot used to calculate acid-base characteristics. 123
Figure 5.4 Passage o f n-alkane probes through a caffeine powder column at four
elevated temperatures. 127
Figure 5.5 Acid / base plot for acidic model powders using a(yL°)^ ^ 128
Figure 5.6 Acid character for the model powders using a(yL^)®^. 129
Figure 5.7 Basic character for the model powders using a(yi^)^ \ 129
Figure 5.8 Acid / base plot for basic model powders using a(yL°)^^. 130
Figure 5.9 Comparison between IGC and glass shde Wilhelmy plate using a(yL^)®^ for
the model powders. 132
Figure 5.10 Acid / base plot for model acidic powders using 133
Figure 5.11 Acid / base plot for basic model powders using 133
Figure 5.12 Acid character for the model powders using AHd''^^. 134
Figure 5.13 Basic character for the model powders using AHd''^^. 135
Figure 5.14 Acid / base plot for acidic model powders using boiling point data. 136
List o f Figures 17
Figure 5.16 Acid character for the model powders using boiling point data. 137
Figure 5.17 Base character for the model powders using boiling point data. 138
Figure 5.18 Raw data graph of Saquinavir (Ro8959-003) original sample using a(yL°)® ^ 140
Figure 5.19 Raw data graph o f Saquinavir (Ro8959-003) original sangle using
140
Figure 5.20 Raw data graph o f Saquinavir (Ro8959-003) original sangle using boiling
point data. 141
Figure 5.21 Raw data graph o f tray dried Saquinavir (batch 001) using a(yL°)^^ 142
Figure 5.22 Raw data graph o f spin dried Saquinavir (batch 002) using a(yL^)^ \ 142
Figure 5.23 Raw data graph o f tray dried Saquinavir (batch 010) using a(yL^)^\ 143
Figure 5.24 Raw data graph of vacuum dried Saquinavir (batch 020) using a(yL^)^^ 143
Figure 5.25 Raw data graph o f heated Saquinavir (batch 030) using a(yL°)^^ 144
Figure 5.26 Acid / base plot for original, bOOl, b002 Saquinavir batches using a(yL^)"^\ 146
Figure 5.27 Acid / base plot for original, bOlO, b020 and b030 Saquinavir batches
using a(yL°)^ \ 146
Figure 5.28 Acid character for all Saquinavir batches using a(yL°)° ^ 147
Figure 5.29 Base character for all Saquinavir batches using a(yL^)® ^ 148
Figure 5.30 Acid / base plot for original, bOOl, b002 Saquinavir batches using 149
Figure 5.31 Acid / base plot for original, bOlO, b020 and b030 Saquinavir batches
using 149
Figure 5.32 Acid character for the Saquinavir batches using AHd''“^. 151
Figure 5.33 Base character for the Saquinavir batches using AHd'"®^. 151
Figure 5.34 Acid / base plot for original, bOOl and b002 Saquinavir batches using
boiling point data. 152
Figure 5.35 Acid / base plot for original, bOlO, b020 and b030 Saquinavir batches
using boiling point data. 153
Figure 5.36 Acid character for Saquinavir batches using boiling point data. 154
Figure 5.37 Base character for Saquinavir batches using boiling point data. 154
Figure 6.1 Type II adsorption isotherm 161
Figure 6.2 Schematic diagram o f a single microcalorimetric unit o f the TAM. 162
Figure 6.3 Schematic diagram o f a single flow cell. 164
Figure 6.4 Cumulative adsorption isotherms o f model powders with corrected surface
List o f Figures 18
Figure 6.5 Cumulative adsorption isotherm o f Saquinavir batches. 168
Figure 6.6 Cumulative adsorption o f all Saquinavir batches (corrected for surface area
variation). 169
Figure 6.7 Adsorption isotherm o f tray dried batches (bO-10,11,12) corrç>ared to the
original Saquinavir. 170
Figure 6.8 Adsorption isotherm o f vacuum dried batches (bO-20,21,22) conpared to
the original Saquinavir. 170
Figure 6.9 Adsorption isotherm o f heated batches (bO-30,31,32) conpared to the
original Saquinavir. 171
Figure 6.10 Adsorption isotherm o f original, tray dried (bOOl) and spin dried (b002)
Saquinavir batches. 172
Figure 6.11 Mean adsorption isotherm of Saquinavir batches. 173
Figure 6.12 Mean adsorption o f Saquinavir batches (corrected for surface areas
variation). 173
Figure 6.13 Individual adsorption isotherm o f original Saquinavir. 175
Figure 6.14 Individual adsorption isotherm o f tray dried Saquinavir (bOlO). 175
Figure 6.15 Individual adsorption isotherm o f vacuum dried Saquinavir (b020). 176
Figure 6.16 Individual adsorption isotherm o f heated Saquinavir (b030). 177
Figure 7.1 Schematic diagram o f the DVS apparatus. 182
Figure 7.2 Diagrammatic representation o f DVS setup. 183
Figure 7.3 Graphical representation o f experimental protocol. 185
Figure 7.4 Adsorption isotherm o f Caffeine. 186
Figure 7.5 Adsorption isotherm o f Theophylline. 187
Figure 7.6 Adsorption isotherm o f Ethacrynic acid. 187
Figure 7.7 Adsorption isotherm o f Ibuprofen. 188
Figure 7.8 Adsorption isotherms o f model powders (corrected for surface area
variation). 189
Figure 7.9 Adsorption isotherm o f Saquinavir (original sangle). 190
Figure 7.10 Adsorption isotherm o f tray dried Saquinavir (bOl 0). 190
Figure 7.11 Adsorption isotherm o f vacuum dried Saquinavir (b020). 191
Figure 7.12 Adsorption isotherm o f heated Saquinavir (b030). 192
Figure 7.13 Adsorption isotherm o f tray dried Saquinavir (bOO 1 ). 192
List o f Figures 19
Figure 7.15 Adsorption isotherm of Saquinavir batches (corrected for surface area
variation). 194
Figure 7.16 Desorption isotherm of Saquinavir batches (corrected for surface area
variation). 194
Figure 7.17 Sorption hysteresis o f original Saquinavir. 195
Figure 7.18 Sorption hysteresis o f tray dried Saquinavir (bO 10). 196
Figure 7.19 Sorption hysteresis o f vacuum dried Saquinavir (b020). 196
Figure 7.20 Sorption hysteresis o f heated Saquinavir (b030). 197
Figure 7.21 Sorption hysteresis o f spin dried Saquinavir (b002). 197
Figure 7.22 Sorption hysteresis o f tray dried Saquinavir (bOOl). 198
Figure 7.23 Gibbs free energy o f adsorption for three model powders. 200
Figure 7.24 Ethalpy o f adsorption for three model powders. 201
Figure 7.25 Entropy o f adsorption for three model powders. 202
Figure 7.26 The Gibbs free energy o f sorption for Saquinavir batches. 203
Figure 7.27 Enthalpy o f sorption for Saquinavir batches. 203
Figure 7.28 Entropy o f sorption for Saquinavir batches. 204
Figure 7.29 Two possible methods of adsorption. 208
Figure 7.30 The Gibbs free energy o f sorption for the original Saquinavir over 3
cycles. 210
Figure 7.31 The Gibbs free energy o f sorption for the tray dried Saquinavir over 3
cycles. 210
Figure 7.32 The Gibbs free energy o f sorption for the vacuum dried Saquinavir over 3
cycles. 211
Figure 7.33 The Gibbs free energy o f sorption for the heated only Saquinavir over 3
cycles. 211
Figure 7.34 Change in AG between 60% and 90%RH with repeated cycling. 212
Figure 7.35 Enthalpy o f sorption for the original Saquinavir over 3 cycles. 212
Figure 7.36 Enthalpy o f sorption for the tray dried Saquinavir over 3 cycles. 213
Figure 7.37 Enthalpy o f sorption for the vacuum dried Saquinavir over 3 cycles. 213
Figure 7.38 Enthalpy o f sorption for the heated only Saquinavir over 3 cycles. 213
Figure 7.39 Change in AH between 60% and 90%RH with repeated cycling. 214
Figure 7.40 Entropy o f sorption for the original Saquinavir over 3 cycles. 214
Figure 7.41 Entropyy o f sorption for the tray dried Saquinavir over 3 cycles. 215
List o f Figures 20
Figure 7.43 Entropyy o f sorption for the heated only Saquinavir over 3 cycles. 215
Figure 7.44 Change in AS between 60% and 90%RH with repeated cycling. 216
Figure 8.1 Diagrammatic representation o f the dynamometer output. 218
Figure 8.2 Wetting process. 219
Figure 8.3 Rheometer analysis o f granulation properties o f Saquinavir batches by
sequential addition o f hquid binder. 221
Figure 8.4 Rheometer analysis o f granulation properties o f Saquinavir batches over
time (with addition o f hquid binder at time zero). 221
Figure 8.5 Caffeine. 222
Figure 8.6 Theophylline. 222
Figure 8.7 Salicylic acid. 222
Figure 8.8 Ibuprofen. 222
Figure 8.9 Ethacrynic acid. 222
Figure 8.10 Original Saquinavir. 223
Figure 8.11 Tray dried Saquinavir (bOlO). 223
Figure 8.12 Tray dried Saquinavir (bOOl). 223
Figure 8.13 Vacuum dried Saquinavir (b020). 223
Figure 8.14 Heated only Saquinavir (b030). 223
Figure 8.15 Spin dried Saquinavir (b002). 223
List o f Symbols 21
Symbols
Ysl Interfacial tension between solid and liquid phases
Y sv Solid surface free energy
Ylv Liquid surface tension
Y^^ Non-polar component o f surface energy (Lifshitz van der Waals)
Y^ Polar component o f surface energy
Y^* Non-polar (dispersive) component o f surface energy
Y Electron accepting character
Y ' Electron donating character
Ka Acidic behaviour
Kb Basic behaviour
Wi Work o f immersion
Wa Work o f adhesion
Ws Work o f spreading
Wc Work o f cohesion
À Spreading coefficient,
p Compact perimeter
0 Contact angle
r| Viscosity
F Carrier gas flow rate (ml/min)
J Correction factor due to pressure differences
tr Retention time o f the probe
to Retention o f the non-interacting standard
AGcai ° Gibbs free energy o f adsorption.
A Heal ° Enthalpy o f adsorption.
AScai° Entropy o f adsorption.
b No. o f water molecules sorbed per gram
?o Saturated water vapour pressure at 25 ° C
AH*^vap The dispersive conq)onent o f the heat o f vaporisation o f probes
List o f Symbols 22
Aj Total surface area o f stationaiy phase
Vi Total surface volume o f stationary phase
Ks Surface partition coeffieient
Ki Bulk partition coefficient
w weight o f adsorbent in column (g)
Sa Specific surface area o f adsorbent
r Surface concentration o f adsorbate
C Adsorbate eoncentration in gas phase
H Height liquid has risen in time t.
R Effective interstitial pore radius between paeked partieles
Ps.s Adsorbate vapour pressure in equilibrium with standard adsorption
state
Ps.g Adsorbate vapour pressure in the gaseous standard state
T Tenperature o f column (K)
R Gas constant
Pi Pressure at the inlet o f the column (kN.m'^)
Po Atmospheric pressure (kN.m'^)
T| Viseosity o f the liquid.(N.s.m'^)
p Density o f the liquid (g/cm^)
o Surfaee tension o f the liquid (mJ.m'^)
c Unknown geometric environment
m Mass gain (mg)
t Time (seconds)
DN Defined by the reaction enthalpy o f the probe liquid with a reference
acceptor, SbCh
AN Defined as the NMR chemieal shift of^^P contained in (C2Hs)3P0
Chapter 1
Chapter 1 : Introduction 24
1 Introduction
The properties o f all adhesives, coatings and composites are dependent on interaction
phenomena. W ith adhesion, wicking, catalysis, composite formation and many other
related phenomena, the intermolecular interactions across the interface decide the
success or failure o f a process. The presence and nature o f these intermolecular
interactions, which include Lifshitz van der Waals (non-polar) and acid-base (polar)
interactions, each govern different behaviour. For a complete understanding o f
surface and interface phenomena, including adhesion, cohesion and wetting, one must
be able to comprehensively characterise the powder surface. There are a variety o f
methods available for surface characterisation, all with their own individual
advantages and disadvantages.
Wetting is a macroscopic manifestation o f molecular interactions across the interface
separating different liquids and solids. The wetting process is an important factor in
the preparation, storage and use o f all pharmaceuticals, for
example:-a) Dispersion o f powders to form suspensions.
b) Addition o f binders during wet granulation.
c) Adhesion o f polymer films to tablets.
d) Dissolution rate o f solid dosage forms in the gastrointestinal tract.
To ensure that the best formulation is chosen for mass production the accurate
physical characterisation o f all pharmaceutical ingredients is crucial. With new
chemical entities, where only a few grams o f drug are available, experiments would
ideally require only minute quantities so that any difficult powder is effectively
discarded or placed on a more suitable development strategy before too much time and
expense have been wasted. As yet this is not the case, as it may take several grams
before a useful, wide ranging examination o f the surface properties can be made,
leaving this section o f research well up the ladder o f a product’s development. By
investigating a range o f common and novel analytical techniques, the surface
Chapter 1 : Introduction 25
Pharmaceutical powders are usually prepared in batches, whereby a specific quantity
o f formulation are mixed together under specific conditions which remain constant for
the production o f further batches. Unfortunately, having only minor differences in the
batch process, or for that matter the raw materials used, may give rise to subtle
variations between batches. If the drug is a sensitive one, the resulting batch
may have to be rejected (Ticehurst et al., 1996). In the past, changes in batches have
been assigned to variations in the raw materials from suppliers (Landin et al., 1993
and Phadke et a l, 1994), but variations in the surface character may also play a major
part. Changes in the crystalline nature o f a solid (e.g. polymorphic form, crystal habit
and crystal lattice imperfections) result in different surface properties (Buckton and
Beezer, 1991). These changes can alter the processability (flow, compression) and
wetting (dissolution) behaviour and thus the bioavailability o f the product.
Drugs used in production o f solid dosage forms are often assumed to be crystalline in
nature, even though they may have been through varied production processes, for
example freeze drying, spray drying and comminution (Hutteurauch, 1988, Hersey and
Krycer, 1980), which have led to the formation o f amorphous structures with higher
energy than their counterparts. It has been shown that these ‘hot spots’ o f higher
energy may cause the powder to behave in a totally different manner than to other
totally crystalline batches. Examples include:- A decrease in stabilty (Otsuka and
Kaneniwa, 1990) and increased dissolution rates (Chiou and Kyle, 1979, Hendriksen,
1990). In addition, drying along with milling and compression (Hutteurauch, 1988)
can influence the prevalence o f lattice imperfections.
Even if only the top surface layers are affected, this may still cause the
physicochemical properties to change drastically. It is therefore very important to be
able to measure and, if possible, control amorphous content in pharmaceutical drug
formulations. Techniques that analyse the bulk (e.g. X-ray analysis, infra-red
spectroscopy and solid-state NM R spectrometry) are not necessarily sensitive enough
to detect surface modifications, therefore other more selective surface analysis
Chapter 1 : Introduction 26
In this thesis, a selection o f surface analytical methods have been studied, with the
aim o f interrelating and comparing their individual results and so putting together a
step by step guide to the most useful determination of the surface properties of an
unknown powder. Six powders have been studied, all with different surface
characteristics, so that each method can be assessed on its ability to distinguish
between very different powder samples. In addition, one of the powders has been
subjected to a range of drying conditions, to test whether a particular method is
sensitive enough to pinpoint any batch to batch variation, if present.
1.1 S u rfa ce E n ergy
The surface free energy o f a solid powder ( Ys v) refers to the intermolecular forces
between the solid and vapour molecules at the surface in addition to a force of
attraction between the surface solid molecules themselves which hold the lattice
together. This leaves an excess of energy per unit area,
Ysv-Figure 1.1 D iagram m atic representation o f a surface and a bulk m olecule w ithin
a pow der solid.
Therefore it is possible that atoms and molecules at powder surfaces and interfaces
can have energies that are significantly altered to those inside the bulk phase. The
molecules at the surface are influenced by unbalanced molecular forces and therefore
possess additional energy in excess of the bulk materials (Figure 1.1) (Van Krevelen,
1976). In a solid, these molecules are held relatively firmly in place, the ‘free’ energy
cannot be directly measured and therefore indirect techniques have to be used. The
surface is usually a region between a liquid or solid and a gas or vacuum, whilst the
Chapter I : Introduction 27
All reactions, chemical or physical, occur at an interface between two different solids,
liquids or gases. If the surface energy or tension o f a surface is known, one can
predict the outcome of the physical reaction. At a liquid surface, the intermolecular
forces of attraction are greater than the liquid-gas interaction, which results in a net
inward force, known as the surface tension. This unbalanced interaction at the surface
interface results in a tendency for the liquid to minimise its surface area, causing a
small drop of liquid to form a spherical shape. To demonstrate the surface tension of
a liquid, as a vertical capillary tube (Figure 1.2) is lowered into a liquid, the liquid
rises up the capillary above the height of the reservoir. This can also be used to
measure the upward force being the liquid surface tension.
F igure 1.2 Surface tension effect.
Capillary tube
The force acting downwards, is the gravitational pull of the liquid, whilst this is
counterbalanced with the upward force caused by the liquid’s surface tension, which
IS able to maintain a column of liquid above the main reservoir.
The same is true for the surface energy of a powder, except that the intermolecular
forces are large enough to prevent molecules from moving around freely. When a
small volume of liquid comes into contact with a solid surface, a droplet forms, its
dimensions detemiined by a combination of the surface energy of the solid, the
Chapter 1 : Introduction 28
F igure 1.3 Possible interactions o f a droplet on a pow der surface.
Ysl Ysv
Increasing affinity betw een liquid and solid
►
The surface energy of a solid is affected by any vapour in contact with the surface,
therefore the real value is given by>
I l g Y S " Y sv Equation 1.1
Y s -Powder surface energy in a vacuum.
Ysv -Powder surface energy
rie -Equilibrium spreading pressure
0 -Contact angle of a liquid with a powder
Ysl -Powder / liquid interfacial energy
Ylv -Liquid surface tension
The contact angle is the angle that is formed between a liquid coming into contact
with a solid, and it represents an equilibrium of three interfacial force, first described
by Young in Equation 1.2.
Y s v = Ysl+ Ylv
(C O S0)
+IIe
(Young, 1805) Equation 1.2The equilibrium spreading pressure. He, is assumed to be negligible for non-volatile
liquids and can be ignored. Therefore if the surface energy of the solid is known, the
Chapter 1 : Introduction 29
Equation 1.2, Young assumed that the sohd is an ideal one; one that is chemically
homogenous, rigid and completely flat at an atomic level on the surface. In addition,
the solid does not chemically react with or absorb into the bulk any other molecules, be
they gaseous or liquid. The affect of gaseous absorption into a solid is therefore
assumed to be negligible. With all these assumptions in mind, one can predict a single
contact angle for the solid as a whole. Since the contact angle represents an
equihbrium o f the energies at a three phase interface, it provides information about
surface energetics, surface roughness and surface heterogeneity (Johnson and Dettre,
1969).
Certain techniques, discussed later, are able to provide two types o f contact angles,
those being advancing and receding contact data. In theory, they should be equal
although in practise the surface roughness o f the powder being presented to the liquid
results in differing advancing and receding contact angles. Commonly, the receding
angle is close to zero and therefore the advancing angle is mainly used to calculate
surface energy data (Good, 1953). The difference between the two angles is called
hysteresis, and it is given the simple mathematical
fbrrrr-Hysteresis = 0a - 0r Equation 1.3
Other factors such as powder heterogeneity and bulk penetration o f a liquid will often
result in contact angle hysteresis (Anhang and Gray, 1982), and even the environment
and preparation o f the powder surface may also affect the contact angle. Therefore the
thermodynamic significance o f the contact angle measurement is often questionable.
1.2 Wetting process
Wetting occurs when one fluid or vapour is displaced by another at a surface. In most
Chapter 1 : Introduction 30
Figure 1.4 Importance of wetting phenomena.
Suspensions for constitution
Preconstituted suspensions
W et granulation
A
Wetting Phenomena
Emulsions
Film coating
— > Enteric coating
Dissolution (tablets and capsules)
Oral controlled release
(Shanker, 1994)
The thermodynamics o f a powder being wetted by a liquid are comprised o f three
distinct steps as shown in Figure 1.5.
1.2.1 Adhesion
Adhesion can occur when one side of the model solid cube has exchanged contact with
vapour for contact with the liquid phase. The energy required for this step is termed
the ‘work o f adhesion’, Wa,
whereby:-Wa — Ysl - (Ysv + Ylv) Equation 1.4
One solid/liquid interfacial energy is gained while both one solid surface energy and
one liquid surface energy are lost.
When Equation 1.4 is combined with the Young’s Equation 1.2, the Young-Dupre
equation is
Chapter I : Introduction 31
F igure 1.5 T heory behind w etting (steps 1-4).
^ ' Ideal solid cube
;
2. Adhesion
3. Immersion 4. Spreading
(Parfitt, 1969)
1.2.2 Im m ersion
The liquid spreads over more of the powder surface, so reducing the interaction
between powder and vapour. The ‘work of immersion’, Wi, is the energy process
involved, whereby four faces of the cube which were in contact with vapour are now
immersed in
liquid:-Wi = 4ysl - 4ysv Equation 1.6
Combining Young’s Equation 1.2 with Equation
1.6:-Wi = -4yi,v (Cos0) Equation 1.7
1.2.3 Spreading
The ‘work of spreading’, Ws, or the spreading coefficient, s, causes one surface/liquid
energy and one liquid vapour to be gained whilst losing one solid vapour energy. This
as:-Chapter 1 : Introduction 32
Ws = Ysl+ Ylv - Ysv Equation 1.8
Combining Young’s Equation 1.2 with Equation
1.8:-Ws = - Y l v ( C o s 0 - 1 ) Equation 1 . 9
From Equations 1.5, 1.7 and 1.9, the wettability o f a powder with several different
hquids can be predicted.
For spontaneous wetting to occur, all Wa, Wi and Ws must be positive in
nature:-a) Adhesion... Ylv(1+Cos0)>O .Cos0 >-l and 0<18O°
b ) Immersion... Y l v ( C o s 0 ) ; > O . . C o s 0 > 0 and 0 < 9 O °
c) Spreading... Ylv (Cos0-l)5rO ..Cos0 = +1 and 0>O°
Therefore, the greater the affinity between powder surface and hquid, the more the
liquid spreads and therefore the smaller the contact angle. A point is reached when the
contact angle becomes zero, the liquid perfectly wets the powder surface and spreading
occurs. Therefore the contact angle is able to indicate the degree o f wettabihty o f a
particular solid with a known hquid.
1.3 Critical Surface Tension (yc)
Yc is the critical surface tension o f a sohd and is defined as the surface tension o f a
wetting hquid, above which spontaneous wetting does not occur. It is derived by
finding the contact angles o f a sohd with various hquids o f differing surface tension and
extrapolating them back to Cos0=l (Fox and Zisman, 1950). In practice this is
inaccurate, due to increases in error by extrapolation, and that certain hquid
combinations produce unsuitable data (discussed in detail in Chapter 3). Therefore the
critical surface tension should only be used for non-polar sohds tested with non-polar
Chapter 1 : Introduction 33
1.4 Deriving contact angles experimentally
1.4.1 Liquid with unknown surface energy
There are several methods o f surface tension analysis
available:-a) Capillary rise - extent o f ascension o f liquid through a powder bed.
b) Drop volume/weight - drops of liquid are formed at the end o f a capillary
tube, and by measuring their volume and weight, the surface tension can be
calculated.
c) Du Nouy ring tensionmeter - measures the force o f interaction between the
solid ring and the liquid with unknown surface tension.
d) Wilhelmy plate - uses the same theory as the Du Nouy ring, except that the
ring is substituted with a sohd plate o f known perimeter.
Both parts c) and d) involve the interaction o f a characterised sohd (e.g. glass slide)
which is brought into contact with the hquid in question.
1.4.2 Solid with unknown surface energy
Contact angle measurement can either be achieved by hquid penetration into the sohd
powder bed, a sessile drop placed onto a powder plate or the interaction between a
powder plate that is slowly brought into and out o f a test hquid reservoir.
1.4.2.1 Liquid penetration
Liquid penetration involves the passage o f a test hquid into a powder bed. By
measuring the rate o f hquid uptake, one can calculate a contact angle with the
knowledge o f the hquid's viscosity, density and surface tension. It is discussed in more
Chapter 1 : Introduction 34
1.4.2.2 Powder compacts
All techniques that involve the compaction o f powders may be o f questionable use
since alterations in surface energy may occur with sensitive powders under
compression. The advantages and disadvantages o f these methods are given in the
table below. The Wilhelmy plate technique is discussed more fully in Chapter 3,
since it has been used in my research.
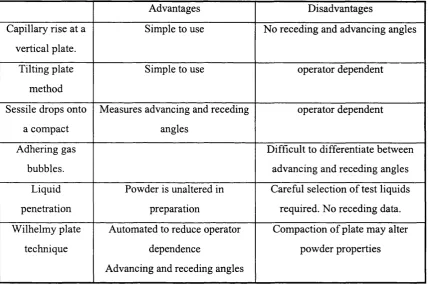
Table 1.1 Advantages and disadvantages of contact angle measurement methods.
Advantages Disadvantages
Capillary rise at a
vertical plate.
Simple to use No receding and advancing angles
Tilting plate
method
Simple to use operator dependent
Sessile drops onto
a compact
Measures advancing and receding
angles
operator dependent
Adhering gas
bubbles.
Difficult to differentiate between
advancing and receding angles
Liquid
penetration
Powder is unaltered in
preparation
Careful selection of test liquids
required. No receding data.
Wilhelmy plate
technique
Automated to reduce operator
dependence
Advancing and receding angles
Compaction of plate may alter
powder properties
1.5 Surface energy determination using contact angle data
Several different theoretical methods have been utilised over the 20* Century,
although only two o f the most recent theories have been utilised in this thesis.
1.5.1 Van Oss theory
Surface energy (Ysv) can be subdivided into polar and non-polar (dispersive)
components, the sum o f the components being equal to the total surface energy (Van
Chapter I : Introduction 35
Ysv = + Y s ^ Equation 1.10
LW - Lifshitz Van der Waals interactions (non-polar) combining all the
electromagnetic interactions, temporary oscillating dipoles, permanent dipoles and the
induced dipole-induced dipole forces. (Section 1,5.1.1)
AB - Lewis acid-base interactions (polar) involve electrostatic interactions.
(Section 1.5.1.2)
The two components are additive since there is no physical interaction between LW
and AB forces.
1.5.1.1 Van d er W aals interactions (ys^^)
Interm olecular interactions in liquids always involve van der W aals interactions
especially between the nearest and next nearest neighbouring molecules. Van der
Waals interactions also occur in gases, when a gas m olecule has a near collision with
another gas molecule. As the two molecules approach one another, dipoles becom e
orientated to maximise their attractive forces. The Lifshitz m athem atical theory o f
the attraction between macroscopic bodies is used to estimate the free energy values.
Three kinds o f attractive forces can occur, all o f which contribute to the van der
W aals interactions.
a) London dispersion forces which are proportional to the square o f the m olecular
polarizability.
b) Keesom dipole - dipole interactions which can occur only if dipoles are already
present.
c) Debye interactions o f dipoles with dipoles which are induced in adjacent
molecules. In each case the attractive energy is proportional to the inverse sixth
pow er o f the interm olecular distance between the two molecules.
1.5.1.2 Lewis Acid-Base interactions (Ys^^)
The polar component, (Y § ^ ), is an important force o f attraction involved in adhesive
bonds o f coatings, laminates and in stabilised particulate suspensions. It is comprised
o f two parameters which describe the electron acceptor (Ys^) and donor (ys ) affects,
whereby;-Chapter 1 : Introduction 36
- 2(Y s\ys f Equation 1.11
The tw o values that give are not additive. Since absolute values o f ys and ys
cannot be measured, all values are compared to water,
y
= 51 mJ.m^ , wherebyboth Ys"^ and
y
s' have been ascribed the value 25.5 mJ.m^.These polar interactions involve hydrogen bonding which contributes to the surface
energy. These commonly consist o f a hard subset o f the Lewis acid/base (HSAB)
interactions. Hard acid/base interactions are dominated by electrostatic interactions,
which occur to a great extent with hydrogen bonds between protons (H^) and electron
donors. It has been proved that the energy o f hydrogen bonds is entirely independent o f
dipole moments and depends only on the acidity o f the hydrogen donor and the basicity
o f the hydrogen acceptor (Pimentai and McClellan, 1960). Acid/base interactions
(such as hydrogen bonding) provide a considerable interaction making up the cohesive
energy in polar liquids. For this to occur, the polar liquid requires both acidic (electron
accepting) and basic (electron donating) sites. Therefore it follows that acidic hquids
with negligible basicity and basic liquids with negligible acidity have no specific self
association, resulting in that their cohesive energy and surface tension being only due
to their non-polar (dispersion) force interactions (Fowkes, 1964).
1.5.1.3 Possible interactions
From Equations 1.10 and 1.11 it can be seen that materials can be either non-polar,
bipolar or monopolar, where any purely non-polar material has no acid-base interaction
capacity. There are seven possible interactions that can occur between two molecules
(Van Oss et al.,
1988):-1). Non-polar / Non-polar 5). Monopolar/monopolar
2). Non-polar / monopolar (+ve) (different signs)
3). Non-polar / monopolar (-ve) 6). Monopolar / bipolar
Chapter 1 : Introduction 37
1.5.1.4 Van Oss equation derivation
Equation 1.11 can be expanded to describe the polar interaction between a liquid and a
solid to
give:-YsL^® = 2 {(ys^YsT ^ + (Yl^-YlT ’^ - (Ys^’-YlY ’^ - (Ys'-YlY ’^} Equation 1.12
Fowkes (1964) showed that for a totally non-polar liquid the non-polar interaction with
a solid is described
as:-Ysl'^'^ = Ys"''^ +Yl'^'^ -2(ys' ^ ^ . ' Equation 1.13
The sum o f Equations 1.12 and 1.13 is equivalent to the polar and non-polar
interactions:
-YsL""^={(Ys"T'+(YL'T'}' + 2{(Ys\YsT + (YL\YLr4Ys\YLr4Ys^^
Equation 1.14
It is now possible to rewrite Young's equation in tenns o f LW and AB interactions:-
Ylv^^^(1+cos0) = 2{(Ys^^.YL^^f^ + (Ys^Yl)®^ + (Ys’-Yl'')^^} Equation 1.15
1.5.1.5 Polarity ratios
Equation 1.15 is theoretically solvable, but the square roots make it difficult to handle.
To simplify matters, one can remove both the polar factors (ys^ and y s’) and replace
them with a polarity ratio which describes the unknown terms in relation to water
(Buckton, 1995). The derivation is shown
below:-In this example, the test liquid is formamide (F) with an unknown sohd (S).
Yf™^(1+cos0sf) = 2{(Ys^^.YF^^)"^ + (Ys^Yf’)^^ + (Ys’-Yf'')®^} Equation 1.16
giving:-YF^ = 2(Y F".Y F -r
Chapter 1 : Introduction 38
Equation 1.17
•IB
\o.5 Equation 1.18
Combining Equations 1.16 and
1.18:-YF"'°'"(l+cos0sF) = 2((Y s''".Y /'")"" + 9.5LW . . LWxO,5 Ys
0.5
+ 9.5
r - \ 0-5
Ys
) Equation 1.19
Yf™ L 1+C O S0SF) = 2 (y s"'*.Yf'-'")°' + 19
0,5 / 0.5
1 1 + 19 Ys
\ Y F 2
Equation 1.20
The polarity ratio for formamide in respect o f water (w) is defined
as:-0pw^ = Yf
^Yff
Equation 1.21
/. ( Y F T = ÔFw\ ( Y w ' f
Combining Equations 1.20 and 1.22:-
YF"''"(l+cosesF) = 2 (Y s"'^.Y F "T '+ 19
Equation 1.22
+ 19
{ r i T
,0.5 5 „ { n - )Equation 1.23
Using Equation 1.21 for water and the unknown solid, ô^w values can be substituted:
Yf™ \ 1 +c o s0s f) = 2 ( YsLW . . LW\0.5'''* .Yf' ' " ) " ' + 1 9
V y+ 19V ^Fw y
Equation 1.24
Chapter 1 : Introduction 39
becomes:-Yf™’'(1+cos0sf) = 2(Ys™-Yf‘'* )°' + 63.55ÔSW* + 15.25ôs* Equation 1.25
Equation 1.25 can be derived in the same manner for any o f the test probe liquids, as
long as all the liquid’s surface energy parameters are known, including and y'
values.
Table 1.2 Selection of polar probe liquids and their corresponding equation.
Test probe liquid Equation
W ater (W)
Formamide (F)
Ethylene Glycol (E)
Yw™^(l+cos8gw) = 2(Ys‘'*-Yw''")°"+ 51ÔSW* + 51ÔSW
Yf™^(1+cos0sf) = 2(Ys‘-".Yf‘'*)"^ + 63.55ÔSW* + 15.250^^
YE™"(l+cos0se) = 2(Ys‘-*.Ye‘- T '+ 6 9 .2 4 0s„" + 13.9950s«
This enables all acid-base and non-polar interactions to be found with contact angles
for the test material using only three probe liquids.
1.5.1.6 Two possible methods using the Van Oss theory
a) Using one non-polar liquid and two polar liquids.
The totally non-polar liquid has no polar properties, therefore y g ^ is equal to zero and
can be ignored from Equation 1.15, leaving:
Ylv^°^(1+cos0) = Equation 1.26
Since only the non-polar component (y^^^) o f the powder is unknown, this contact
angle alone can be used to calculate the non-polar component o f surface energy for the
powder. Subsequently, the two polar liquids yield powder contact angles that can be
placed into Equation 1.15 to form two separate equations. These are solved
Chapter 1 : Introduction 40
b) Using three p o la r liquids.
This is only necessary if the non-polar liquid is unable to produce a contact angle with
the test material due to immediate spreading on contact (co s0 > l). By using three
polar liquids, three equations can be formed all having three unknowns. Solving two
equations at a time to eliminate the dispersive com ponent (Ys^^) will produce two
hybrid equations each having only two unknowns. They are solved simultaneously
giving the electron acceptor (Ys ) and donor (ys ) which can then be used to back
calculate the non-polar com ponent o f surface energy
(Ys^^)-1.5.2 W u ’s theory
A harmonic mean approach was developed by Wu (1971), which was able to obtain a
greater correlation between experimental and theoretical calculations than previously
for low energy systems, such as organic liquids.
Yi2 = Yi + Y 2 - 4
^
r t
■A
'
- 4
T • T
r t
T
V
/
V/
Equation 1.27
Y^ - Polar com ponent
Y^ - Non-polar (dispersive) com ponent
For higher energy systems (e.g. mercury or glass) Wu was able to simplify the above
equation
to:-7,(1 + Cose) = 2 {( y,". y /)°^ + (y, ^ y /) " '} Equation 1.28
The two Equations 1.27 and 1.28 can be com bined with Young’s equation to give
Chapter 1 : Introduction 41
and
Y i ( l + Cos0) =4
r\
•r i
y f
+ yP
y\ ■
Y2
ri ■
V2
+
r f + 72 + î'2
Equation 1.29
Equation 1.30
Equations 1.29 and 1.30 each contain two unknown terms, those being the solid’s non
polar (dispersive) and polar components o f surface energy. Contact angle data from
only two liquids can produce a pair o f simultaneous equations that can be solved to
give values for the two unknowns. Alternatively, an iterative computer program is able
to do this upon entering the contact angle data.
1.6 Potential use of surface energy data
Surface energies are more useful than contact angles since they describe the general
characteristics o f a powder surface which can then be related to any liquid. Whereas a
single contact angle only describes how one particular liquid interacts with that powder
surface. Surface energy can be used to give values for work o f adhesion, Wa, w ork o f
cohesion, Wc and the spreading coefficient, X.
Wa = 4 {
W
here:-Wci = 2 Yi
2,12 — Wal2 - Wci
2,21 — Wa21 - Wc2
' r f r { '
+
y f + yP
V / y
Equation 1.31
Equation 1.32
Equation 1.33
Chapter 1 : Introduction 42
•^12 — 4 {
r f + Y
+
r\ ■ ri
y," +
Y \
ri
} Equation 1.35
The spreading coeflficient is the difference between Wa and Wc, where Equation 1.35
describes the spreading o f phase 1 over phase 2 and vice versa. If Xu is positive, phase
1 will spread easily over phase 2 while if negative spreading o f phase 1 over phase 2
will not be favourable. These values have been used to predict the physical stability in
non-polar, non-aqueous suspensions (Parsons et al., 1992).
1.7 Alternative methods of surface analysis
Other techniques and theories have been developed that do not use contact angle data
and being able to interrelate all o f them would be prove useful.
1.7.1 Adsorption
Adsorption can be defined as the presence o f a greater concentration o f foreign
molecules at the surface than in the bulk o f the material and it can occur at any type o f
interface. There are two kinds o f adsorption, chemical and physical.
a) Chemisorption - usually an irreversible process where strong bonds are able
to form a monolayer coverage.
b) Physisorption - a reversible process whereby a monolayer or multilayer o f
foreign molecules completely cover the solid surface, but are only held there
with weak bonds (e.g. hydrogen bonds).
In pharmaceutical research, physisorption is interesting due to its reversible nature.
Within a crystalline solid, although the majority o f its atoms or molecules will be
arranged in a ordered, repeatable pattern, there will often exist defects, imperfections
and regions o f amorphous structure. These alterations are referred to as ‘hot spots’
Chapter 1 : Introduction 43
majority. They have a greater molecular mobility and often expose more reactive
chemical groups o f their molecule to the environment, allowing them to react
differently with gaseous vapours. These factors affect the overall characteristics o f the
crystalline solid.
The following techniques o f surface analysis all involve adsorption o f gaseous
molecules to a powder surface, showing that the nature o f sorption can give
information on the actual characteristics of a particular powder surface.
1.7.2 Inverse gas chromatography
Gas chromatography involves the separation process o f a mobile phase (gaseous
molecules) over a solid phase (powder column). With inverse gas chromatography
(IGC), the solid phase is the powder o f unknown character while the mobile phase
consists o f a number o f well characterised low molecular weight probe molecules.
1.7.2.1 History of IGC development
The original definition o f acidity and basicity was described by Lewis (1923),
stating:-‘'An acid molecule or ion whose incomplete electronic arrangement allows it to bind
to another species by accepting an electron pair from that species, whereas a base is a
molecule or ion capable o f donating an electron pair to a Lewis acid, resulting in the
formation o f a co-ordinate covalent bond. ”
It is limited in that it excludes reactions such as single electron transfer reactions
(redox), ft ee radical combination reactions and the like. Several years later, Sedgwich
(1927) used the terms electron donor or donor for a Lewis base, and electron acceptor
or acceptor for a Lewis acid. The same concept was introduced by Ingold (1933) but
it used the new tenus ‘electrophile’ for a Lewis acid which accepts electrons from
carbon and ‘nucleophile’ for a Lewis base which donates electrons to a carbon atom.